Overview
KronoGraph allows you to set up the timeline in many different ways so you can change its look, feel and behavior to suit your requirements and data.
Options
Most timeline settings can be found in TimelineOptions. Pass them to the options method options prop to make the changes.
The timeline below uses the default settings. The examples below illustrate the effect of changing the background color, entity label colors, focus control display, fonts, entity highlight color, scale positions, annotations settings and more.
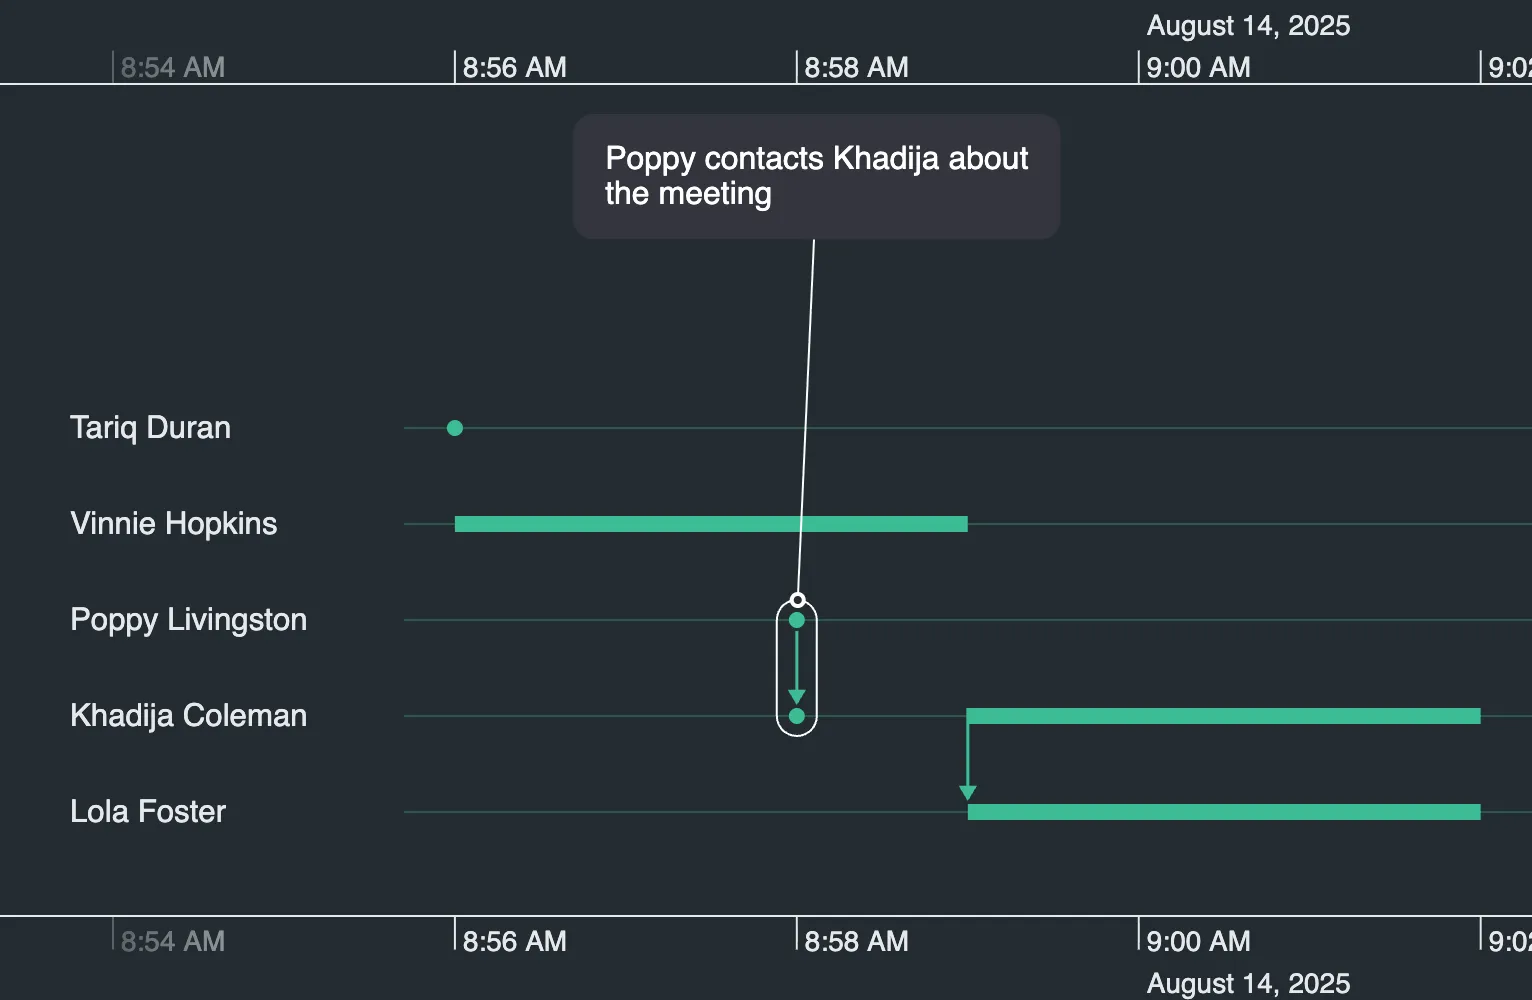
Show Lens Highlight
The lens view control  is shown automatically when there's not enough vertical space to show entity labels.
By default, the entities to be magnified in lens view are shown in a highlighted band, known as the lens highlight. To disable it, as illustrated here, use the showLensHighlight option:
timeline.options({ showLensHighlight: false });<Timeline
options={{
showLensHighlight: false,
}}
/>;See the Lens example for more information.
Expanded Rows
Usually an entity's timeline is displayed using a single row, known as the entity row. If entities have duration events overlapping with instantaneous events, or an event summary, it can be helpful to add extra sub-rows to display them more clearly (if there's room).
You can set entity rows to expand using the expandedRows API so that users can zoom in on busy areas and see individual events more clearly, as illustrated:
You can set entity rows to expand using the expandedRows method so that users can zoom in on busy areas and see individual events more clearly, as illustrated:
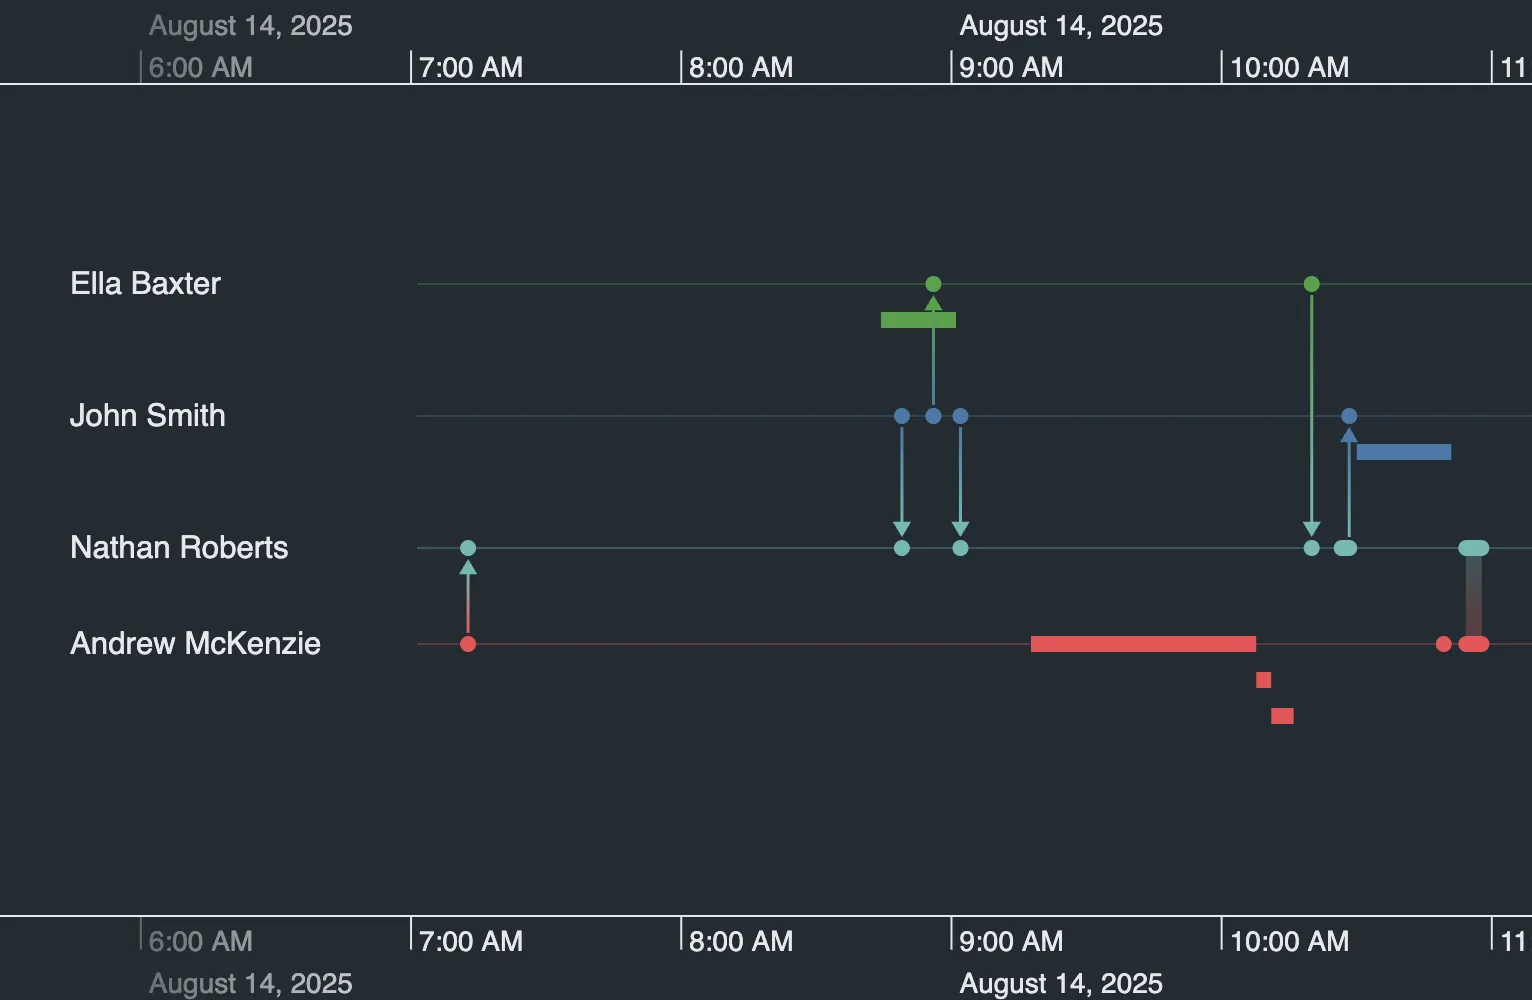
Refine how entity rows are expanded using:
-
The
expandedRowstimeline options allow you to specify display options. -
The
expandedRowsobject specifies the entities whose rows are to be expanded. -
The
expandedRowsevent is fired when the set of entities to be expanded changes. -
The
expandedRowsprop returns the ids of the entities to be expanded.
To explore further, take a look at the Expanded Rows example.
Note that you can also control whether entity lines are shown using the showEntityLines option.
Entity Label Area Width
By default, KronoGraph adjusts the width of the entity label area automatically to best display the labels in your data. Alternatively, you can set the label area width to a custom value and allow the user to adjust the area width by dragging the area boundary, shown below.
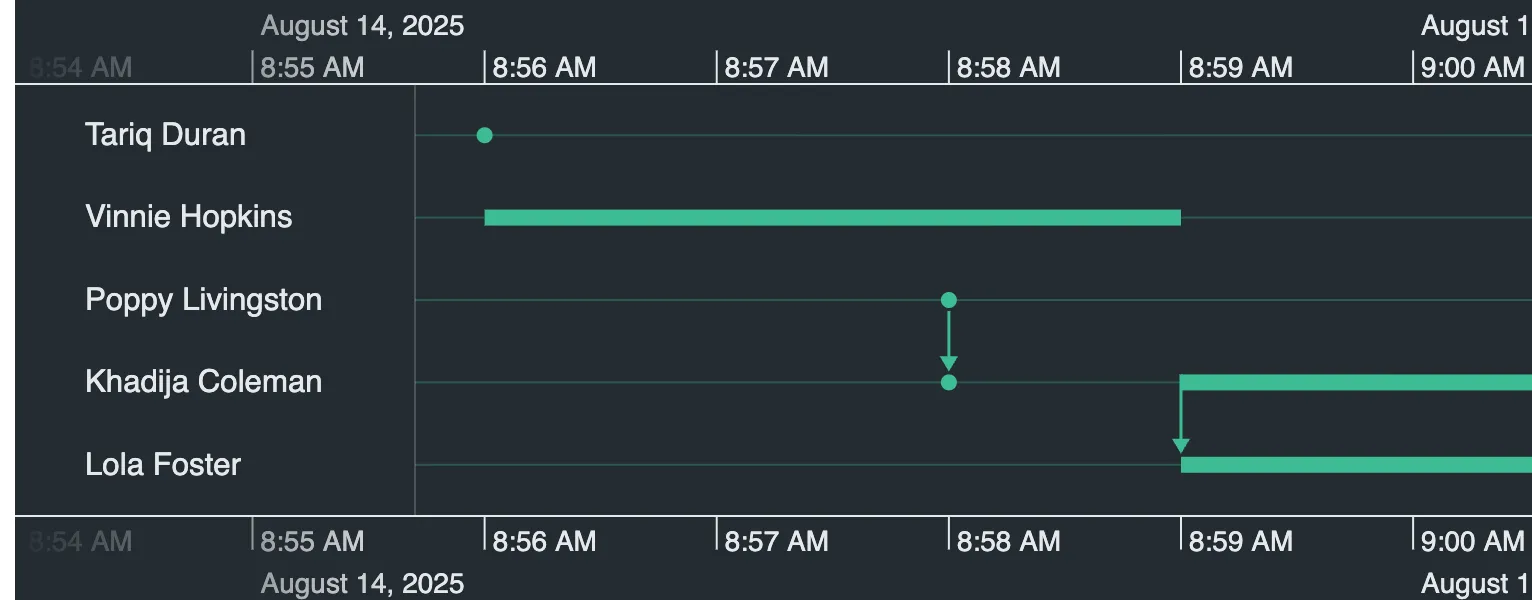
timeline.labelAreaWidth("fixed", 200);<Timeline labelAreaWidth={{ mode: "fixed", width: 200 }} />;The width is set in pixels, and can be anywhere between 125px and 80% of the width of the timeline. Any value outside of these limits will be automatically adjusted to be within the limits.
For further details see the labelAreaWidth() API and the Styling the Timeline example.
For further details see the labelAreaWidth() API and the Styling the Timeline example.