Introduction
ReGraph is a library of React components and analysis functions for client-side visualization of connected data.
You can try out ReGraph directly in your browser by opening a live code Playground and when you're ready, our tutorials can help you add ReGraph to your existing app or help you create a brand new ReGraph app.
ReGraph includes two visualization components - a chart to draw relationships between connected entities, and a time bar to represent events occurring over time:

Basic Chart
Log in to view live examplesBasic Timebar
Log in to view live examplesAdd ReGraph to your App
Download the latest version of ReGraph:
Download ReGraphFor Safari browsers, hold the ⌥ Option key when pressing the Download button to download the correct .tgz format.
Copy the ReGraph bundle into your project directory. Do not change the file name.
cd ~/path/to/project
cp ~/Downloads/your_downloaded_file_name.tgz .
Install the bundle as a local package from inside your project directory using a package manager:
npm install file:your_downloaded_file_name.tgzyarn add ./your_downloaded_file_name.tgzpnpm install file:your_downloaded_file_name.tgzNow you can import ReGraph into your project:
import React from 'react';
import { createRoot } from 'react-dom/client'; // enables concurrent rendering
import { Chart } from 'regraph';

const items = {
 node1: { label: { text: 'Hello World!' } }  // data in JSON where node1 is node id
};
const jsx = <Chart items={items}/>;
const container = document.getElementById('root');
const root = createRoot(container);
root.render(jsx);
Create New ReGraph App
If you don't have an existing project, you can create one with Vite by following the Vite Getting Started guide for your preferred package manager.
Alternatively, run the following quick start command to create a React Vite app:
npm create vite@latest my-regraph-app -- --template reactyarn create vite my-regraph-app --template reactpnpm create vite my-regraph-app --template reactIf you are prompted about any settings while the command is running, you can accept the default values for now.
Once this process has completed, start a development server:
cd my-regraph-app
npm install
npm run devcd my-regraph-app
yarn
yarn devcd my-regraph-app
pnpm install
pnpm run devBy default, Vite runs a development server at http://localhost:5173.
Next, download the latest version of ReGraph:
Download ReGraphFor Safari browsers, hold the ⌥ Option key when pressing the Download button to download the correct .tgz format.
Move the download into your new project's root folder. If you are on a UNIX-like operating system, you can do this from the terminal:
cp ~/Downloads/your_downloaded_file_name.tgz .From your project's root folder, install the bundle as a local package:
npm install file:your_downloaded_file_name.tgzyarn add ./your_downloaded_file_name.tgzpnpm install file:your_downloaded_file_name.tgzNext, open the App.jsx file in the src folder. This is where the component is declared. We will replace the boilerplate application with a ReGraph Chart component.
First, replace the import statements with an import statement for ReGraph:
import { Chart } from 'regraph';And then replace the App() function with a new function:
function App() {
return (
// returns a div with a ReGraph Chart that fills the viewport
<div style={{ height: '100vh', width: '100vw' }}>
<Chart
// a dictionary where each key is an item id
// and each value is the item's definition
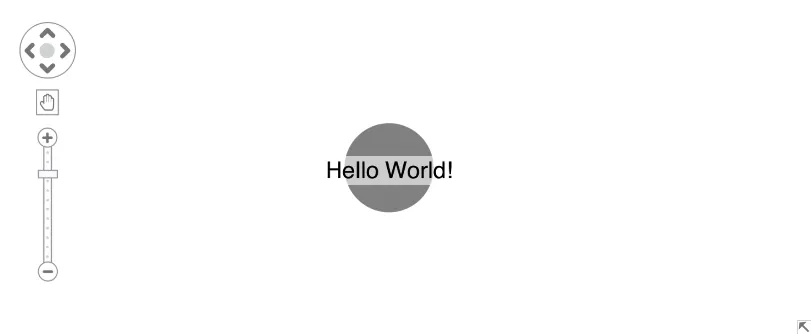
items={{ node: { label: { text: 'Hello World!' } } }}/>
</div>
);
}You should now see a ReGraph chart with a single node.
The chart sets its height and width to equal the size of its parent element, so any style should be set on the parent element.
Now that you have your first project, here's a few suggestions on where to go next if you're interested in...
- Adding font icons to items in your chart? Head to Fonts and Font Icons docs.
- Grouping the nodes or links in your chart? See Combining Nodes and Aggregating Links.
- Filtering chart by time or learning about changes over time? Read about the Time Bar.
- Running graph analysis or social network analysis? Take a look at Graph Analysis.
Updating
To update to the latest version of ReGraph, or to update your license, you need to replace your existing regraph.tgz bundle with the latest version and add it to your project.
First, download the latest version of ReGraph:
Download ReGraphFor Safari browsers, hold the ⌥ Option key when pressing the Download button to download the correct .tgz format.
Next, copy the bundle into your project. Do not change the file name.
cd ~/path/to/project
cp ~/Downloads/your_downloaded_file_name.tgz .
If you already have a bundle in your project, you should delete it now.
Finally, remove the old version and install the bundle again from inside your project's root folder with your package manager:
npm uninstall regraph
npm install file:your_downloaded_file_name.tgz
yarn remove regraph
yarn add ./your_downloaded_file_name.tgzpnpm remove regraph
pnpm install file:your_downloaded_file_name.tgzTo verify the update was successful, see the header comments of node_modules/regraph/index.js, or ask the package manager which version was installed:
npm list regraphyarn list --pattern regraphpnpm list regraphIf you are upgrading ReGraph after your license or your evaluation version had expired but your chart still isn't displaying correctly after the upgrade, try clearing the package manager's cache and installing the package again:
npm cache clean --force
npm install file:your_downloaded_file_name.tgz
yarn cache --clean
yarn add ./your_downloaded_file_name.tgz# step not required for pnpmIf you need any help with updating please contact support.
Designing your Application
ReGraph forms part of the front end of your application and is entirely divorced from any backend architecture. It is up to you how to pull data into your page and format it into ReGraph's object format.
ReGraph is typically kept in a stateful container within your application. This container is responsible for updating ReGraph's state and integrating it with the other components.
State can exist simply in the state of a component, or a store provided by a React Hook, or in a Redux store. ReGraph is agnostic to this and behaves well in each environment, as long as its props are set correctly. See Re-rendering in ReGraph for more details.
Examples in this page typically assume that state is held in a component and passed to ReGraph by returning JSX from the component, as shown in the example below:
// Import various dependencies into the environment
import React from 'react';
import { Chart } from 'regraph';
import { fetchData, convertToReGraphFormat } from './myapp/helpers';

// Define the component
function App() {
  // Initialize app state
  const [state, setState] = React.useState({ items: {} });

  React.useEffect(() {
    // Load data from a data source
    fetchData().then((data) => {
      const items = convertToReGraphFormat(data); // your own custom formatter

      // When data is ready, set it on the component's state
      setState({ items });
    })
  }, []);

  // Create a ReGraph chart and push data into it from state
  return <Chart items={state.items} />
}
Note that the ReGraph source code needs to be sufficiently obfuscated before your application is distributed.
ReGraph Basics
The ReGraph chart is designed to visualize connected data sets. Although it can render a huge number of items, effective data visualization should aim to limit the amount of visible data. ReGraph comes loaded with features to filter and analyze your data. For examples, see our Graph Analysis stories.
The ReGraph time bar shows events over time. It can be used to filter items in a chart to events occurring within a specific time period, which provides an excellent way to reduce clutter in the chart. It can also highlight activity for a particular item.
ReGraph allows you to show a chart or time bar by describing its state with a series of objects. State can mean a number of things to ReGraph, including the data to render, the positions of nodes, layout and animation rules, viewport control and options. This state is passed to the component via props and will queue an animated redraw for the chart.
The full list of ReGraph props can be found in the API Reference.
Some state is controlled by ReGraph itself, for example when a layout is run and positions change, or when a user clicks on a node. In these cases, state changes are published to your application via an onChange event handler. You can hook to this to pass changes back to your application, for example to prevent the chart from moving during changes.
Data is loaded into ReGraph by passing a plain JavaScript object into the items prop. Each item can be one of the following types:
- Node: A single point or entity in the graph. Nodes typically render as circles, but can also be boxes.
- Link: A connection between nodes. Links must have an
id1andid2property. - Annotation: A note connected to item(s) in the chart. Annotations must have a
subjectproperty. - Times: Items with a
timesproperty represent a point in, or period of, time.Timesis only used by the time bar component.Timescan be added to nodes or links.
Each key of the items object is the id of an item, and its value defines that item. To update an item, simply pass in a new object with updated values.
See the API Reference for a full guide to the available props and data formats.
MCP Servers
Model Context Protocol (MCP) is an open-source standard to expose tools, data, or functionality to AI applications.
ReGraph MCP server enables AI agents in your code editor to access our APIs and docs and provides more accurate and relevant help when developing with ReGraph.
All Cambridge Intelligence products have MCP servers. You can use them individually or together when integrating multiple products from our suite.
MCP servers are compatible with different code editors thanks to the universal open-source standard. Generally, code editors have an MCP configuration file, often named mcp.json. Every MCP server is added to this config file as a new entry:
{
   "servers": {
      "regraph": {   // our ReGraph MCP server
           "url": "https://mcp.cambridge-intelligence.com/regraph",
          "type": "http"
      },
      "mapweave": {   // our MapWeave MCP server
          "url": "https://mcp.cambridge-intelligence.com/mapweave",
          "type": "http"
      },
      / ... /
   }
}
This section shows how to add MCP servers to selected code editors. If your code editor isn't here, check the official documentation for the exact location of the MCP config file.
Claude Code
First, install Claude Code globally in your environment:
npm install -g @anthropic-ai/claude-codeNext, add a new MCP server to Claude and name it:
claude mcp add --transport http my-regraph-mcp-server https://mcp.cambridge-intelligence.com/regraphFinally, verify that the server is running:
claude mcp listFor details and troubleshooting, see Connect Claude Code to tools via MCP.
Cursor
Create a config file .cursor/mcp.json in your project's root folder and add the MCP server:
{
   "mcpServers": {
      "regraph": {
          "command": "npx",
          "args": ["-y", "mcp-remote@latest", "https://mcp.cambridge-intelligence.com/regraph"]
      }
   }
}"npx": Runs the server using npx tool by Node.js"-y": Confirms the installation"mcp-remote@latest", "https://mcp.cambridge-intelligence.com/regraph": Downloads the package
This method downloads the MCP server as a package using mcp-remote because Cursor currently doesn't consistently support streamable http connections.
To verify the server is running, press Shift+Command+U (Mac) / Ctrl+Shift+U (Win) to open the Output panel. Select MCP Logs from the drop-down menu to view logs confirming that the server is connected.
For details and troubleshooting, see the Model Context Protocol (MCP) docs by Cursor.
JetBrains IDEs
To add an MCP server to JetBrains IDEs such as IntelliJ IDEA or WebStorm, use the latest version of the IDE and install the JetBrains AI Assistant plugin.
- Go to Settings | Tools | AI Assistant | Model Context Protocol (MCP).
- Click the + button to add a new MCP server.
- Select As JSON in the top left corner of the edit window.
- Add the new server in the edit window:
{
   "mcpServers": {
      "regraph": {
          "url": "https://mcp.cambridge-intelligence.com/regraph",
          "type": "http"
      }
   }
}
To verify the server is running, go to Help | Show Log in Explorer/Finder/Nautilus (depending on OS). The directory contains an mcp folder with a separate log file for each added MCP server.
For details and troubleshooting, see the Model Context Protocol (MCP) docs by JetBrains.
VS Code
Make sure you are on the latest version of VS Code and have access to GitHub Copilot.
- Press Shift+Command+P (Mac) / Ctrl+Shift+P (Win) to open the Command Palette.
- Locate the MCP: Add Server command in the search bar and select it.
- Select the HTTP (HTTP or Server-Sent Events) option.
- Paste in the server URL and press Enter to confirm:
https://mcp.cambridge-intelligence.com/regraph- Create a unique server ID and press Enter to confirm:
my-regraph-mcp-server- Select the scope of work for this MCP server. The options are:
- Workspace: Available in this workspace and runs locally, recommended by us
- Global: Available in all workspaces and runs globally
This creates an mcp.json file in the .vscode directory with the MCP server specified.
To verify the server is running, click the Extensions icon in the left navigation panel and find the MCP SERVERS - INSTALLED tab. Right-click on the server listed in this tab and select Show Output to view logs confirming that the server is connected.
For details and troubleshooting, see the Use MCP servers in VS Code docs by VS Code.
Example prompts
To help you get started, here are some example prompts to use for the MCP servers:
- Create a new ReGraph project using pnpm as a package manager and Vite as a bundler that shows a simple chart with two nodes connected by a link.
- Add a KronoGraph timeline into my ReGraph project and visualize my nodes on the timeline.
- How to add more nodes to an existing chart in ReGraph?
- What is the difference between organic and sequential layout?
- How can I style my annotations to make them look better?
Data we collect
We collect a short list of key words from your prompts and the answers provided by the MCP server, and we analyze this data so we can continue improving our MCP server for a better developer experience. The format may look like this:
"query": "export chart to PNG image"