Overview
Heatmaps provide a visual summary of the number of events involving each entity across time. They are made up of cells that aggregate individual events, summarizing event activity across time by entity. This can help you identify patterns and trends that may not be immediately apparent when looking at individual events.
KronoGraph automatically displays a heatmap when the number of visible events reaches a particular threshold. As you zoom in, individual events are shown again and the heatmap fades out.
By default, the heatmap cell colors are based on the colors of underlying events and the cell alpha values (transparency) represent the event count. Customize your heatmaps using Heatmap Values and Heatmap Colors.

Kronograph Example
Log in to view live examplesThe heatmap view shows when there are more than 100 events in the active range. You can change the default number of events with the heatmapThreshold option.
The heatmapDirection option allows you to control how the heatmap shows entity and event connections. Three options are provided: any (the default), from and to.
| For example, here we see a number of entities and events. | 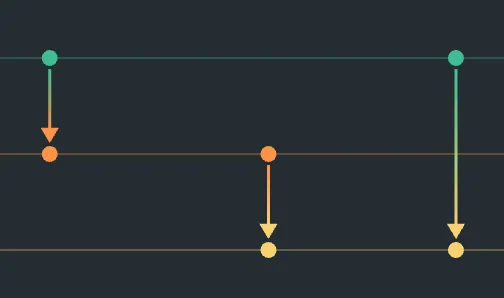 |
With any selected the heatmap will show a cell for all underlying event directions. | 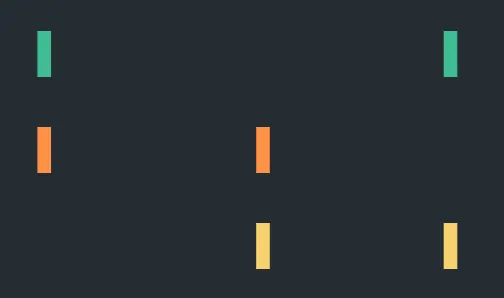 |
With from selected, the heatmap will show cells for entity rows that have events going from them. | 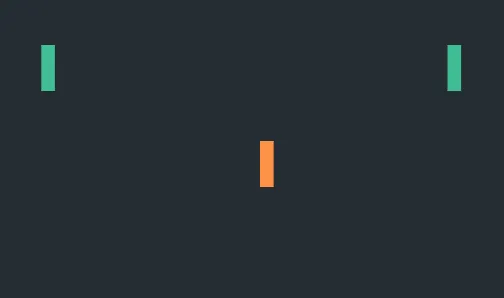 |
With to selected, the heatmap will show cells for entity rows that have events going to them. | 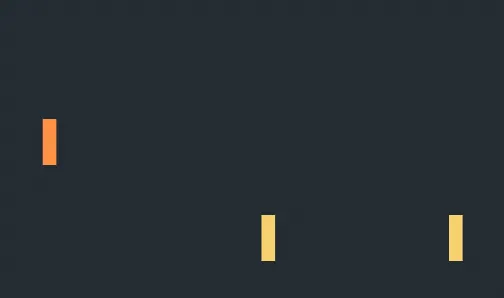 |
These options are illustrated further in the set of Heatmap examples.
Additional options to style the heatmap include heatmapPadding and showLines. Both can be seen in the Styling the Timeline example.
Heatmap Values
You can set a custom value to be used by the heatmap instead of the event count to determine the color of the cells.
Specify this property with the heatmapValue option:
timeline.options({
  events: {
    heatmapValue: "amount",
  },
});
options{{
events: {
heatmapValue: 'amount',
}
}}
The custom value is defined in the Event object:
const events = {
  event1: {
    entityIds: ["Person 1", "Person 2"],
    time: new Date(2025, 7, 14, 9, 27),
    data: {
      amount: 50,
    },
  },
};
const events = {
event1: {
entityIds: ["Person 1", "Person 2"],
time: new Date(2025, 7, 14, 9, 27),
data: {
amount: 50,
},
},
};Heatmap Colors
KronoGraph also provides heatmapColor options that allow you choose a color scheme for your heatmap.
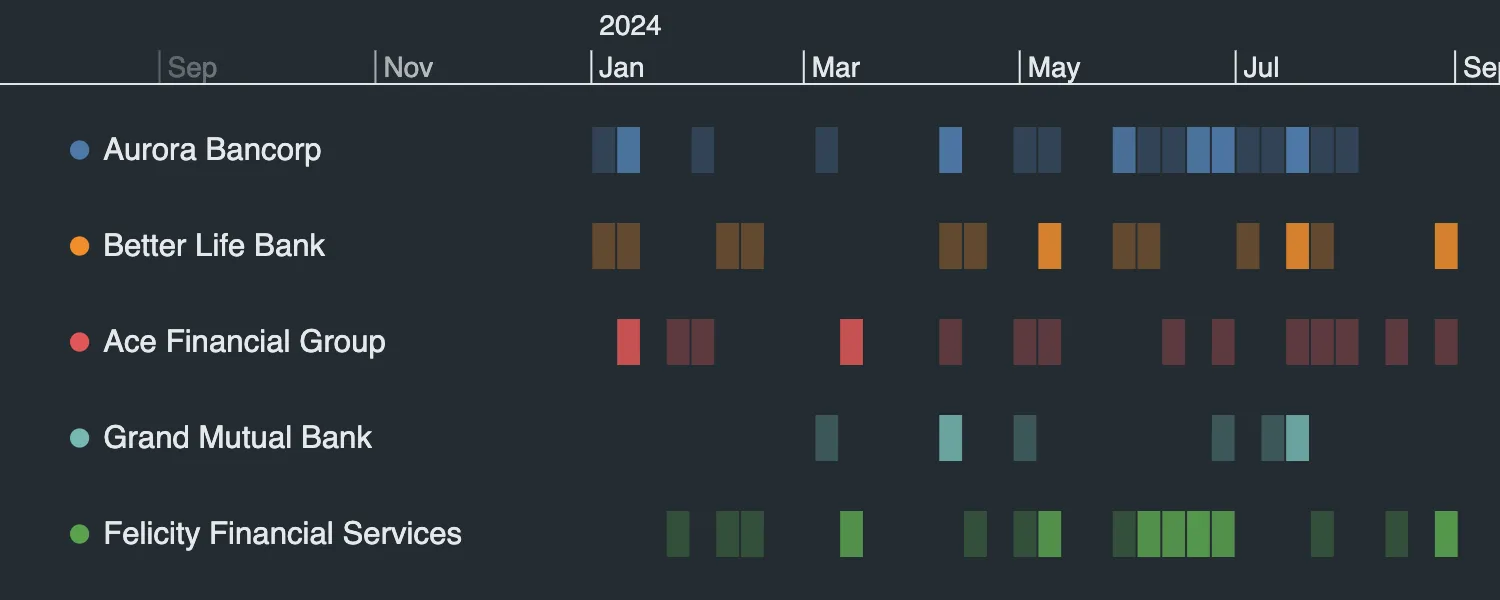
The default setting uses the event color for the heatmap cells (or the entity color if the events don't have a color assigned). The alpha value is based on the number of events or Heatmap Values.
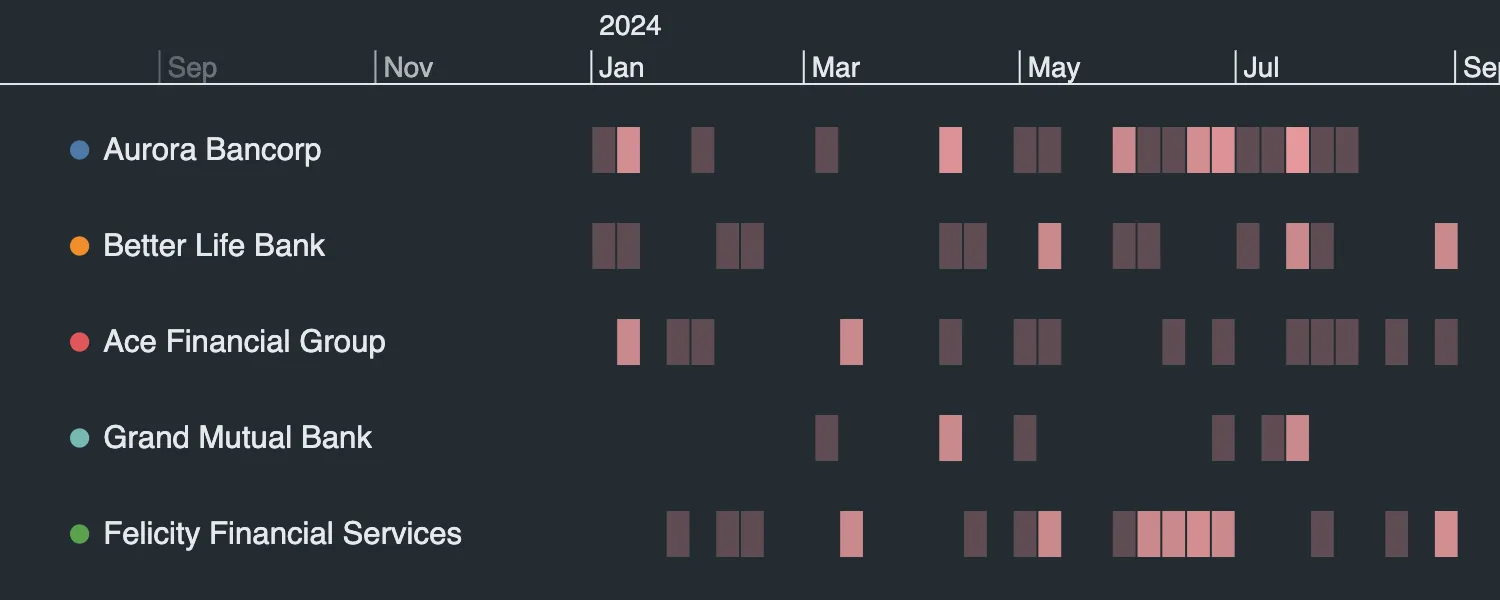
Specify a color to make all heatmap cells this color. The alpha value is based on the number of events or Heatmap Values.
timeline.options({
  events: { heatmapColor: "#e5989b" },
});<Timeline
options={{
events: { heatmapColor: "#e5989b" },
}}
/>;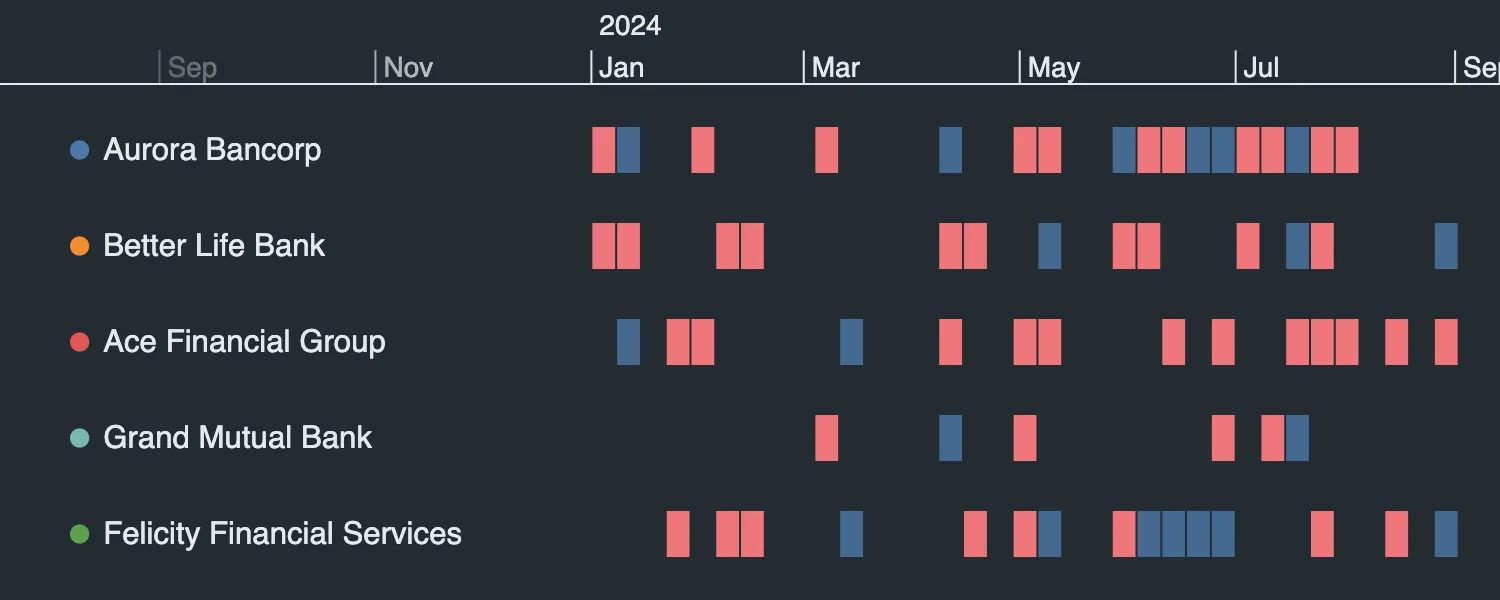
Specify an array of color values. The color of each cell is based on the number of events or the Heatmap Value. No alpha value is applied to the heatmap cells unless an rgba color is used.
timeline.options({
  events: {
    heatmapColor: ["#ef767a", "#eeb868", "#49dcb1", "#49beaa", "#456990"],
  },
});<Timeline
options={{
events: {
heatmapColor: ["#ef767a", "#eeb868", "#49dcb1", "#49beaa", "#456990"],
},
}}
/>;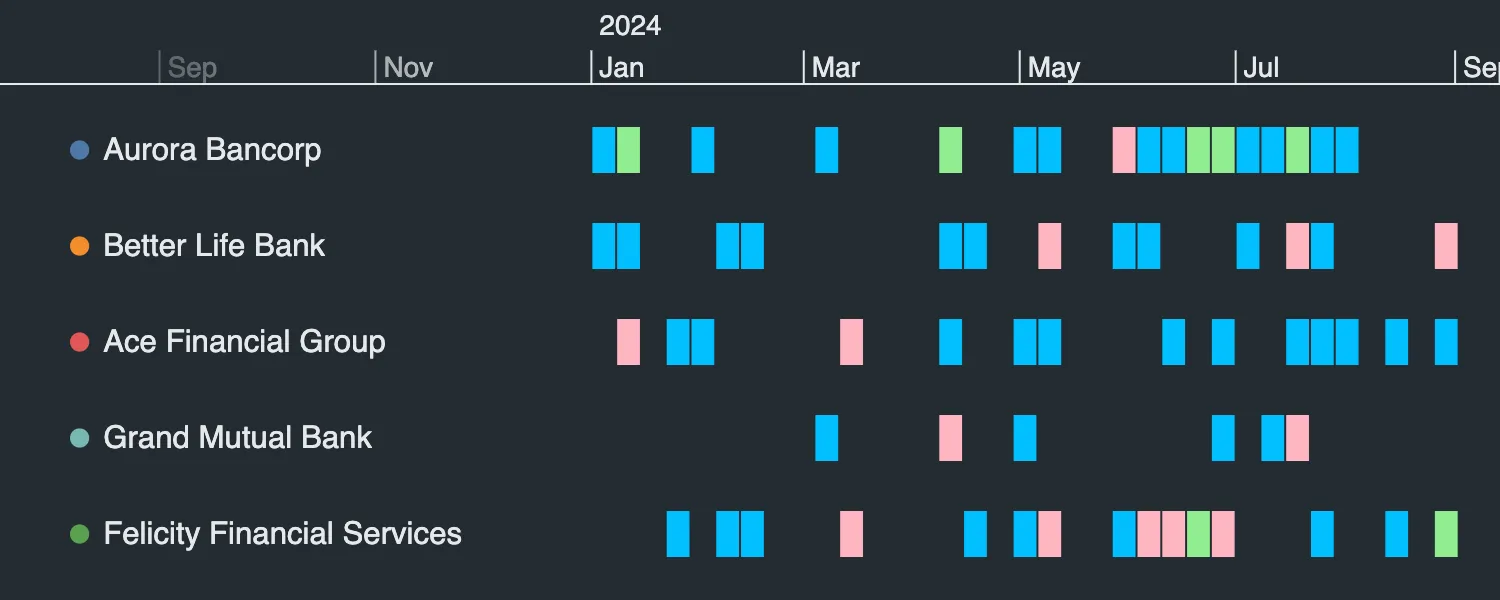
Specify a color and assign it to a range of values. The value is based on the number of events or Heatmap Values. No alpha value is applied to the heatmap cells unless an rgba color is used.
timeline.options({
  events: {
    heatmapColor: [
      { value: 0, color: "deepskyblue" },
      // values up to 1.5 are blue
      { value: 1.5, color: "lightpink" },
      // values between 1.5 and 3 are pink
      { value: 3, color: "lightgreen" },
      // values above 3 are green
    ],
  },
});<Timeline
options={{
events: {
heatmapColor: [
{ value: 0, color: "deepskyblue" },
// values up to 1.5 are blue
{ value: 1.5, color: "lightpink" },
// values between 1.5 and 3 are pink
{ value: 3, color: "lightgreen" },
// values above 3 are green
],
},
}}
/>;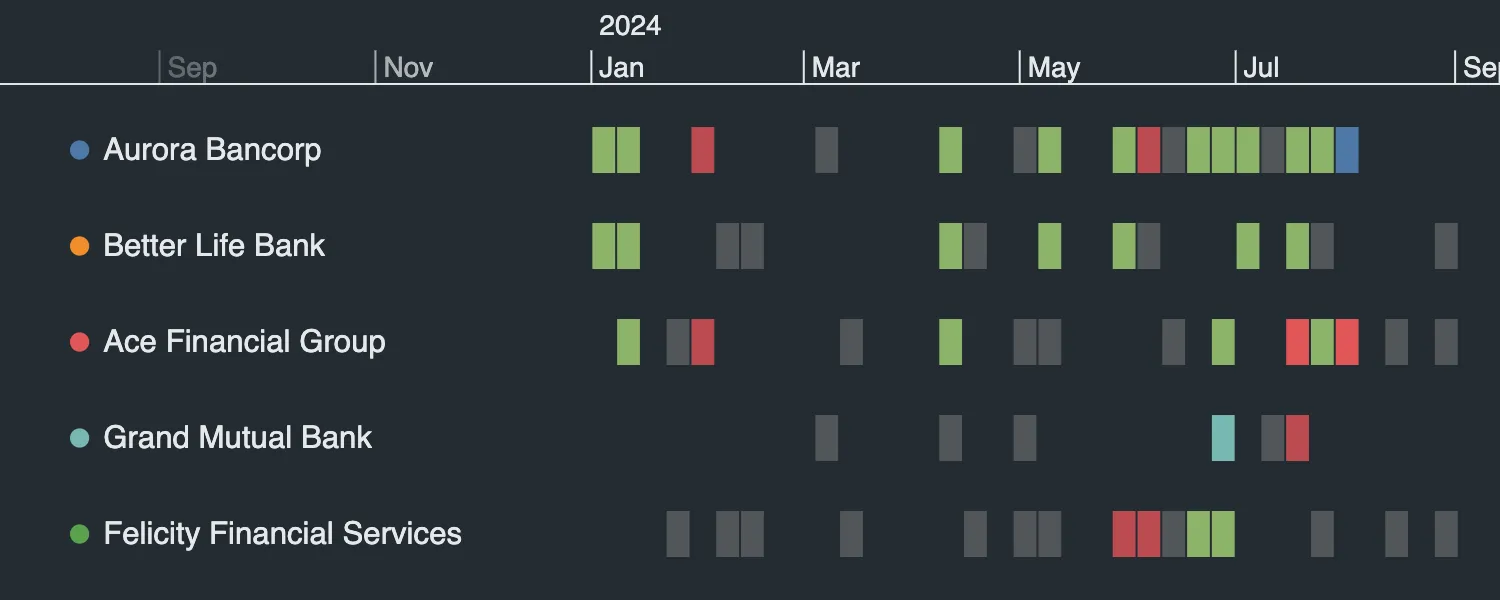
Specify a color for each event type. No alpha value is applied to the heatmap cells unless an rgba color is used.
If a heatmap cell contains events of more than one type, then its color is based on the type with the lowest index in the array.
Heatmap cells that contain events that don't have a type property assigned will use the 'default' event type color, if specified in the array.
If a heatmap cell only contains events that have a type property assigned that isn't specified in the array, it will use the average color of the events that make up that cell.
timeline.options({
  events: {
    heatmapColor: [
      { eventType: "safe", color: "rgb(140, 179, 105)" },
      { eventType: "unsafe", color: "rgb(188, 75, 81)" },
      { eventType: "default", color: "rgba(128, 128, 128, 0.5)" },
    ],
  },
});<Timeline
options={{
events: {
heatmapColor: [
{ eventType: "safe", color: "rgb(140, 179, 105)" },
{ eventType: "unsafe", color: "rgb(188, 75, 81)" },
{ eventType: "default", color: "rgba(128, 128, 128, 0.5)" },
],
},
}}
/>;See the Heatmap Colors example to explore this option further.
Reveal Events
You can use reveal() to keep individual events visible regardless of whether a heatmap is displayed, or to show events in the context of a heatmap.
You can use reveal() to keep events visible regardless of whether a heatmap is displayed, or to show events in the context of a heatmap.
Kronograph Example
Log in to view live examplestimeline.reveal(["event2", "event8"]);<Timeline reveal={["event2", "event8"]} />;In addition, you can use the revealHeatmapAlpha option to fade out entity rows that don't have any revealed events.
Kronograph Example
Log in to view live examplestimeline.options({
events: {
revealHeatmapAlpha: 0.3,
},
});<Timeline
options={{
events: {
revealHeatmapAlpha: 0.3,
},
}}
/>;Try it out in the Reveal example. Note that event folds are not available when using reveal.
Heatmap Cells
Information for heatmap cells is available via the subItem object. When the targetType is 'cell', the subItem object will be returned with the values for that cell.
timeline.on("click", (pointerEvent) => {
  if (pointerEvent.targetType === "cell") {
    const { value, x, y, width, height } = pointerEvent.subItem;
    alert(
      [
        `Heatmap cell at x = ${x}, y = ${y}`,
        `   Width: ${width}`,
        `   Height: ${height}`,
        `   Value: ${value}`,
      ].join("\n"),
    );
  }
});
const handleClick = (pointerEvent) => {
if (pointerEvent.targetType === "cell") {
const { value, x, y, width, height } = pointerEvent.subItem;
alert(
[
`Heatmap cell at x = ${x}, y = ${y}`,
` Width: ${width}`,
` Height: ${height}`,
` Value: ${value}`,
].join("\n"),
);
}
};
<Timeline entities={entities} events={events} onTimelineClick={handleClick} />;The subItem parameters index and time are unused by the heatmap and return undefined.
See the Heatmap Tooltips example for ideas about how to use the subItem object.