Positioning Nodes
Nodes in the chart can be positioned either using layouts, or using coordinates. The right positioning of items in the chart helps to detangle the data and visualize how items are connected.
Layouts transform connected data into networks that highlight connections, patterns and outliers which would be difficult to spot in the raw data. You can run a layout by passing an object with the layout name to the layout prop, which applies to any nodes with no specified coordinates. ReGraph uses the organic layout by default. See also the Layouts documentation for details.
Alternatively, you can pass an object with custom node coordinates to the positions prop, which will move nodes into the specified positions. See also the Custom Layouts documentation for details.
When using organic layout, the two ways can be combined - passing coordinates into positions prop fixes these nodes in the chart even when organic layout is run.
There are two types of x and y coordinates:
- World coordinates represent absolute positions within the chart, where 0, 0 is the center of the chart. They correspond exactly to the positions of a node. When integrating with Leaflet, world coordinates are represented as
lngandlat. - View coordinates represent pixel positions relative to the viewport, where 0, 0 is the top-left corner of the view. Positions of events such as
onClickare reported in view coordinates. View coordinates change whenever the user pans the view.
You can convert between the two options using the viewCoordinates and worldCoordinates instance methods.

ReGraph Example
Log in to view live examplesLayouts
Layouts are algorithms that display the nodes and links in optimal positions to create a readable, unobstructed, and insightful view of the data. This allows chart users to analyze the data at a glance and quickly reveal the key insights. ReGraph offers several customizable layouts.
Depending on the data, a chart can show a single connected component, or even multiple separate components (for example, two company departments that don't interact at all).
See also the Layouts example to compare the different layouts available.
ReGraph Example
Log in to view live examplesRunning layouts
To set a layout, or to re-run a layout on existing data, pass an object to the layout prop with the name of the layout and any required options.
Once the layout has run and positions have been calculated, ReGraph will publish the new positions to the onChange handler. This handler is also invoked when a user drags an item.
Force-directed layouts
Force-directed layouts position nodes by running a simulation of three forces - repulsion, springs, and network energy. These calculations repel unconnected nodes apart, attract connected nodes together, and move all nodes to optimal positions.
Organic
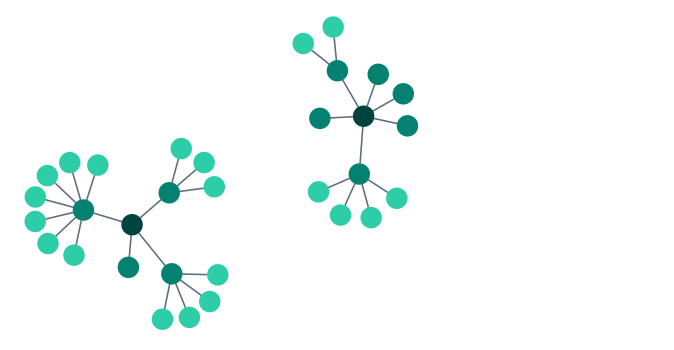
The organic layout is the default layout in ReGraph. Organic untangles complex networks by placing connected nodes closer together and reducing link crossings.
It is a clear and reliable all-rounder for any type or size of data, and it delivers great performance even for very large datasets.
Structural
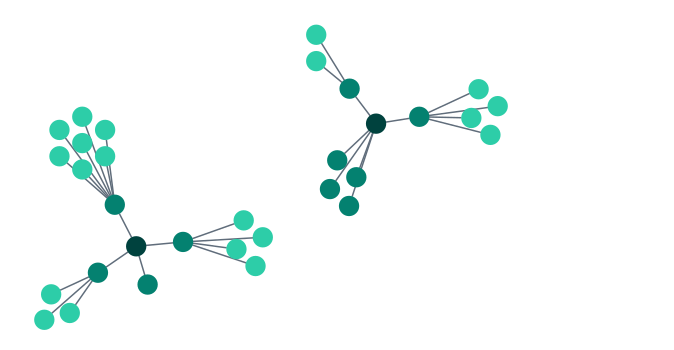
The structural layout groups together nodes with the same neighbouring nodes. This makes it easier to see the general organization of a network.
Structural gives you an overview of the clusters within a network, and allows you to see groupings and patterns without the need to focus on any one element.
Lens
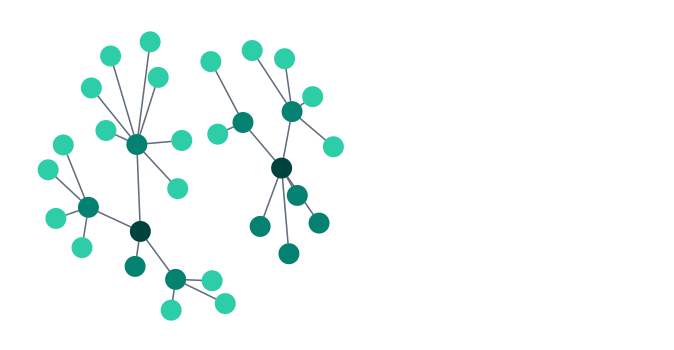
The lens layout arranges nodes in a circular pattern that pushes highly-connected nodes into the centre and forces less connected nodes out into the periphery.
The circular outline makes good use of the available space and generally creates denser networks. This results in an attractive 'lens' view which highlights the key nodes in large networks.
Lens is the default layout for arranging items inside open combos. See also Arrangements in Combos.
Level layouts
Level layouts visualize data that is organized in tiers and hierarchies, or that flows from one level to another. They can use different mechanisms to assign levels to nodes:
- Assigning levels automatically to minimize link crossings and maximize the use of available space. If links have arrows, their direction is used to infer the levels.
- Assigning levels according to the content of the
leveloption. - Assigning top (sequential) / root (radial) node(s) to those specified in the
topoption. This only lays out the component(s) for whichtopis specified.
Sequential
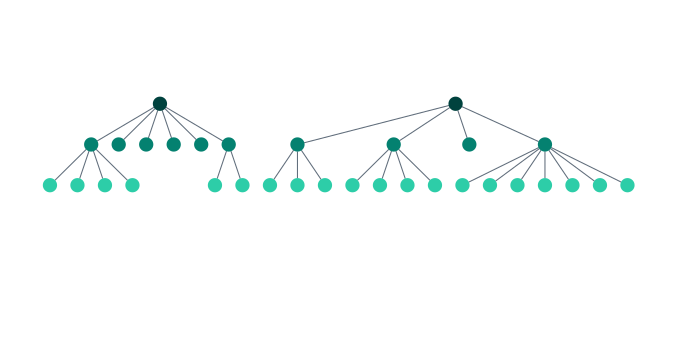
The sequential layout is designed to display data that contains a clear sequence of links between distinct levels of nodes, or data where information flows from one level to another.
It examines link directions across the network and automatically works out where to place nodes in the hierarchy of levels in order to minimize link crossings and use all of the available screen space.
Sequential is works great with an angled link shape. You can control the layout's orientation and refine the ordering in each level using orderBy.
When space is at a premium, you can use stretch and stretchType, or stack nodes with identical connections into grids using stacking as shown in our Navigating Large Hierarchies example.
Radial
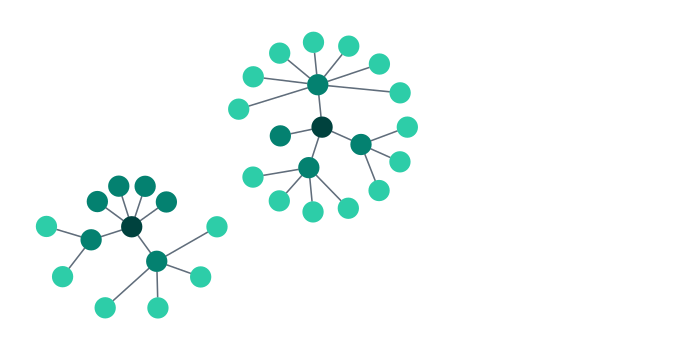
The radial layout arranges nodes in concentric circles around the original subject in a radial tree. Each 'generation' of node becomes a new ring surrounding the previous generations.
Radial is a good choice for networks where the number of child nodes significantly exceeds the number of parent nodes, as it uses the available space more efficiently for these datasets.
Packing of components
Packing is a step run during the layout that determines how unconnected chart components are placed relative to each other. It takes the unconnected components and packs them together on the chart to minimize any large gaps.
Packing is available for all layouts except the lens layout. Different layouts have different default packing, but you can also control it manually using the packing option.
Circle
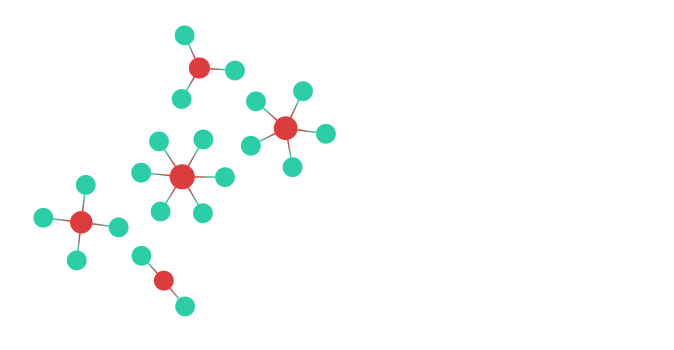
Default for organic, structural and radial layouts. Lays out the components in a circular pattern. Great for space efficiency. Also suitable for sequential layout when hierarchy levels between unconnected components are irrrelevant as it makes better use of screen space.
Rectangle
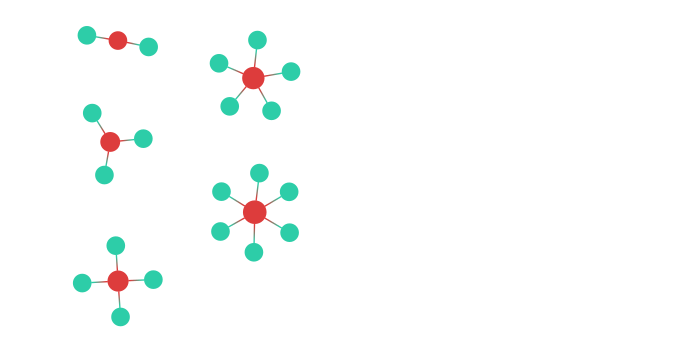
Lays out the components in a grid-like rectangular pattern. Great for space efficiency and use with other rectangle-biased features such as rectangular combos. Also suitable for sequential layout when hierarchy levels between unconnected components are irrrelevant as it makes better use of screen space.
Aligned
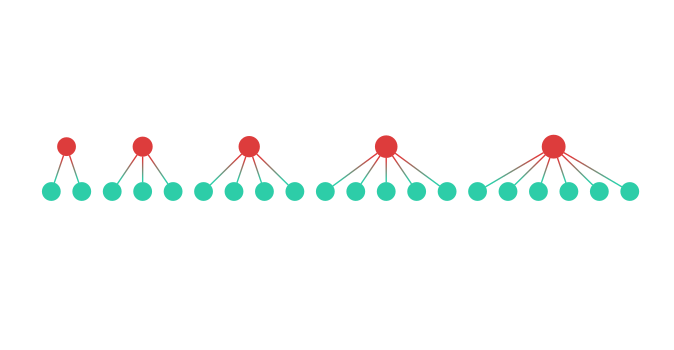
Default for sequential layout. Lays out the components in a single line with same level items aligned to preserve the information about hierarchy of levels.
Arrangements - layouts inside combos
Items inside open combos are laid out using arrangements. Some arrangements are based on existing layouts (e.g. 'lens' or 'sequential'), others are for combos only (e.g. 'concentric' or 'grid').
See Arrangements in Combos for more details.
Performance
Our default organic layout offers the best overall performance for any size of dataset. It is especially suitable for very large charts and would be our first recommendation for most datasets.
If you need to visualize very large hierarchical data, we recommend using the sequential layout with the top or level options specified. This makes layout calculations faster than if the levels are assigned automatically.
Custom layouts
You can manually control the chart by setting the positions prop. This will prevent ReGraph's built-in layouts from running. Instead, ReGraph will animate items into position for you. You can use this to:
- Pass positions from an
onChangeevent into thepositionsprop to prevent movement during changes as seen in the Filtering Data example. - Define your own layouts:
ReGraph Example
Log in to view live examplesEvents
ReGraph comes with a number of default behaviors built in to respond to common user gestures. For example, clicking on a node or a link selects that item (updating selection state and drawing a halo around the selected item).
By passing functions through to the event props, you can both hook in to chart events (to know which item was clicked) and override default behavior (to stop the selection changing).
Event handlers will be called by ReGraph and passed a single object containing all the details of the event. Calling the preventDefault() function in these handlers will override any default behavior.
For example, to respond to the onClick event:
const handleClick = ({ id, x, y, button, subItem }) => {
  // id: the node, link or navigation control that was clicked
  // x, y: the position of the item relative to the view
  // button: the logical mouse button that was clicked
  // subItem: the sub-item that was interacted with
};
<Chart items={items} onClick={handleClick} />;
To prevent an item from being selected on onClick:
const preventSelection = ({ preventDefault }) => {
  preventDefault();
};
<Chart items={items} onClick={preventSelection} />;
p#events-subitems.
Some items on the chart can include sub-items. When you click on a sub-item, like a label,
details about it will be passed to the event handler.
const handleClick = ({ id, x, y, button, subItem }) => {
  if (subItem && subItem.type === "label") {
    // Label was clicked
  }
};
<Chart items={items} onClick={handleClick} />;
Handle errors directly in the event listener:
const handleChange = (change) => {
  try {
    functionWhichMightThrow(change);
  } catch (e) {
    // handle the error
    console.error(e);
  }
};
The only exception to this are errors produced by onCombineNodes and onCombineLinks events. Their errors are logged to the console.
The firing order of chart pointer events is onPointerDown, onPointerMove, onPointerUp, onClick (updates selection), onChange (contains new selection).
See the API Reference for a complete list of events on the chart and time bar component. A detailed description of the sub-item type is available in the sub-item section of the API reference.
See also the interactive Interaction / Events and Time Bar / Events examples.
Re-rendering in ReGraph
State management in ReGraph relies on immutability, a concept where a prop cannot be changed (mutated) directly once it's created, but it can be updated by replacing it with a new prop. On every render, ReGraph uses referential equality to decide whether any props have changed.
Whenever a new object is passed as a prop, ReGraph assumes something has changed and performs a re-render. If the same object is passed, ReGraph assumes nothing has changed. This is why ReGraph can quickly and efficiently respond to re-renders even in very large datasets.
To prevent unnecessary re-renders, applications must be disciplined in how props are updated. For example, passing a new object with identical property values into the layout prop will trigger a re-render that may change the positions of nodes.
If you want to change a sub-property on a prop that's an object (e.g. the items prop or others), you need to create a whole new object to make sure that ReGraph performs a re-render.
Consider the following object in the items prop:
  items: {
    n1: {
      label: {
        color: "blue", // <-- User changes a node's label color
        text: "node 1",
      },
    },
    n2: {
      label: {
        text: "node 2",
      },
    },
  },
Let's say we change the n1's label.color property. If we simply mutate the n1 object and pass it into the items prop, the change won't be recognized and our chart will stay the same.
To correctly render the change, we have to create new objects for items and n1, and set a new value for color. You can see the properties that need to be re-created marked with a star below:
items*: {
  n1*: {
    label*: {
      color*: 'red',
      text: 'node1'
    }
  },
  n2: {
    label: {
      text: 'node 2'
    }
  }
}
Deep cloning creates a copy of all the object values, and all the values of all the nested objects within it. In comparison, shallow cloning would create copies of primitive values, but objects wouldn't be copied, only referenced, which would not be recognized during a re-render in ReGraph.
Let's use the example above to illustrate the difference between the two cloning techniques. You may choose to use object destructuring to create a new object that you can modify and pass back to ReGraph:
const shallowClone = { ...items };
shallowClone.a.color = "red";
setItems(shallowClone); // doesn't work
This doesn't work as shallowClone.a equals items.a. The shallowClone.a is just a reference to items.a and ReGraph decides not to do a re-render as, apparently, nothing has changed.
This is what you would need to do instead:
const deepClone = window.structuredClone(items);
deepClone.a.color = "red";
setItems(deepClone); // works
This does work as deepClone.a does not equal items.a and ReGraph will re-render. See this playground that shows both techniques.
Using object destructuring is possible, but you need to make sure that you don't accidentally pass any references to old objects. Here is an example of how to successfully do this:
// Clone the items object before making any changes
const newItems = Object.assign({}, this.state.items);

// Deep clone and update the item you want to change.
// If you're using spread operator, access nested properties
// to deep clone nested changes as well
const newItem = Object.assign({}, newItems.n1, {
  label: {
    ...newItems.n1.label,
    color: "red",
  },
});

// Write the change back to the newItems object
newItems.n1 = newItem;

// Update app state and trigger a re-render
this.setState({ items: newItems });
Using deep cloning and immutability in your application code provides better performance, results in fewer unexpected side-effects, and lets you rewind or undo user actions. We use these patterns throughout our examples.
Chart Animation
When you pass a new state to the chart, ReGraph will calculate any differences between the new and existing states and animate the changes. The result is new nodes moving smoothly in and out of the chart from sensible origins, and layouts and property changes animating to let the end user follow the changes on-screen.
On any given update, ReGraph decides what animations are required and builds a queue of changes. It will then animate those changes in series until the Chart is in the right place. If state changes occur during animation, ReGraph will simply add more changes to the animation queue.
Animation should be switched off during drag events to ensure the drag is able to complete before any associated animations are run; see the Combos Drag and Drop example.
Update Order
State changes are often complex and so to effectively manage them ReGraph animates in a particular order:
- Set component options
- Hide maps
- Uncombine combos
- Remove, add and update nodes
- Arrange combos
- Run layout
- Display a map (Leaflet Integration)
- Update selection
To control the order of animations, it may be necessary to queue multiple state changes.
Duration
You can control the speed of animation via the animation prop. Passing a time value tells ReGraph how long it should take to animate each state update (in milliseconds). This time will be shared by whatever animations are required. So if ReGraph has 1000ms to animate new items being loaded into the chart, a layout which repositions nodes, and a change to node size, then each animation will run in about a third of a second.
The example below uses setInterval to add a new item to the chart every two seconds, triggering an animated layout.
ReGraph Example
Log in to view live examplesView Control
When the Chart changes, ReGraph will automatically update the viewport to make it clear what is happening. This can mean zooming out to include hidden items before they change, or zooming in to remove 'whitespace' when removing or combining items.
You can customize this behavior using the fit Chart option.
<Chart items={items} options={{ fit: "all" }} />;fit defaults to a value of 'auto'. This lets ReGraph decide how to adjust the view while minimizing disruption to the user's context. Alternatively, it can be set to fit all items, a specific set of items, or to not change at all. When setting the fit to a value other than 'auto', the view will only change at the end of an update.
You can set the view to a fixed position by setting the view prop, which disables all fit behaviors.
Use instance methods to pan(), zoom() or fit() the Chart explicitly, as shown in the Toolbar example.
Chart Filtering
In ReGraph, filtering items out of the chart is done by removing them from the state as shown in the Filtering Data example.
You can base filtering on insights gained from using graph functions, for example to remove items outside of a specified range or selection, or to remove individuals that are least connected. See an example of this in the Impact Analysis example.
Alternatively, you can filter out items only visually by highlighting the key items and fading the rest into the background. See Fading and foregrounding for more details.
Instance Methods
We expose additional methods on chart objects, which are available when you have a reference to an instance of a chart. Refs provide a way to access React elements created in the render method. For example, when you have a ref to a chart, you can call the ping method which will ping the clicked items in the chart. For all instance methods, see the API Reference.
Creating a ref in a functional component
If you are using React 16.8 or above then you have access to the hooks API and can use the useRef() hook in your functional components.
const MyFunctionalComponent = (props) => {
  const { items } = props;
  const chartRef = React.useRef(null);

  const ping = ({ id }) => {
    if (id) {
      chartRef.current.ping({ [id]: true });
    }
  };

  return (
    <Chart ref={chartRef} items={items} positions={positions} onClick={ping} />
  );
};
Leaflet Integration
You can use ReGraph with Leaflet.js to visualize and analyze geospatial data on a map.
While Leaflet provides a map to use as a background, ReGraph lays out the chart onto the map according to the latitude and longitude locations of nodes.
To integrate ReGraph with Leaflet, you must add Leaflet version 1.9.x to your project and import it into your app.
To display the map, set the map prop:
ReGraph Example
Log in to view live examplesReGraph uses OpenStreetMap as a default map tile provider.
When the map is displayed, there are some important behavioral differences in the chart:
- Nodes are positioned by
latandlngincoordinates. Thepositionsprop is ignored. - Nodes without both
latandlngspecified are hidden. - The
worldCoordinatesmethod returns an object withlatandlngproperties. - Annotations are hidden as they are not supported.
- Links are always shown as direct links. See Link Shapes for details.
- Open combos are not supported.