KronoGraph Examples
Timeline
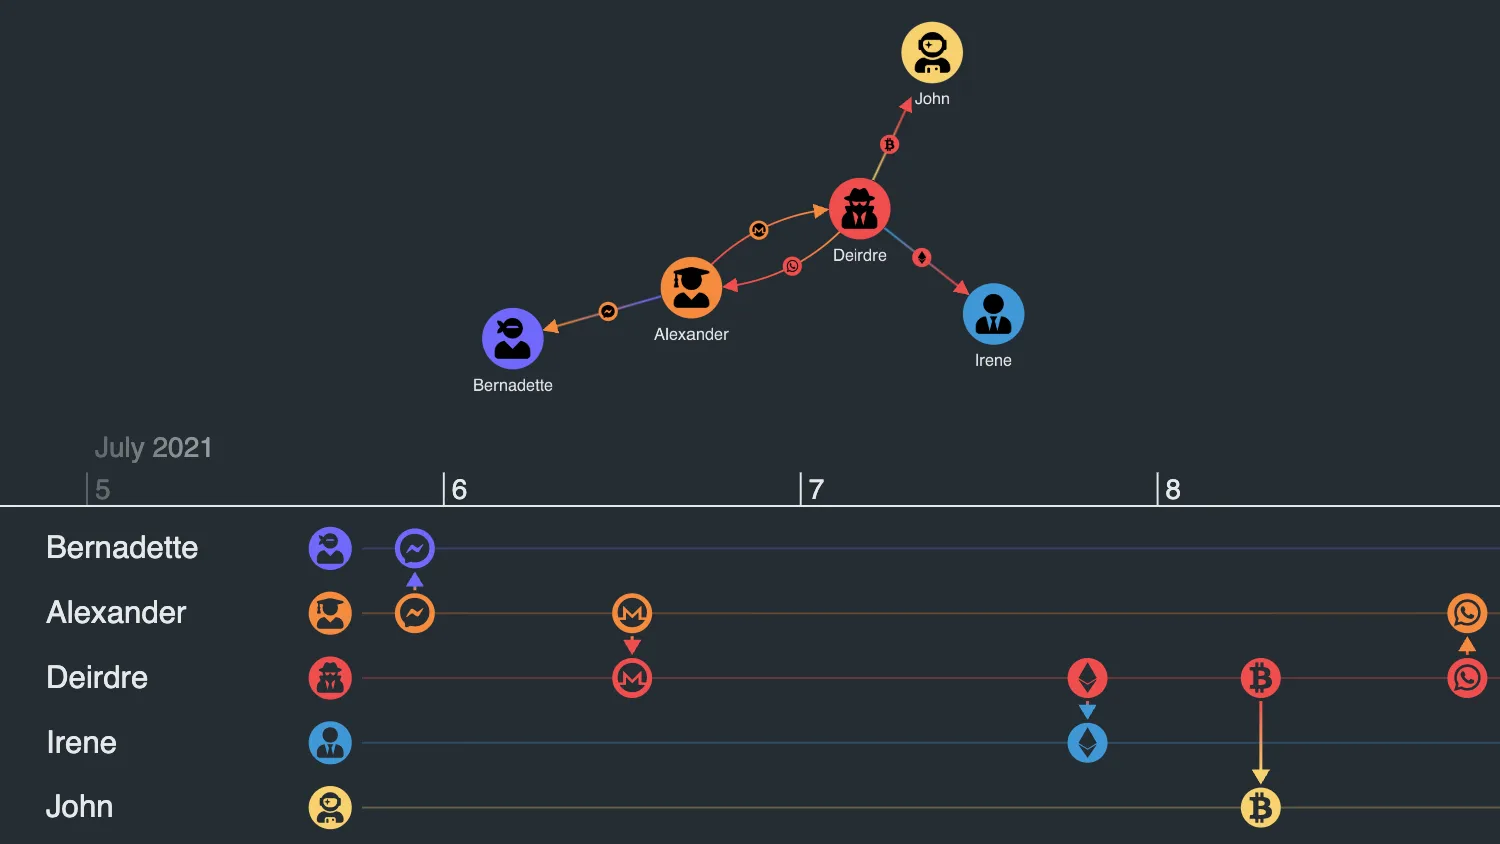
Styling the Timeline
Customize label area width and global timeline options.
See example
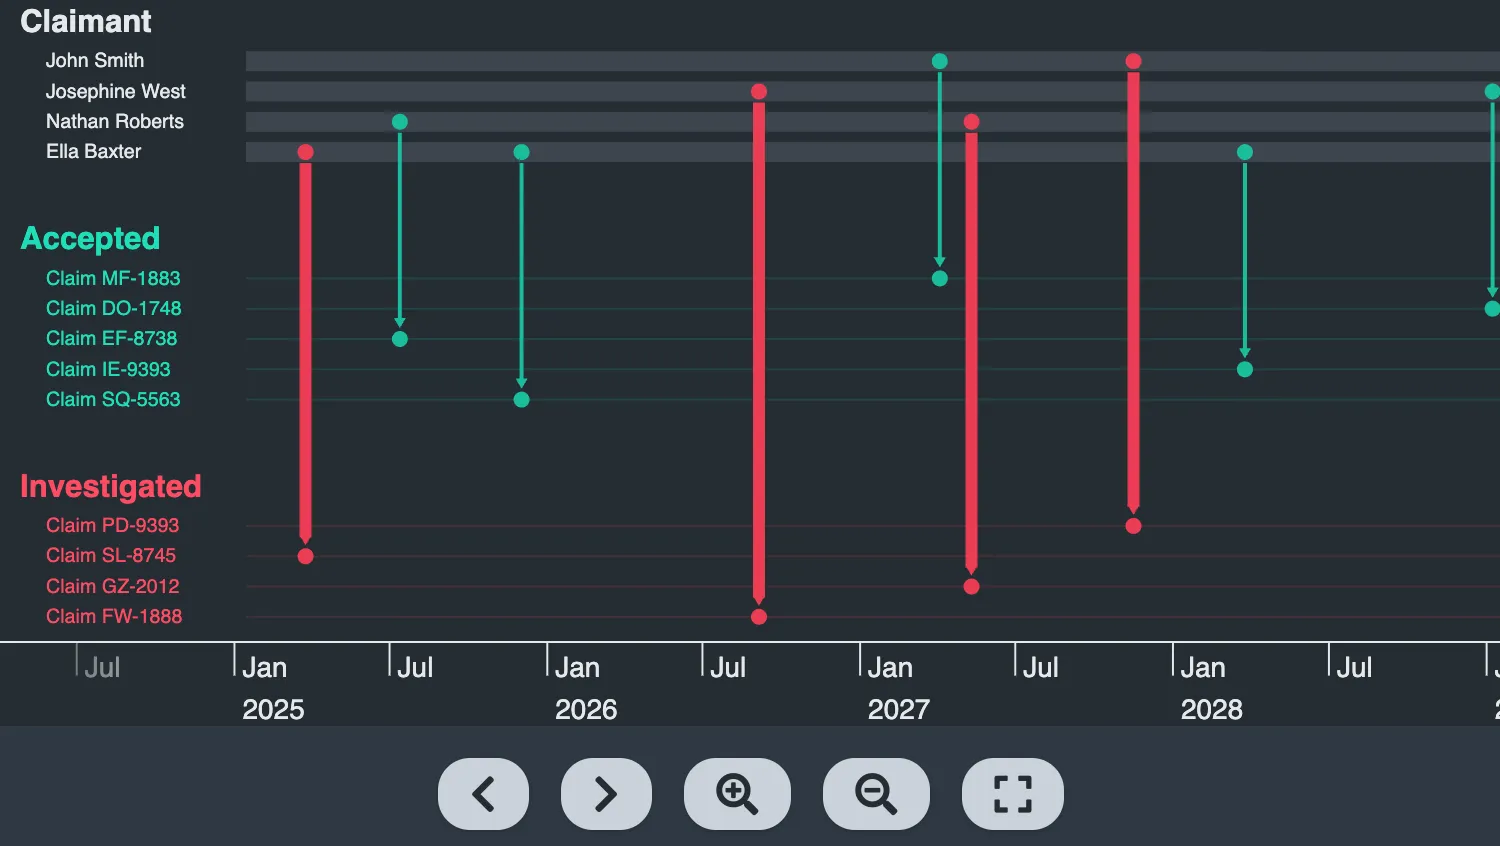
Navigation
Control the visible time range with fit, pan, and zoom.
See example
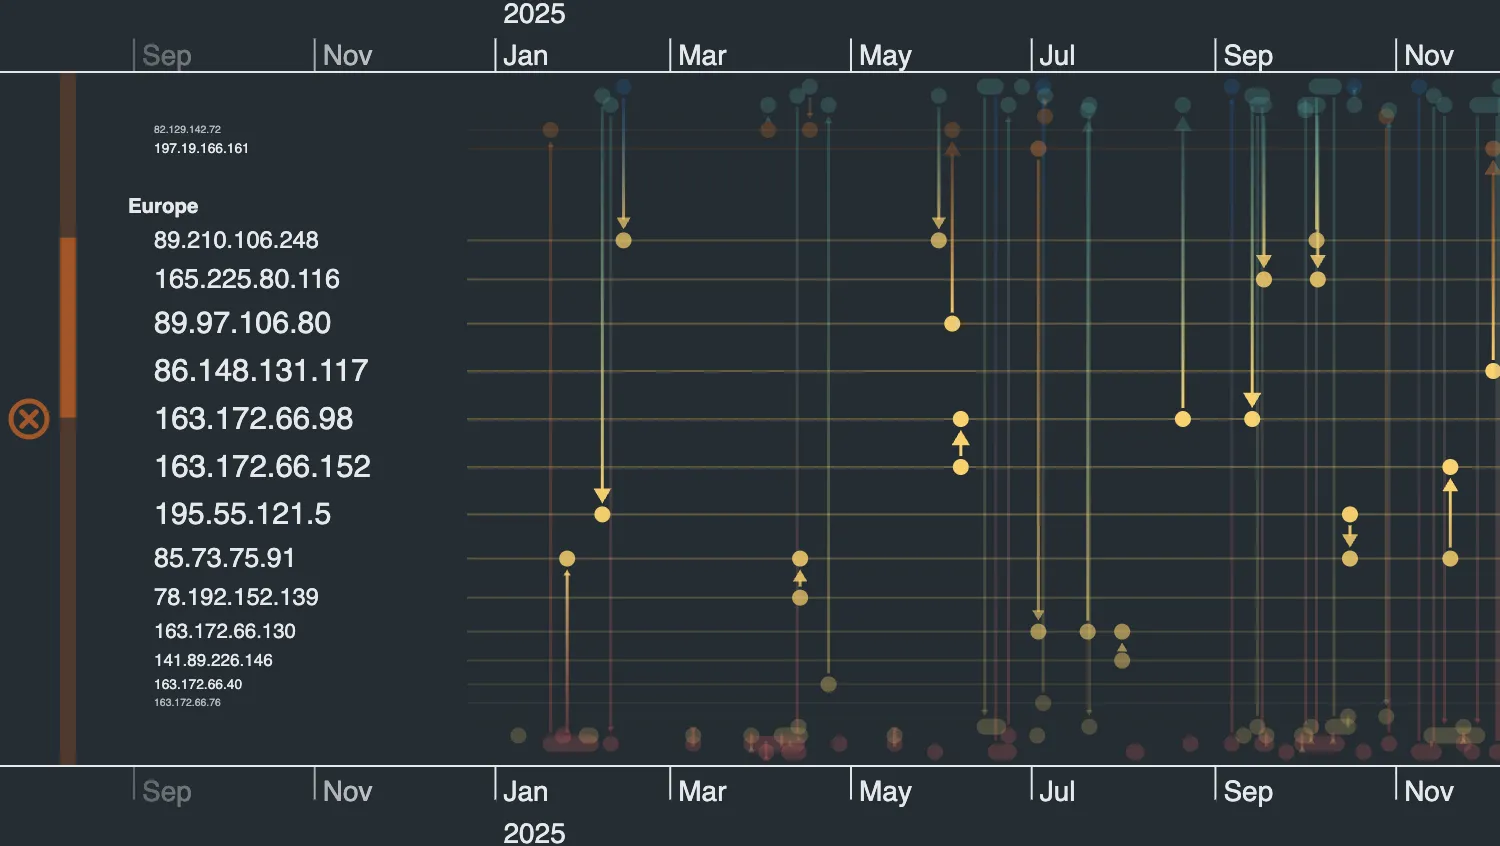
Lens
Reveal entity names using the built-in lens control.
See example
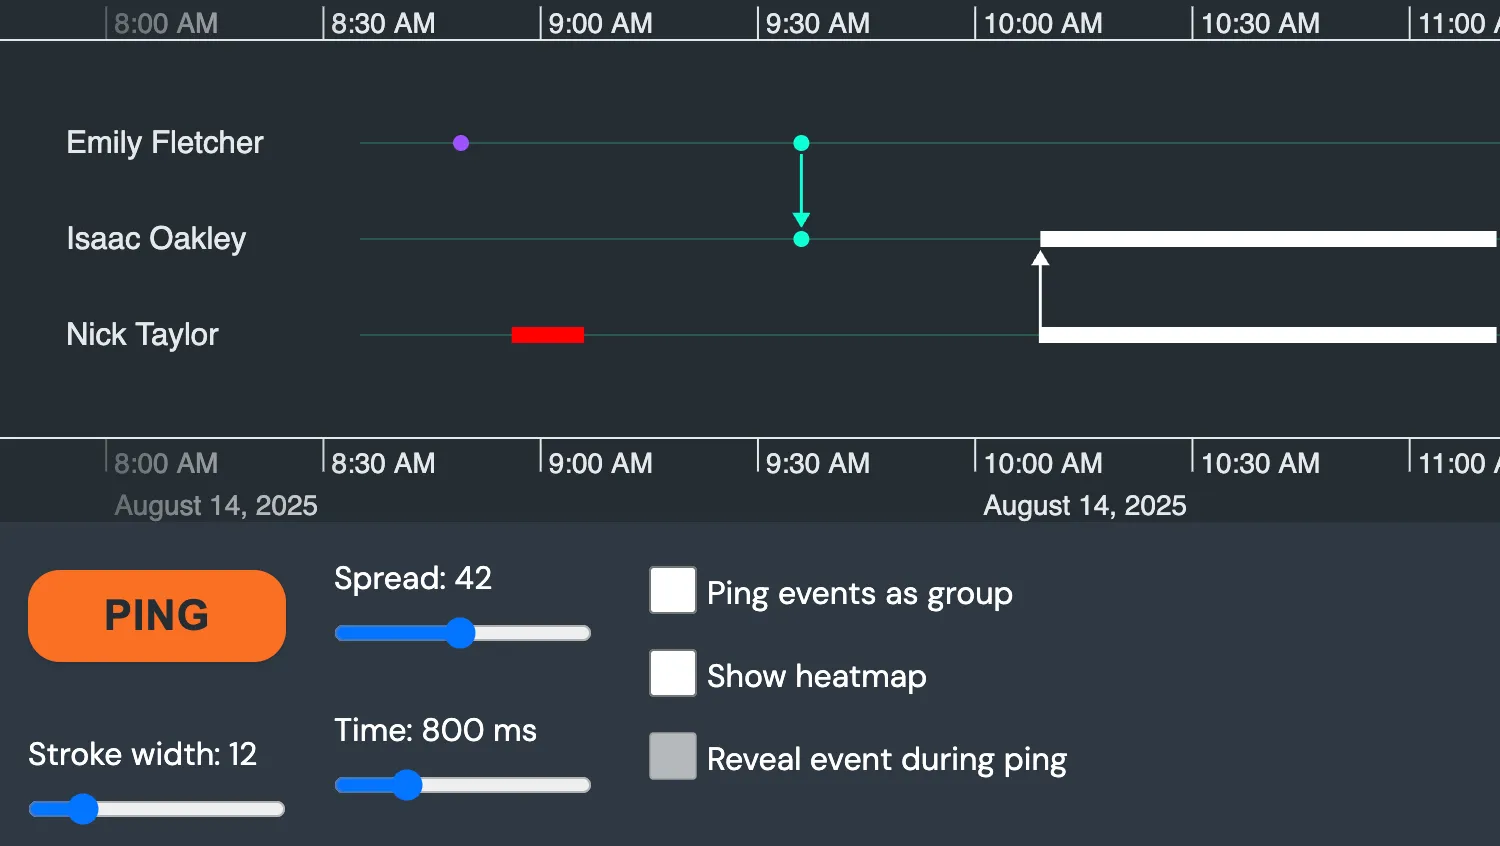
Ping Animations
Draw attention to events with ping animations.
See example
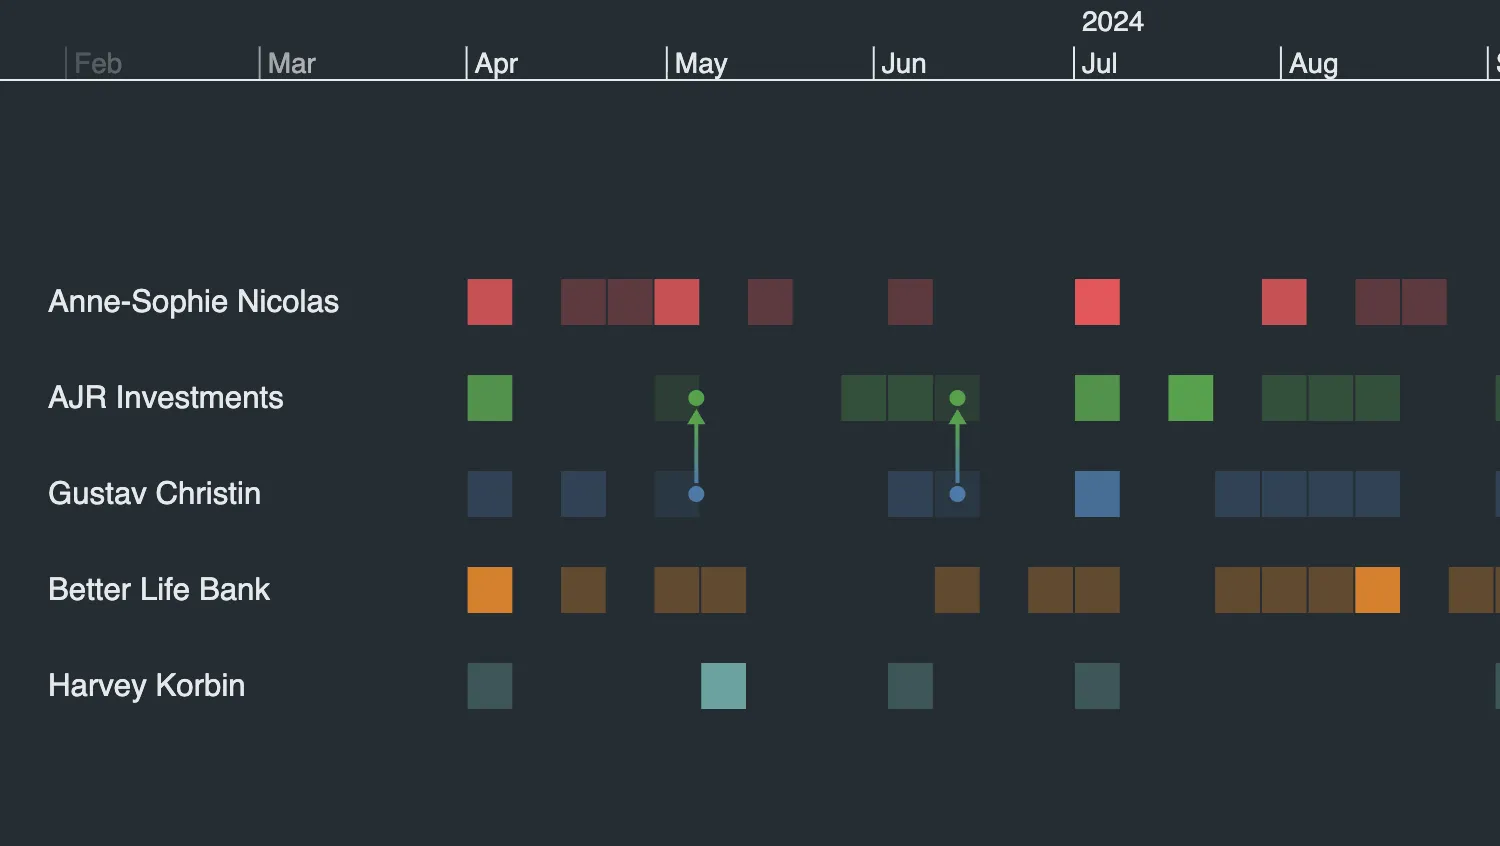
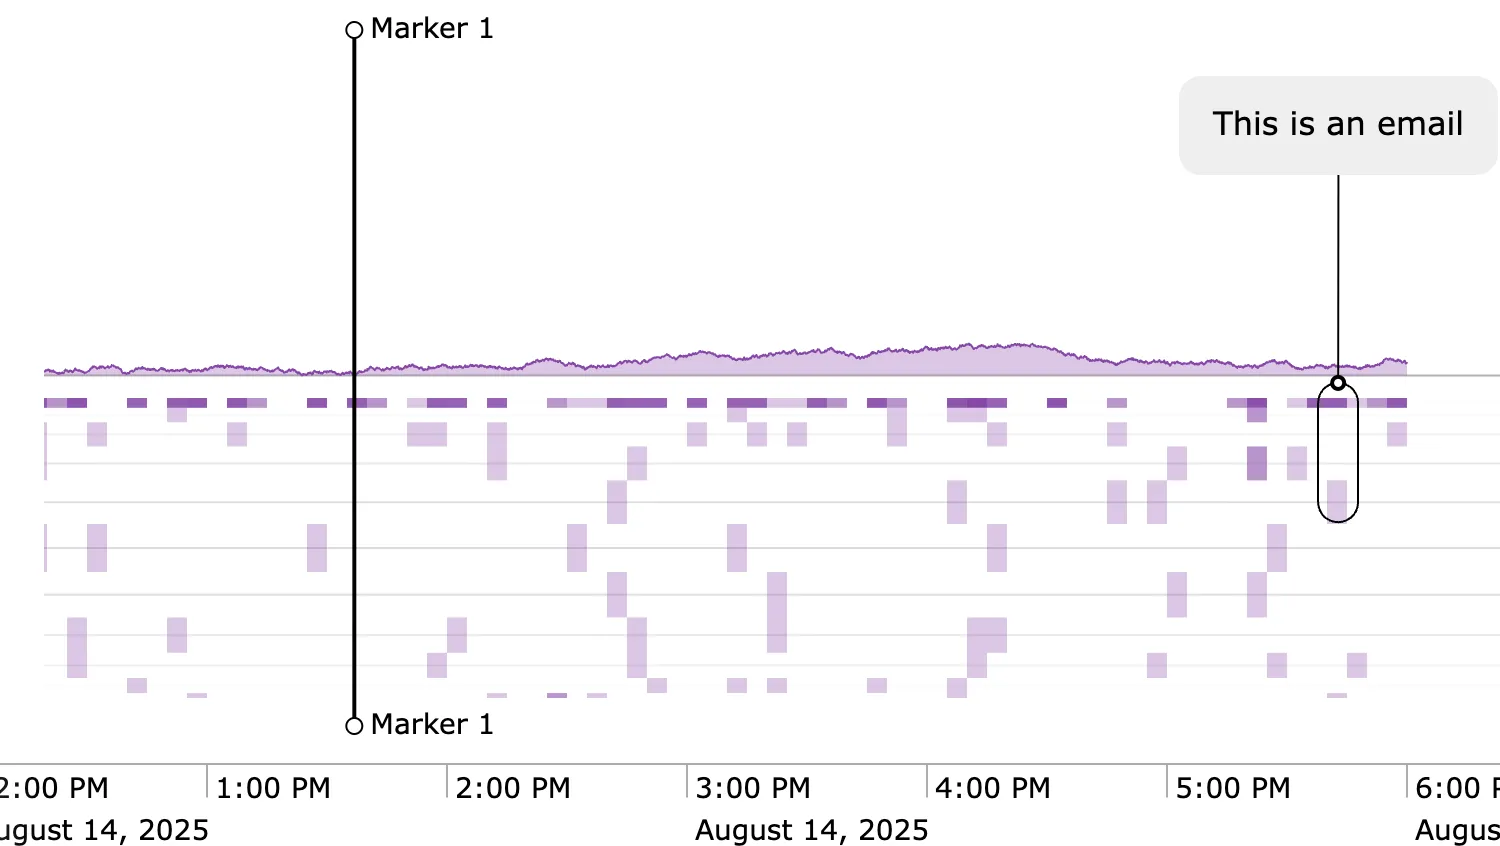
Reveal
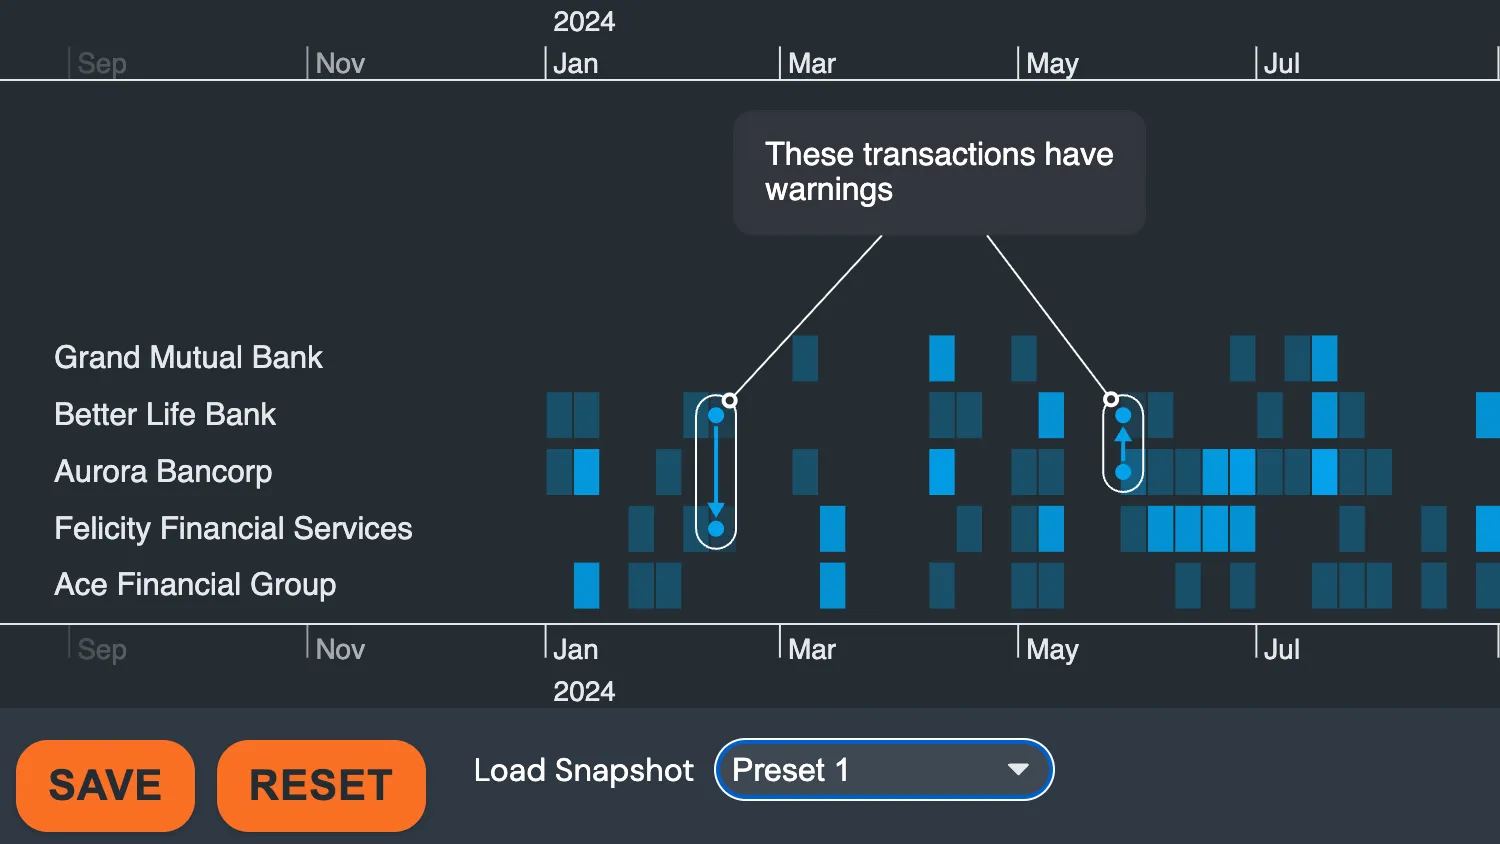
Click a heatmap cell to reveal and inspect its events.
See example
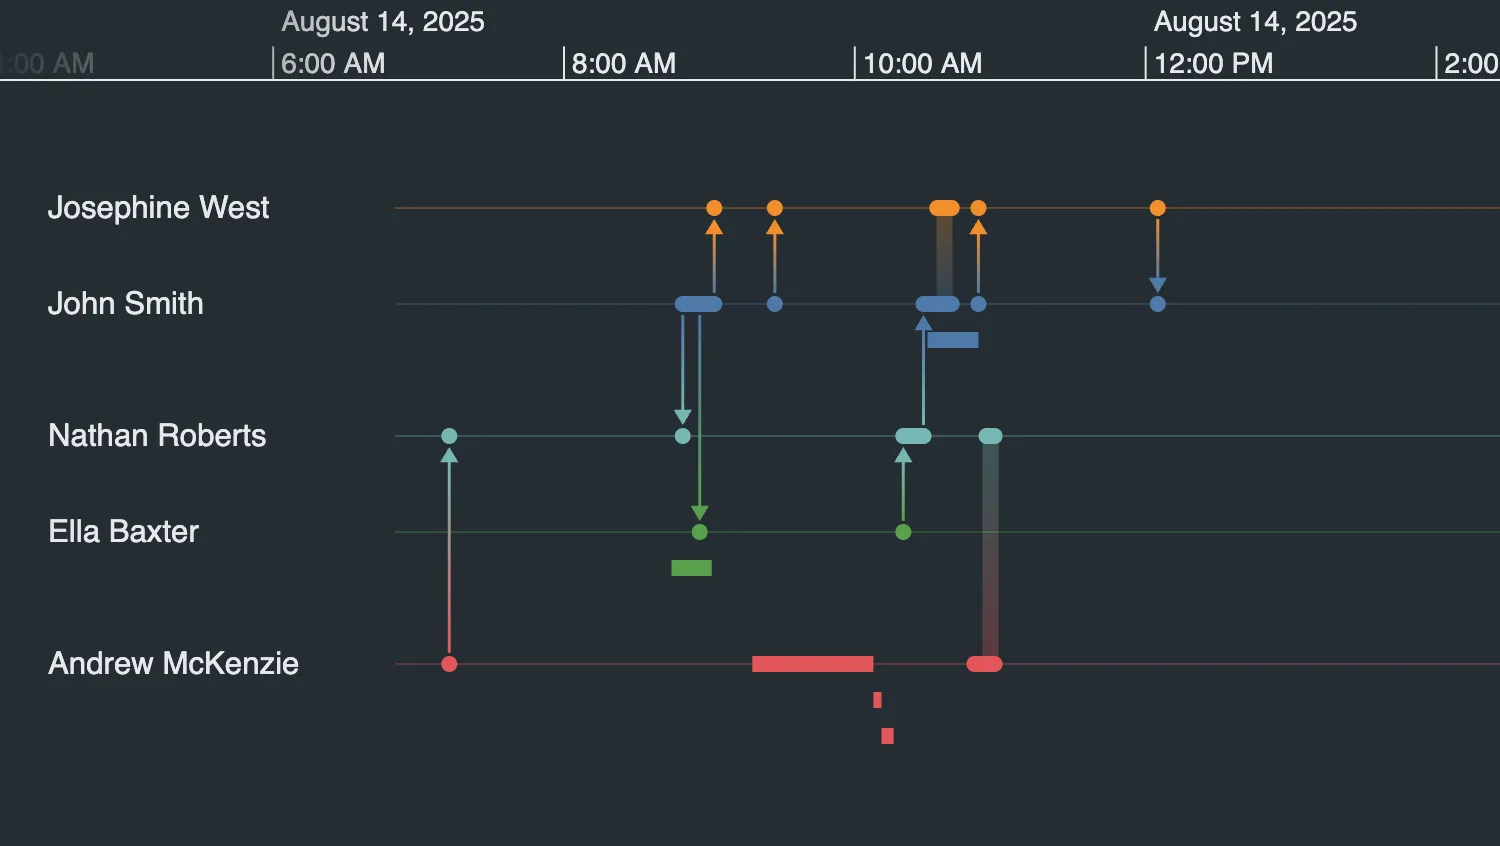
Expanded Rows
Expand entity rows into sub-rows for busy sequences.
See example
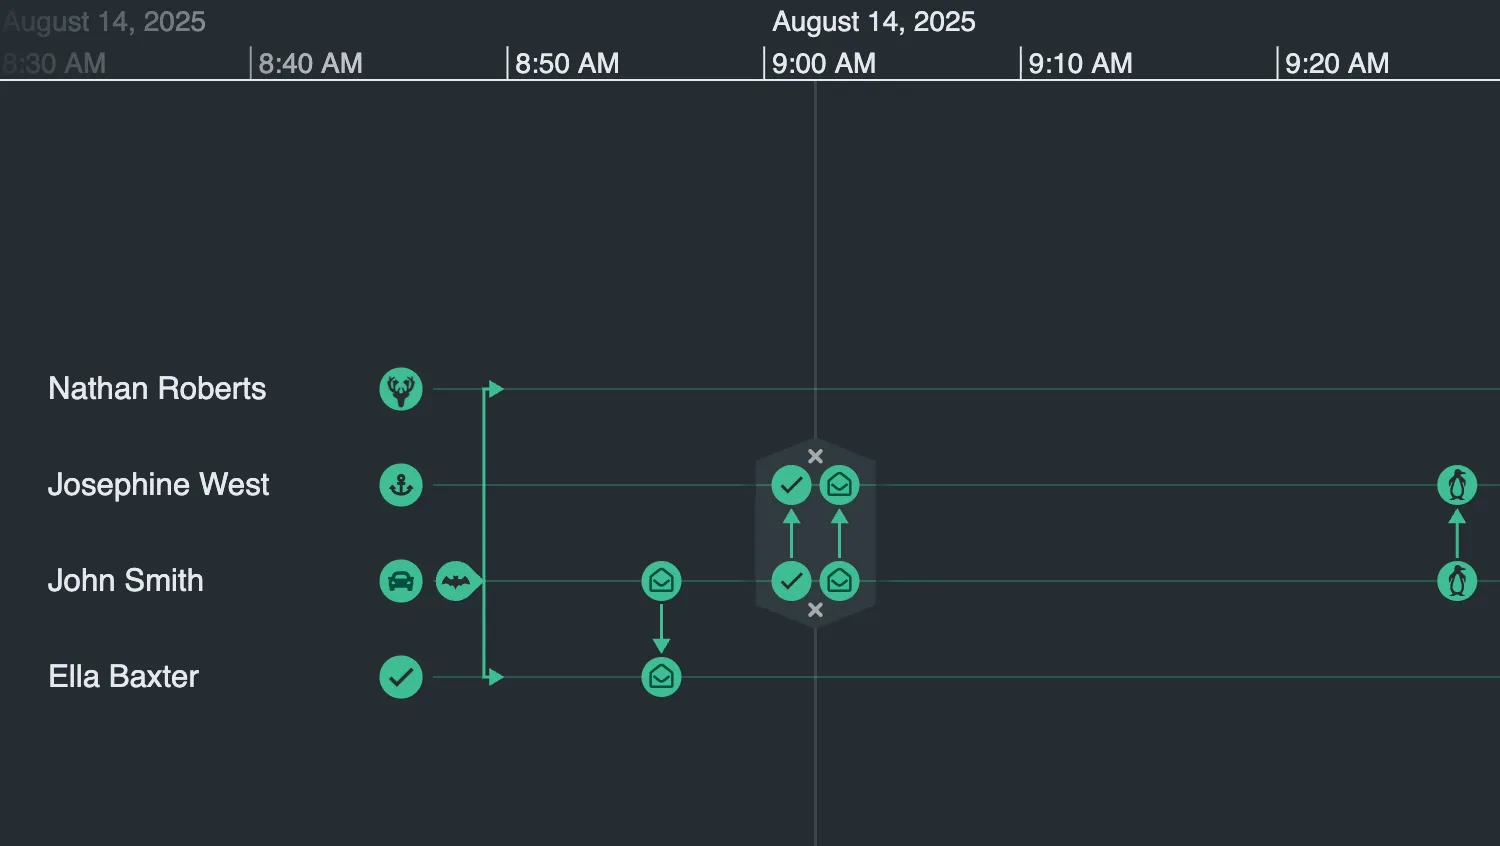
Font Icons
Decorate entities and events with font icons.
See example
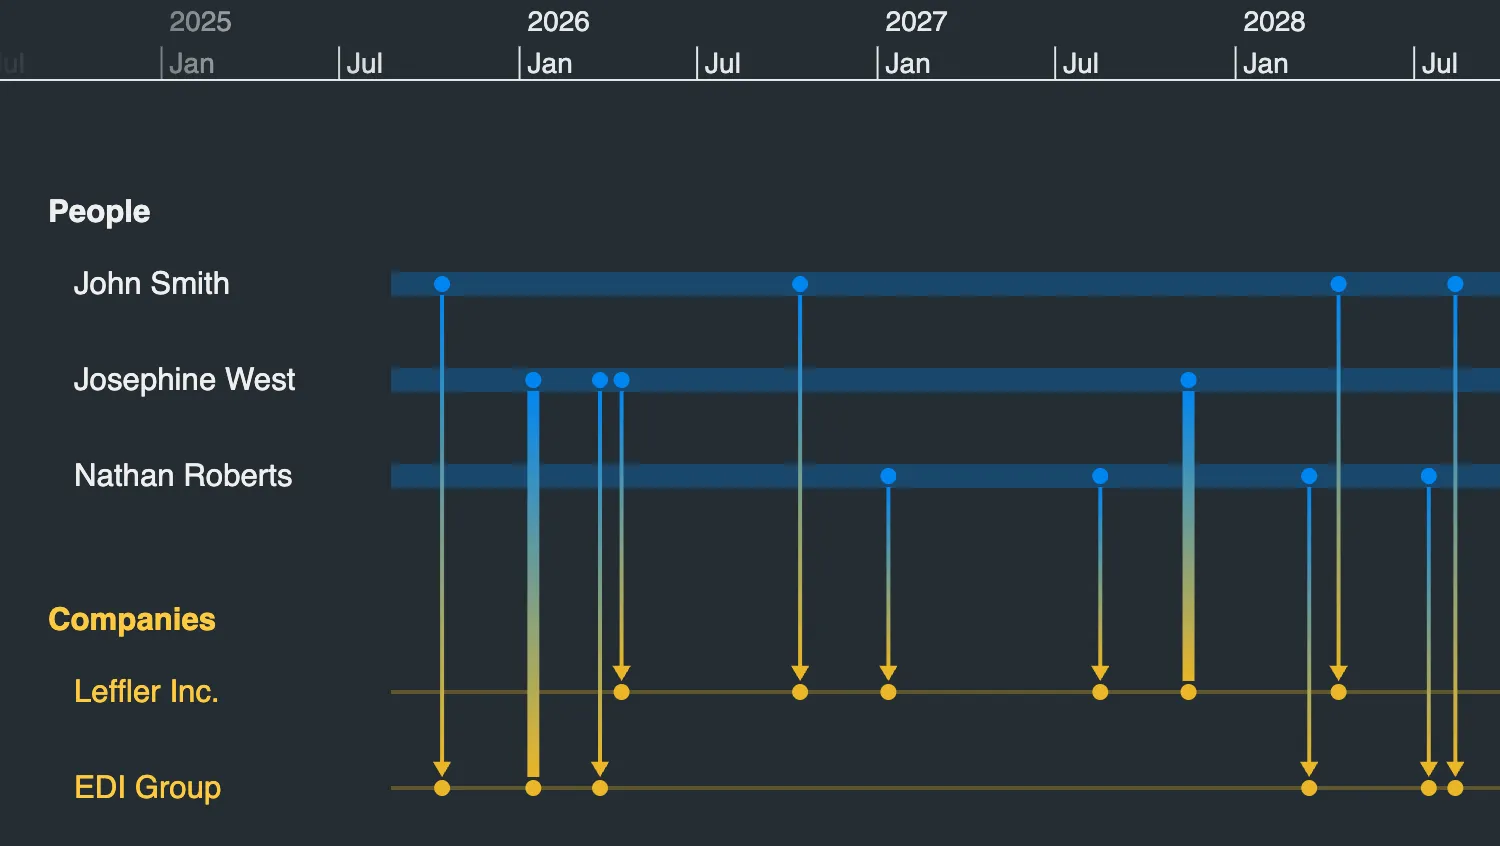
Styling Items by Type
Define reusable styles in types for consistent theming.
See example
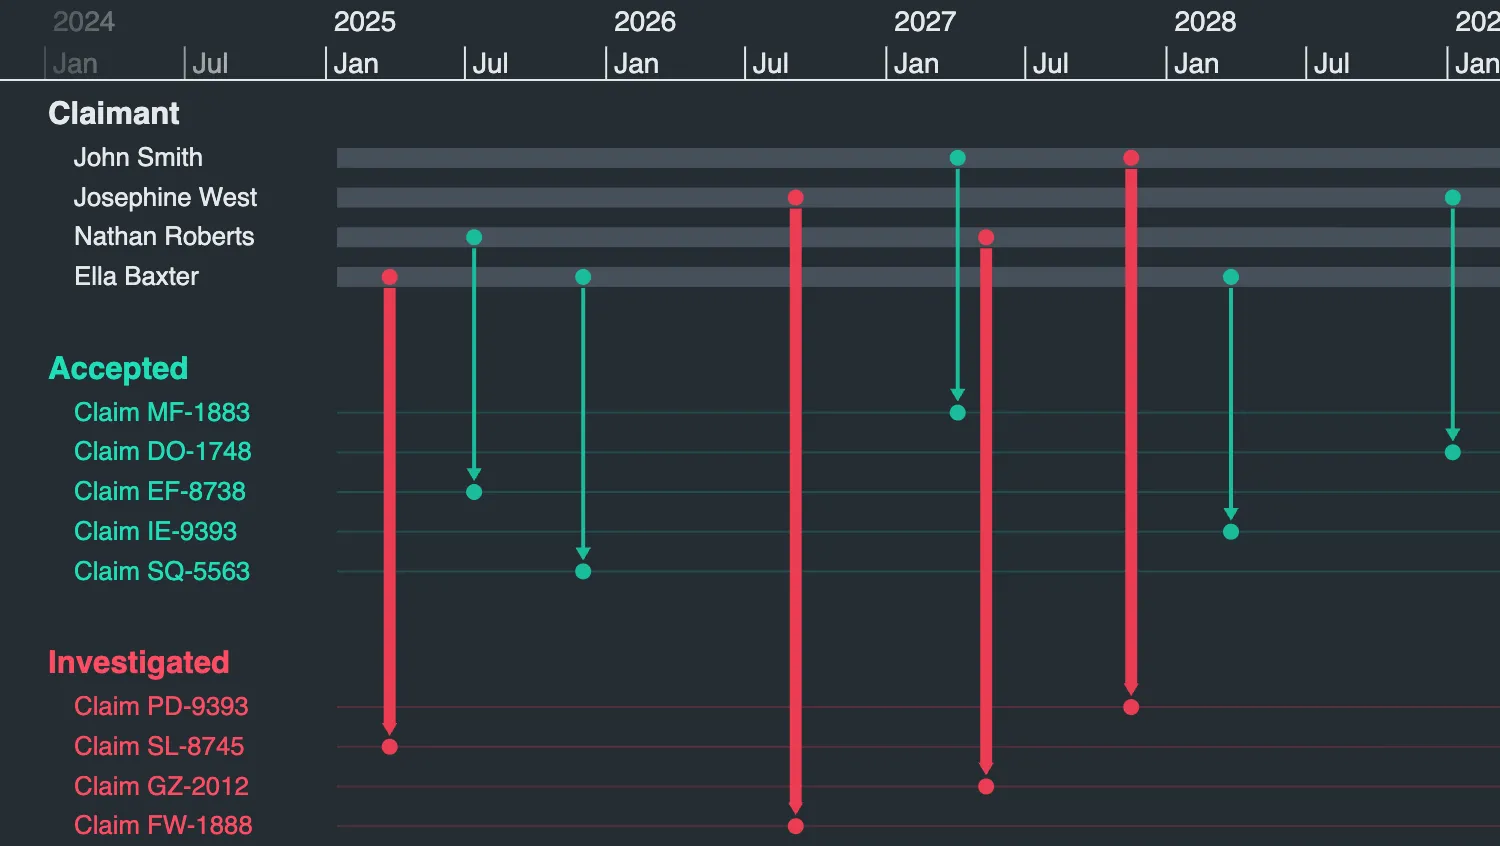
Inherited Styles
Inherit visual properties from base types using baseType.
See example
Entities
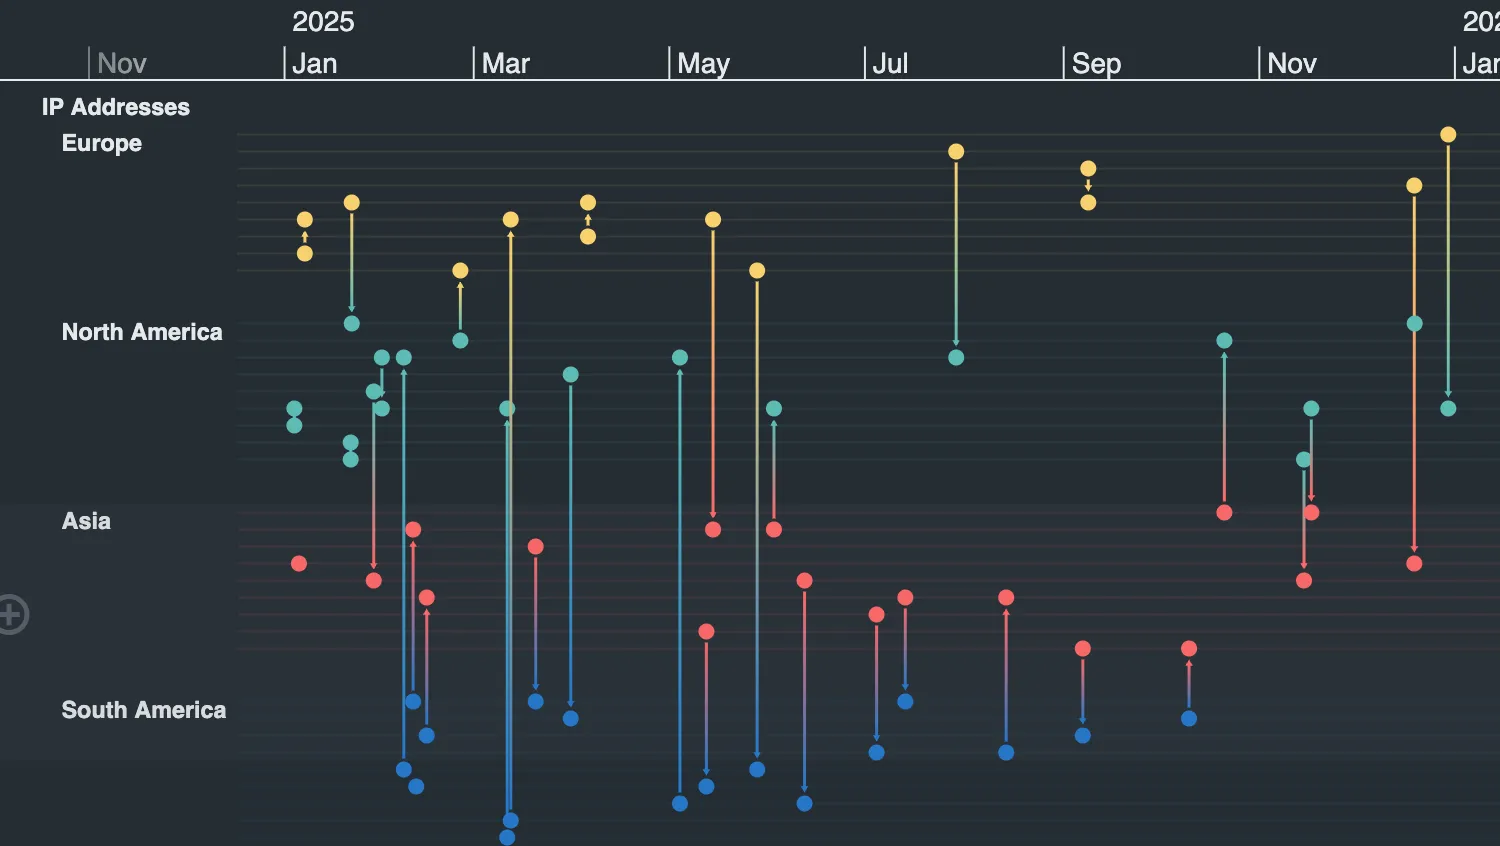
Groups
Organize entities into a multi-level nested hierarchy.
See example
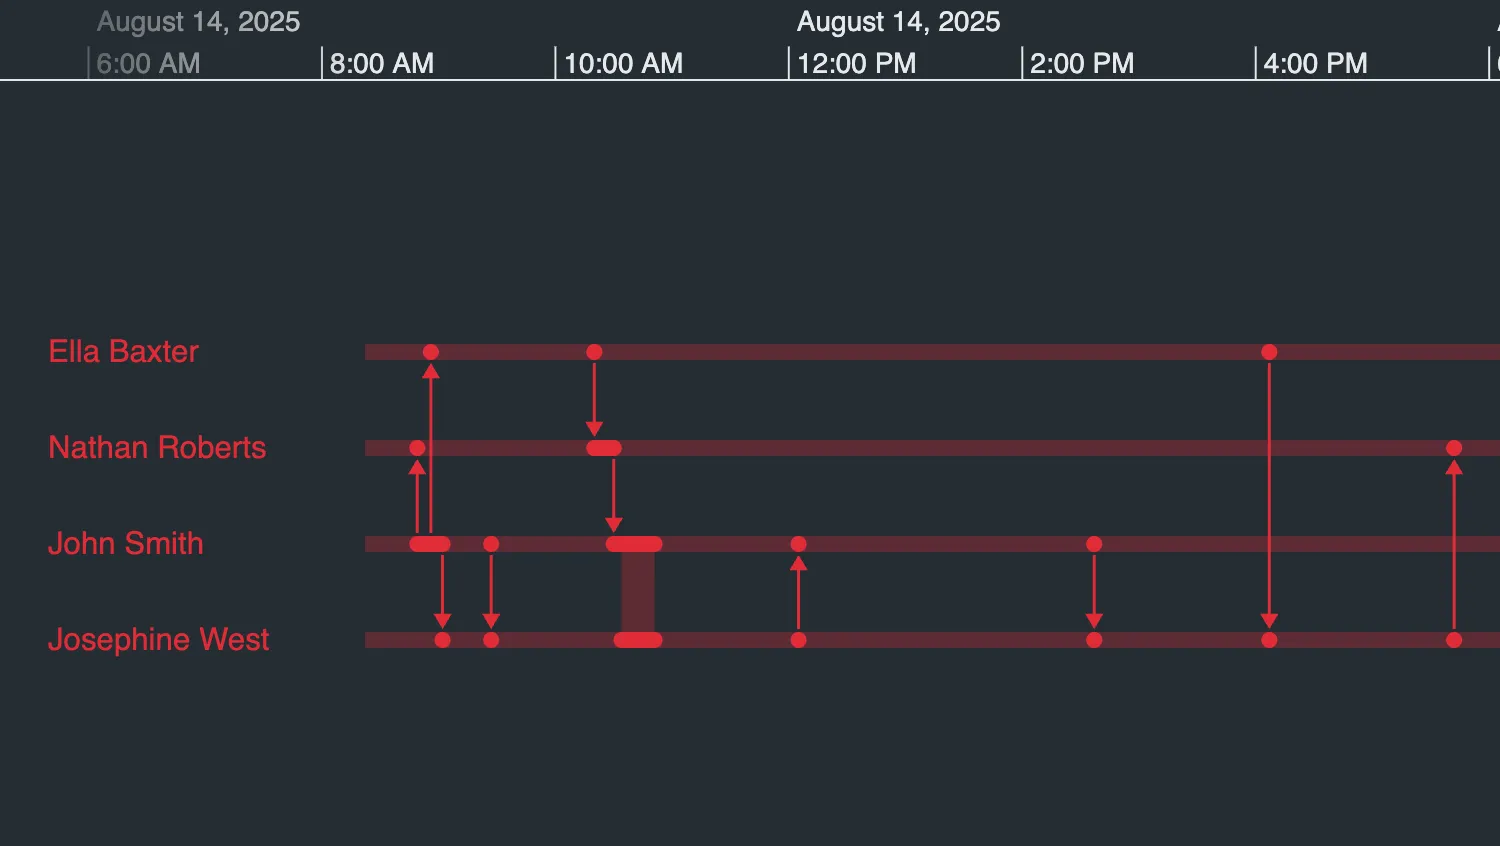
Styling Entities
Change the styling of individual entities or entity groups.
See example
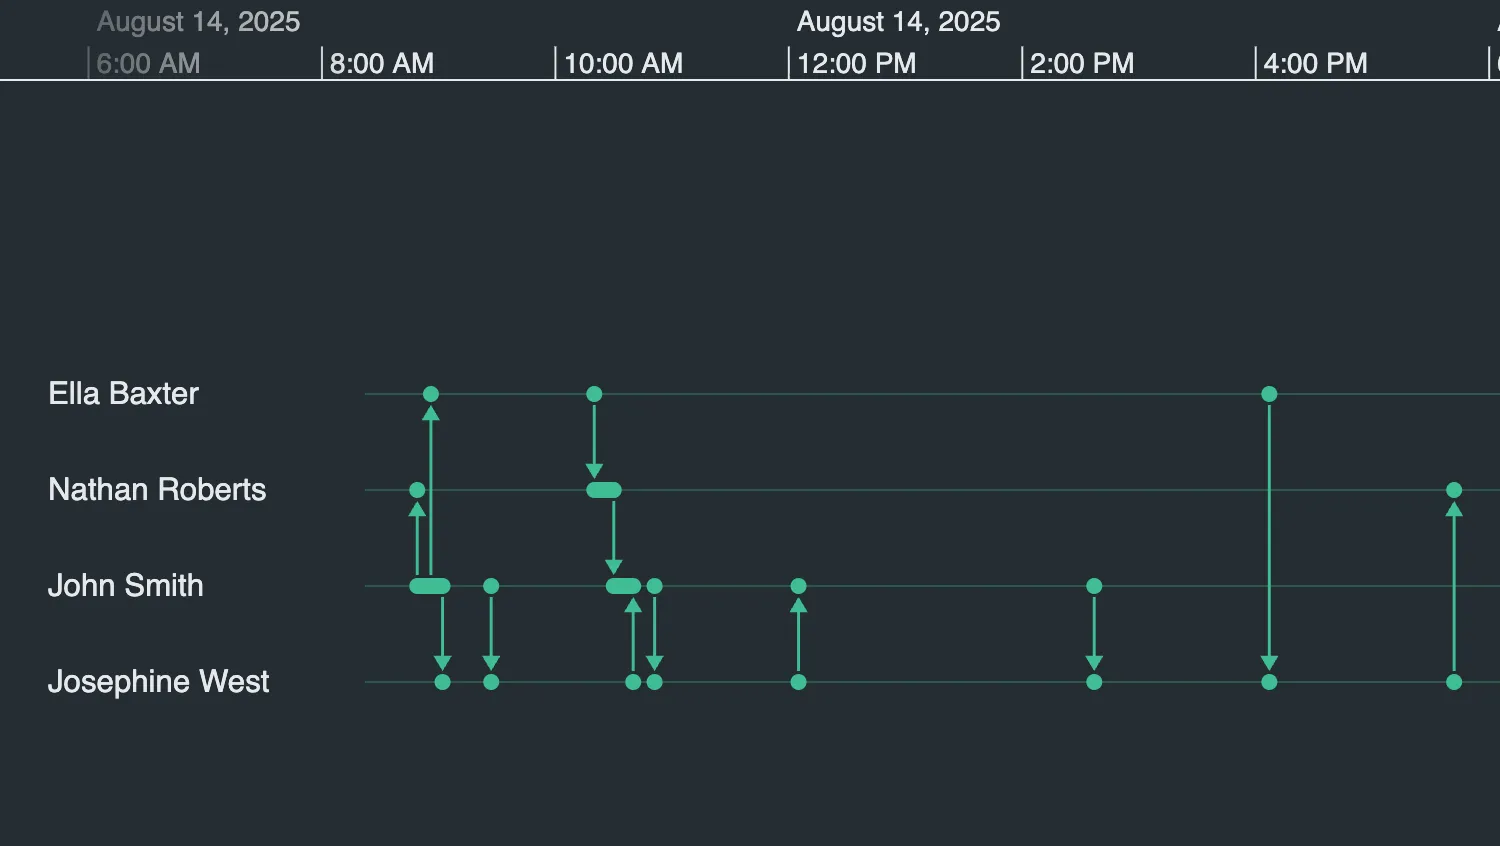
Connected Entities
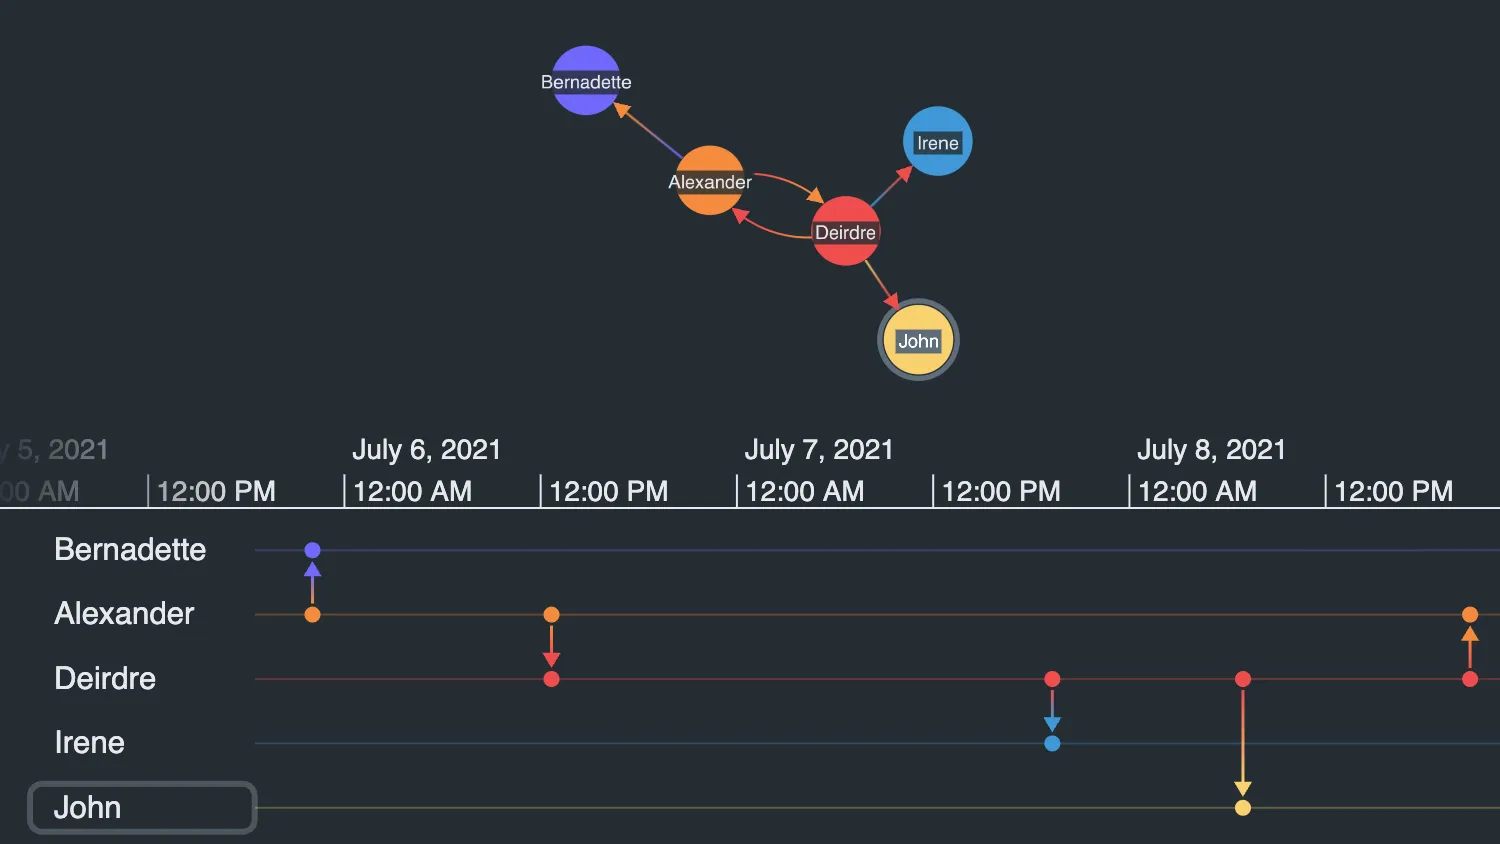
Connect entities with directional or non-directional events.
See example
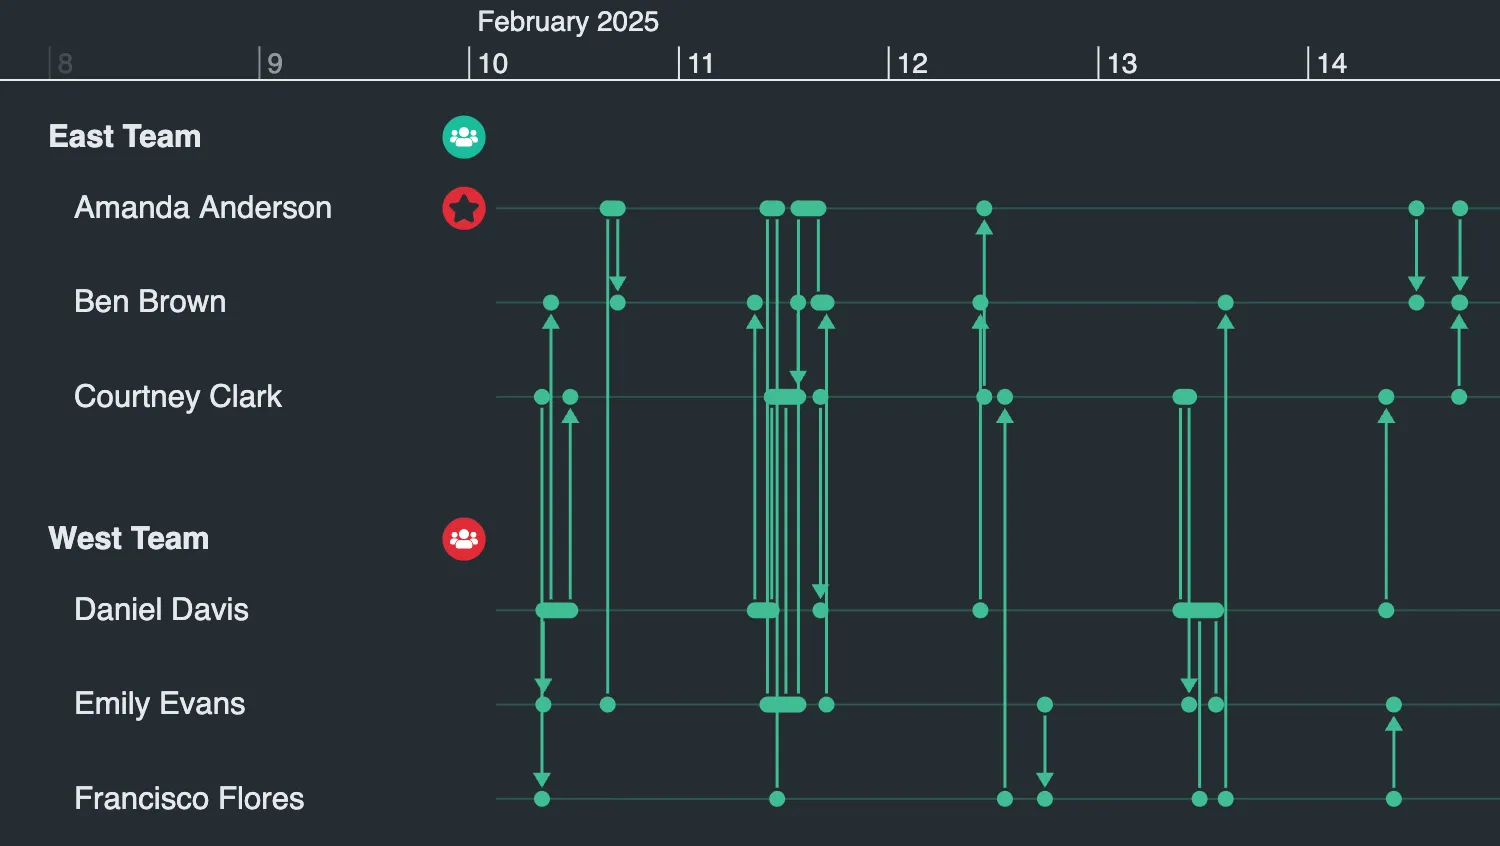
Styling Glyphs
Style glyphs decorating entities and entity type labels.
See example
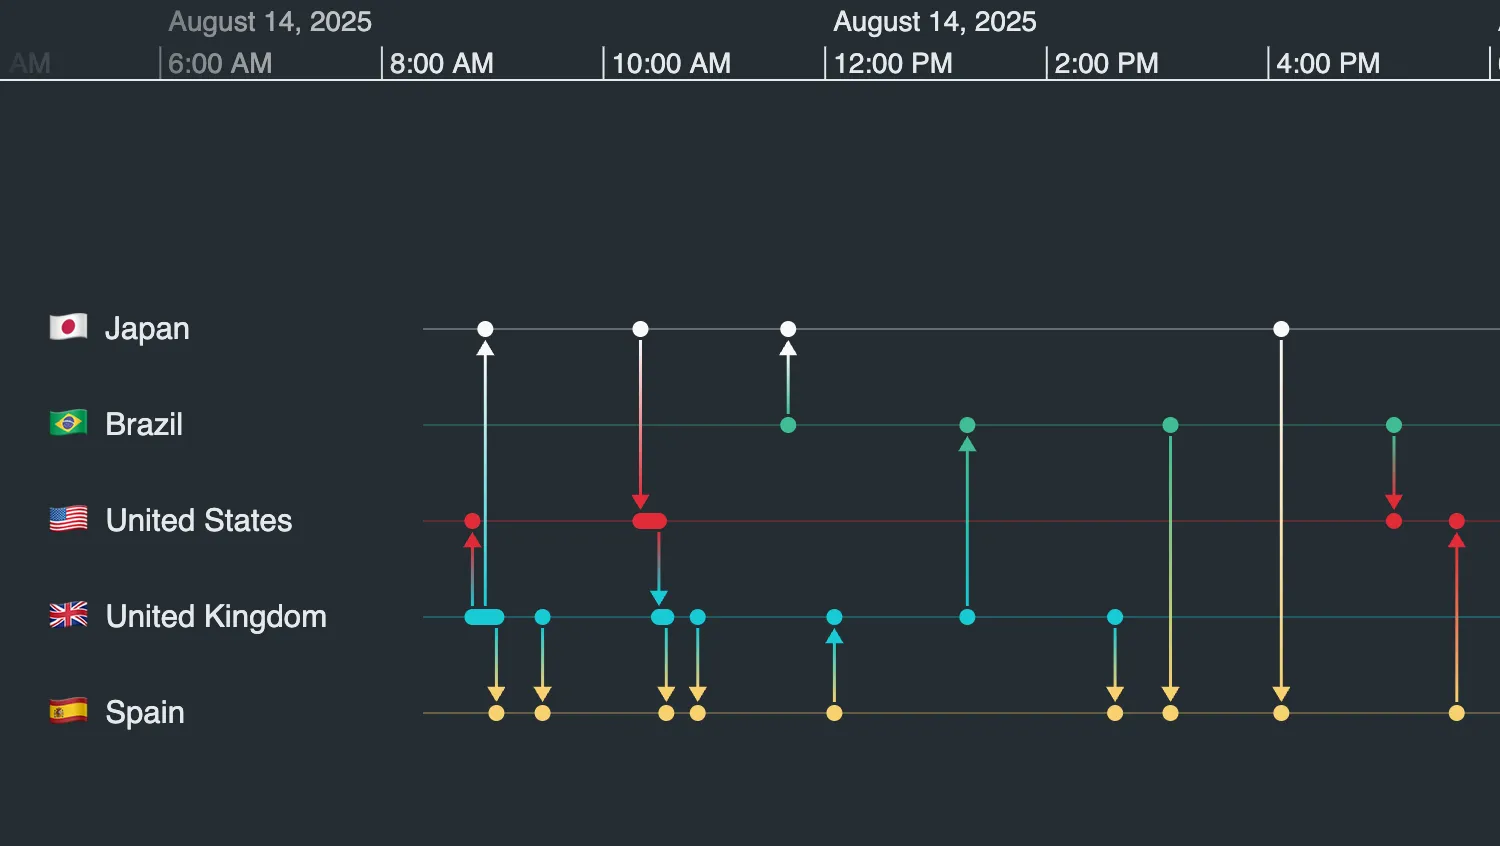
Emojis
Use emoji characters in your timeline.
See example
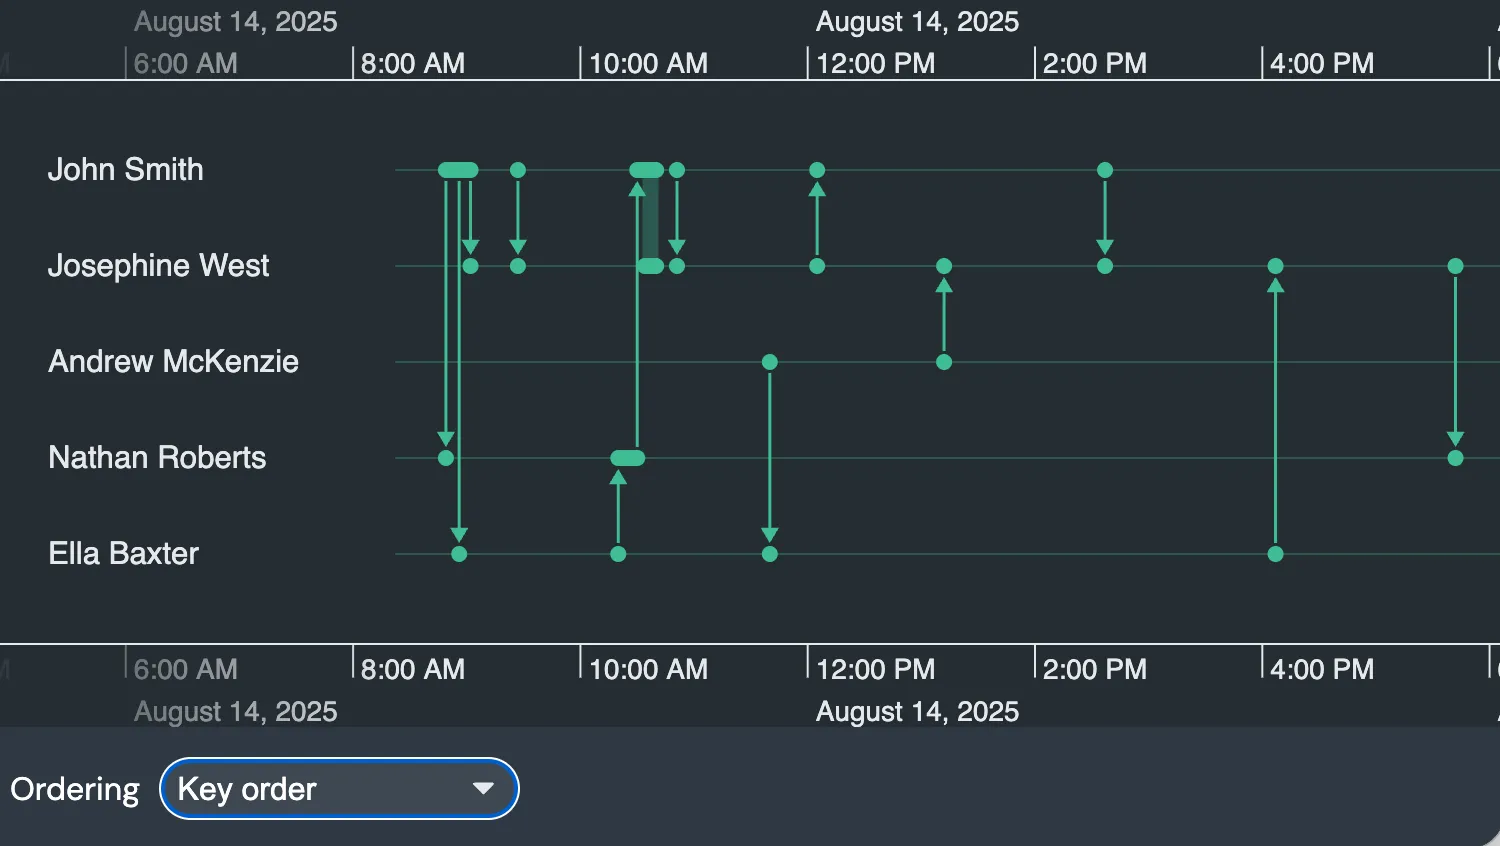
Ordering
Control how entities are ordered vertically in the timeline.
See example
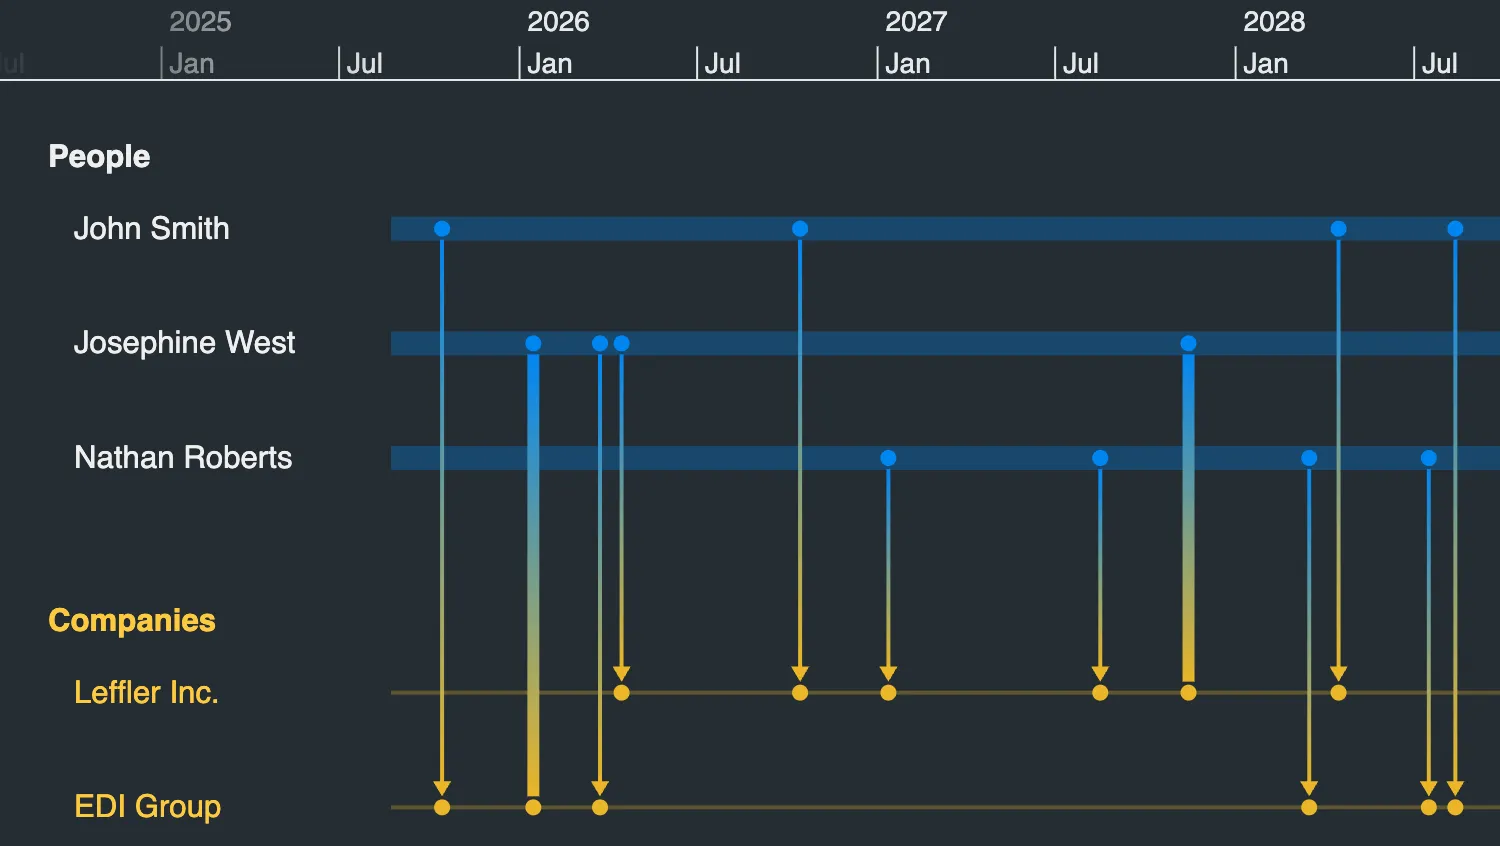
Spacing
Adjust the vertical spacing between entity rows.
See example
Events
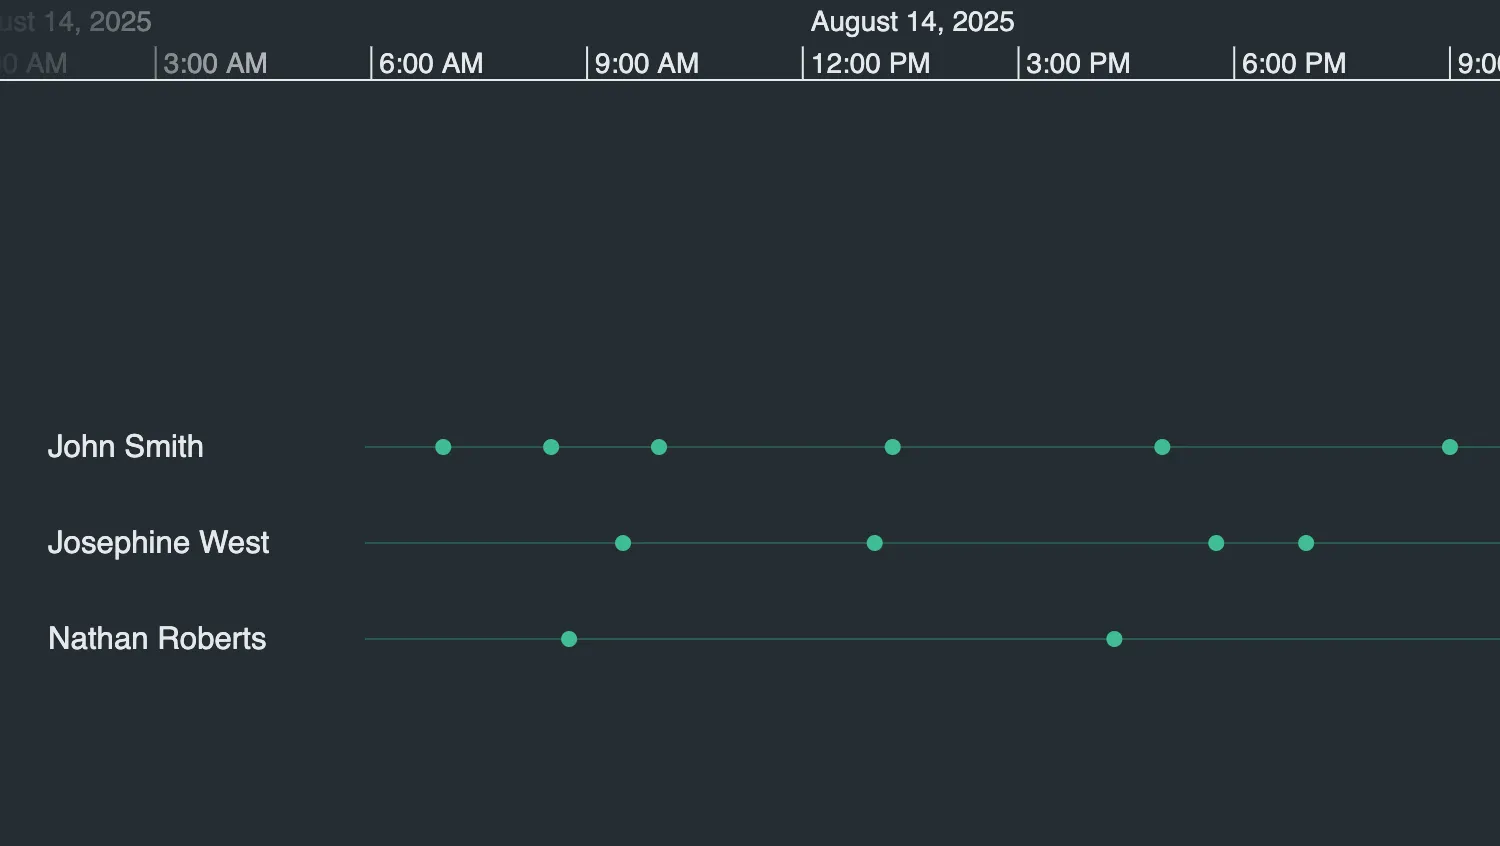
Simple Events
Explore the JSON object data format for the timeline.
See example
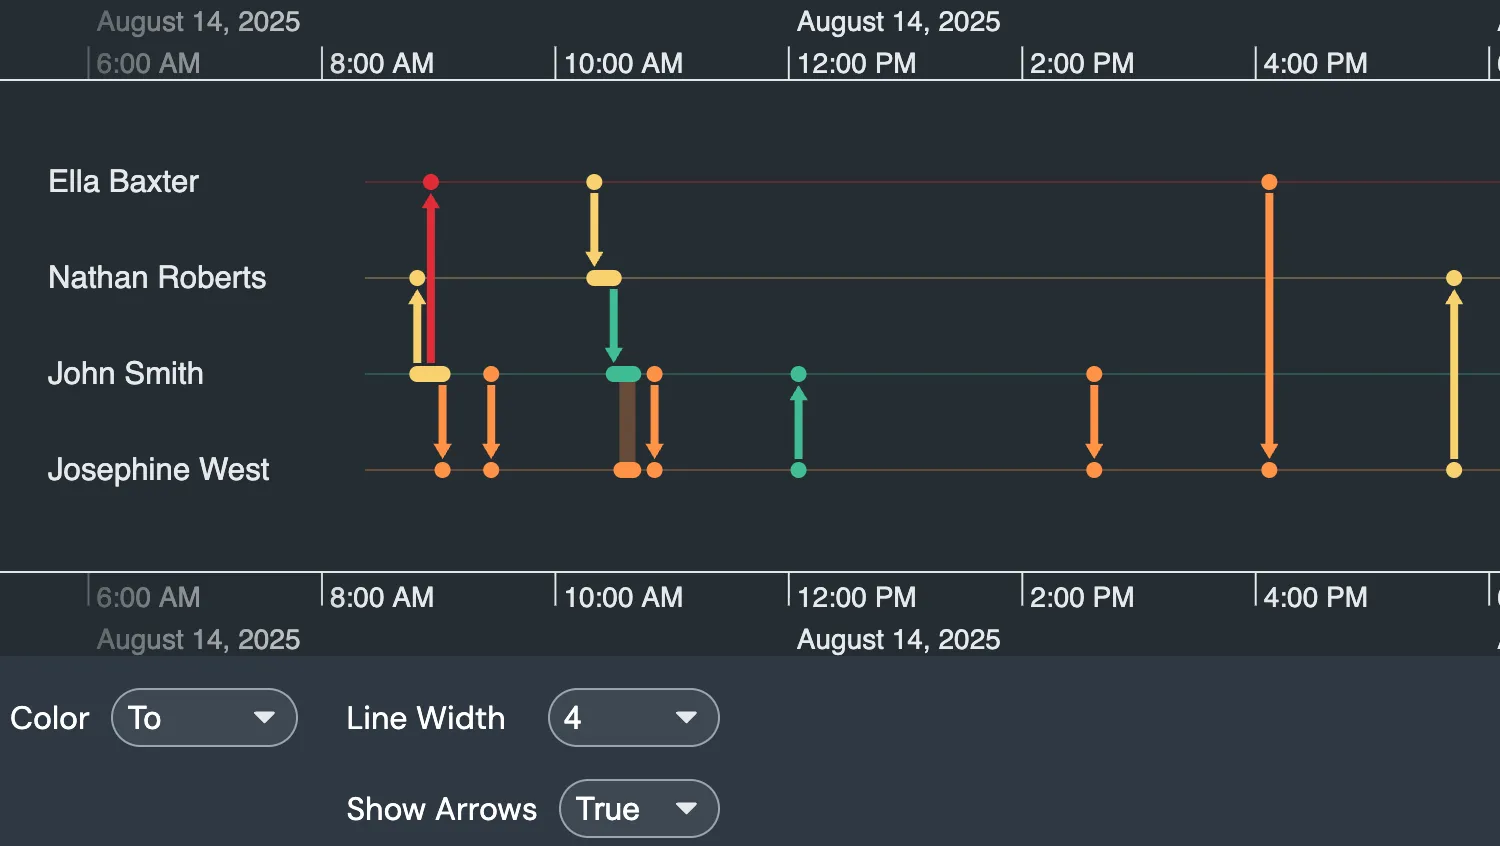
Styling Events
Change the styling of individual events or event types.
See example
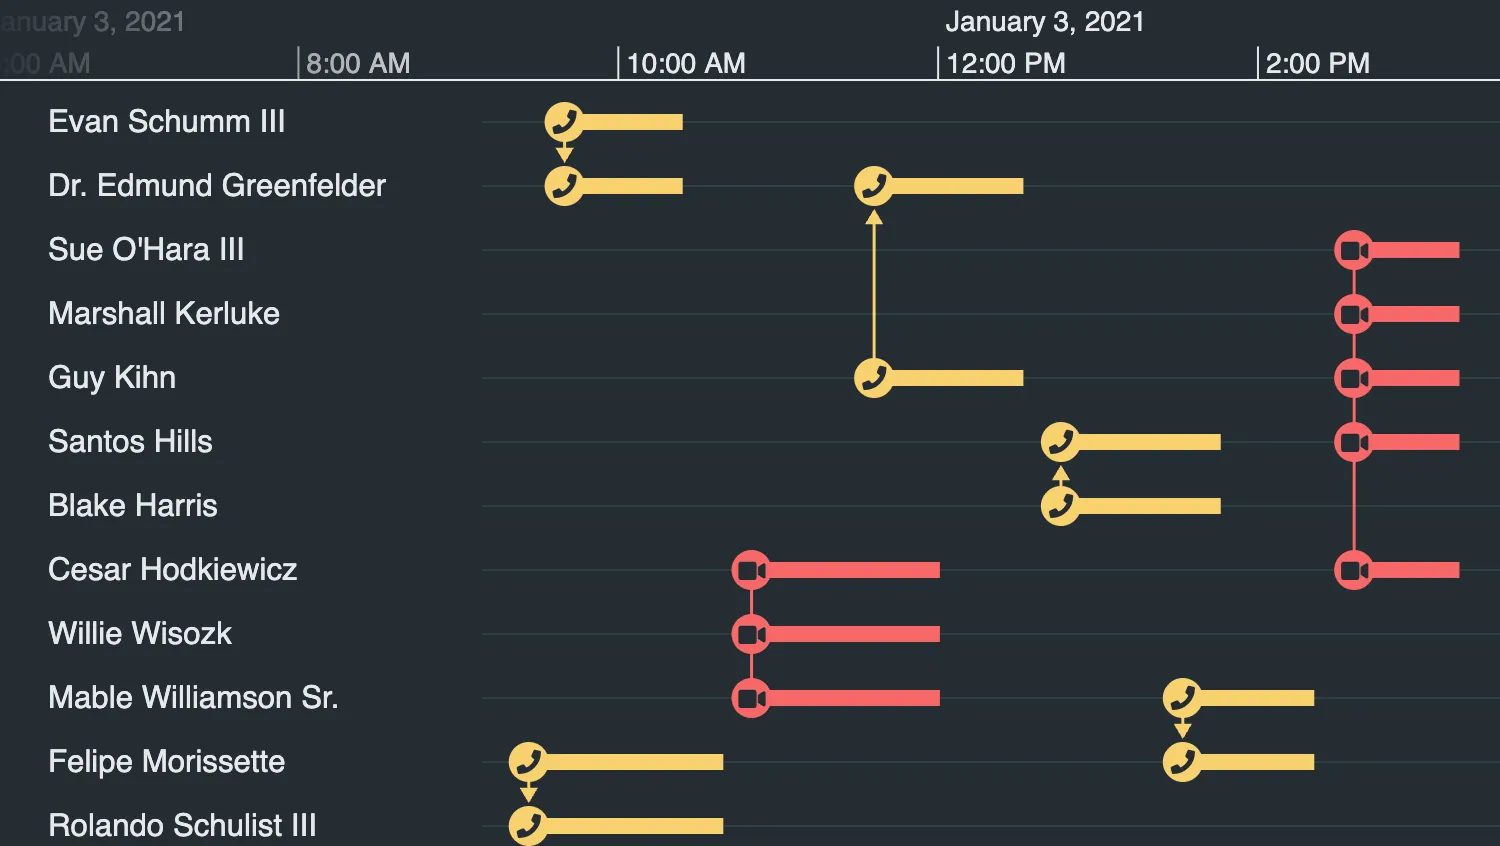
Events with Duration
Visualize events with a duration in the timeline.
See example
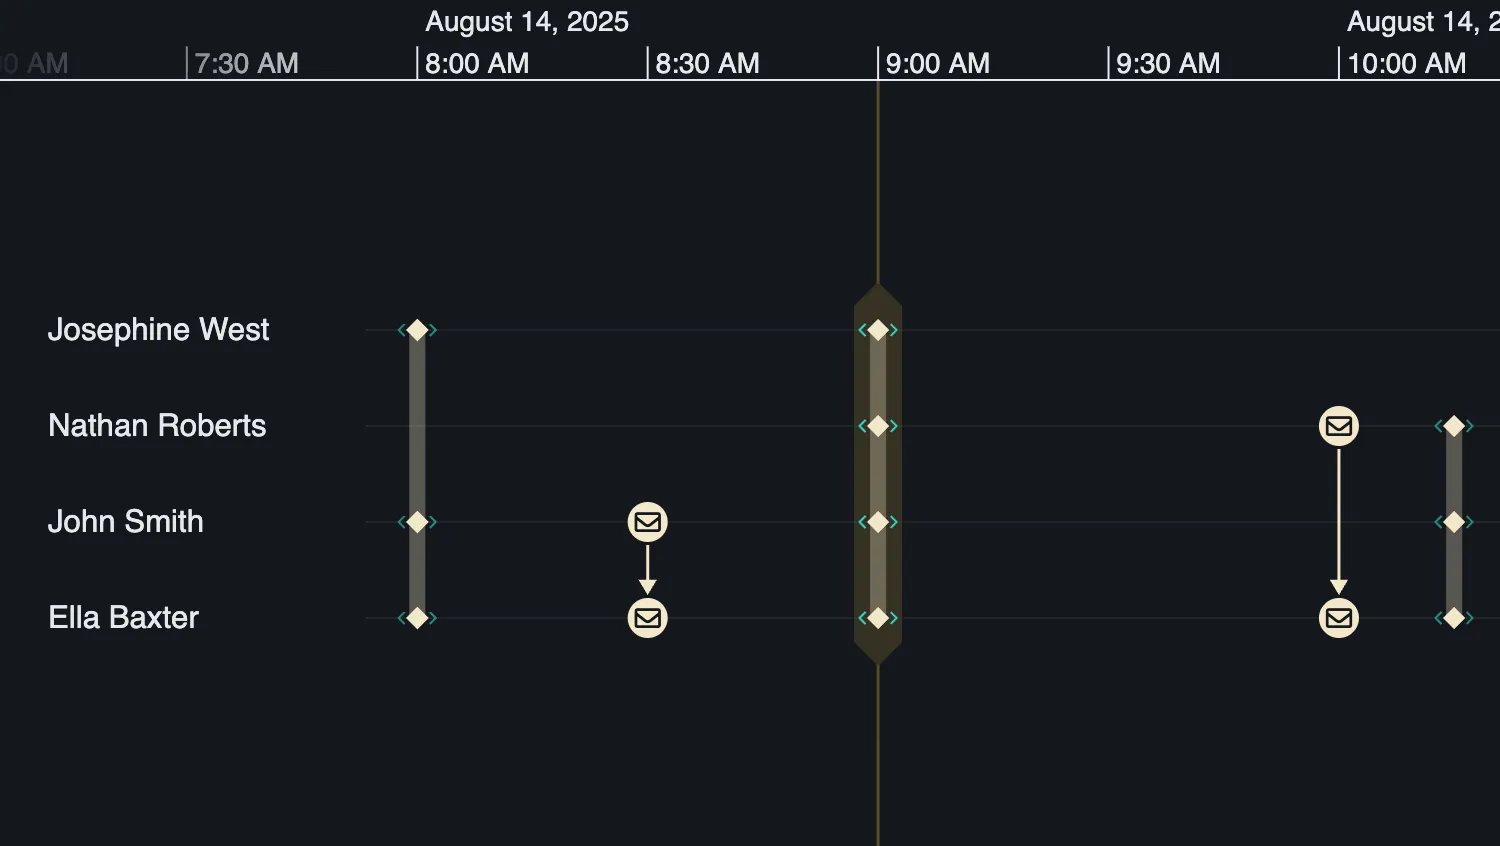
Event Folds
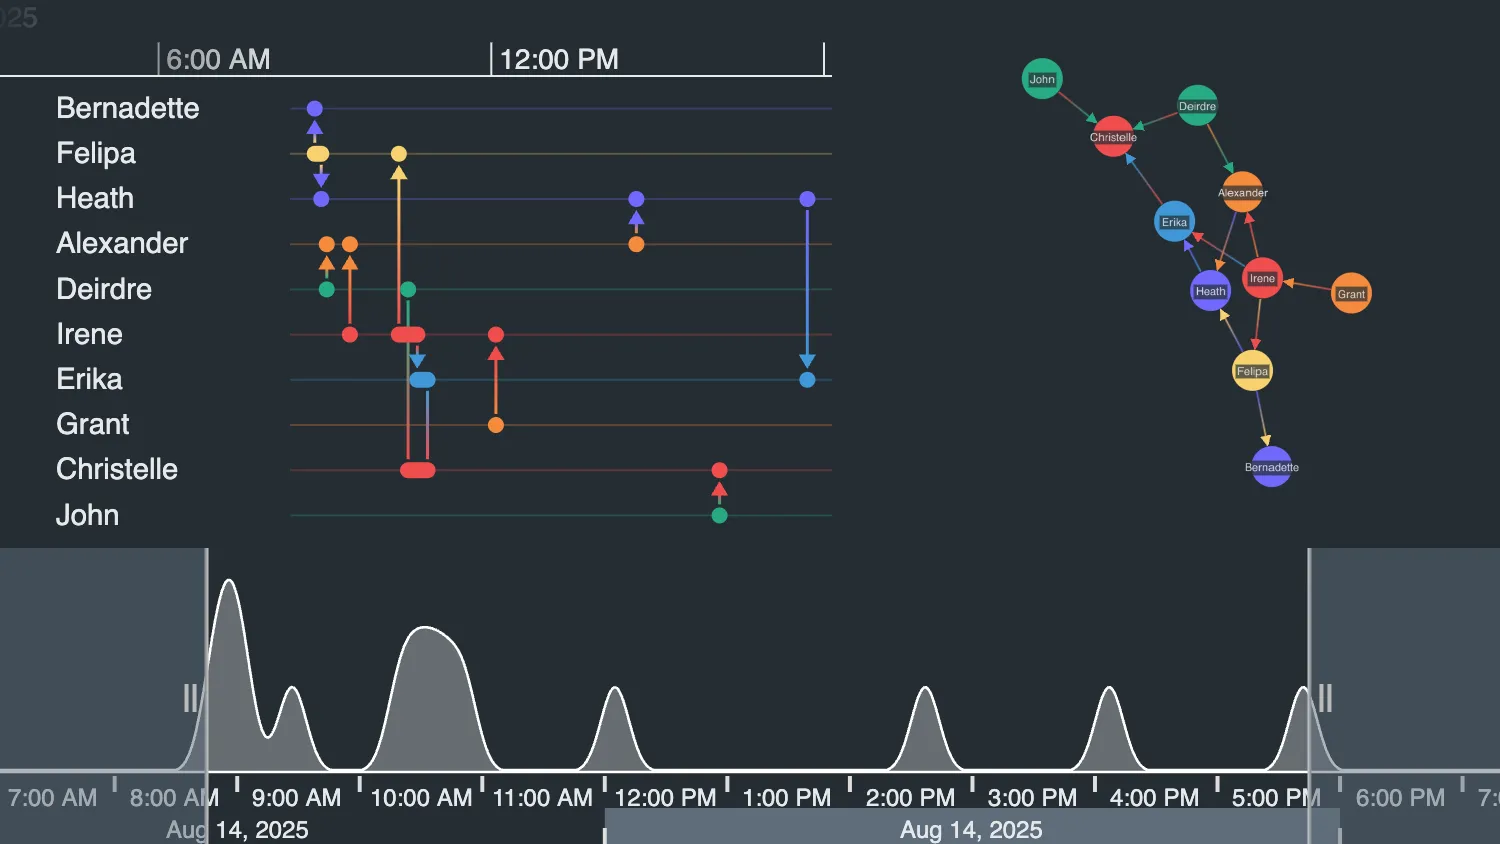
Group simultaneous events into collapsible folds.
See example
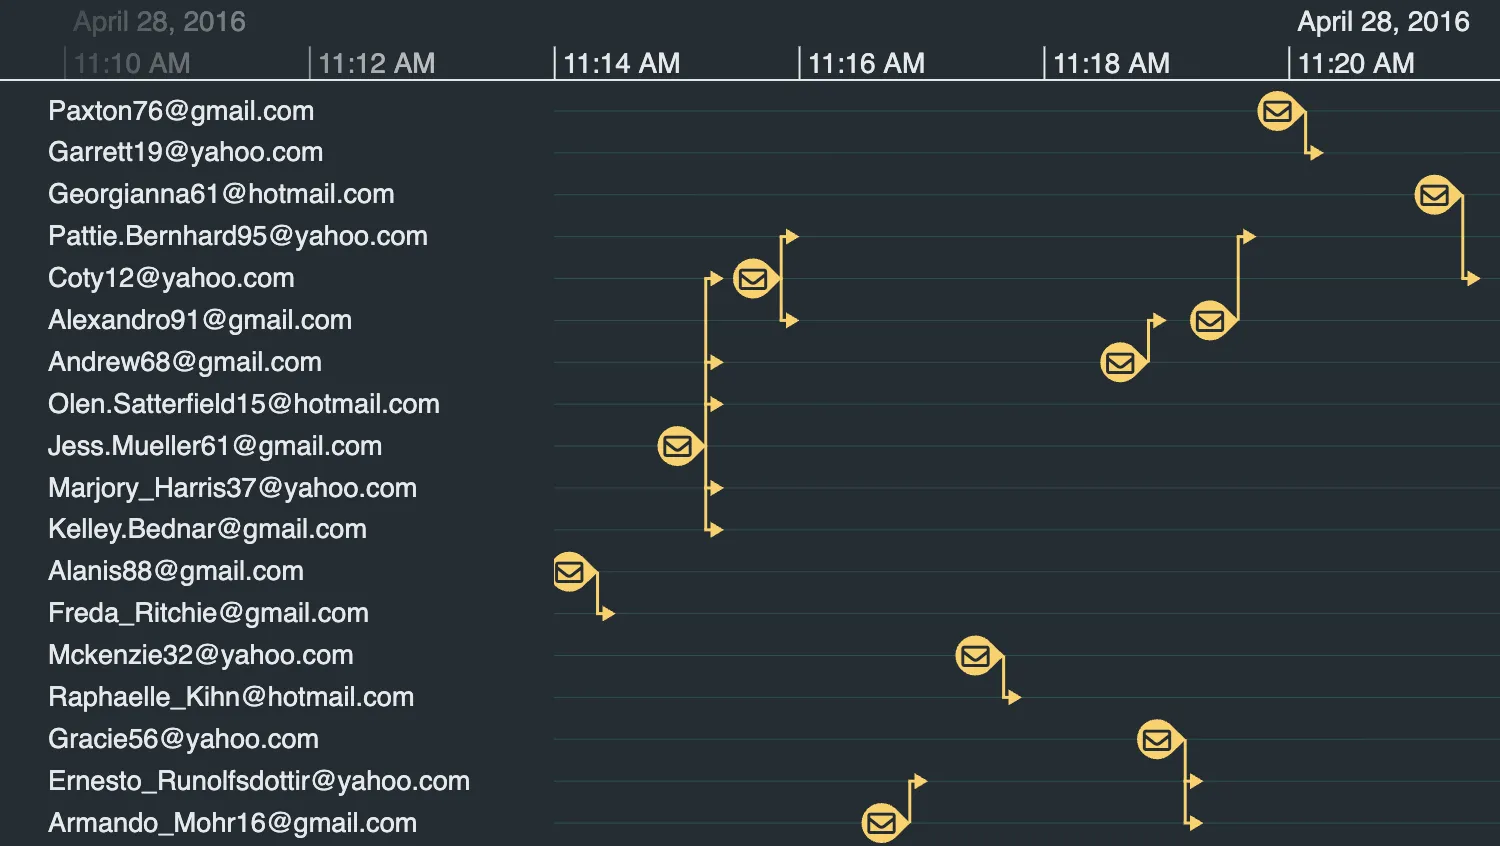
Multiple Recipients
Model broadcast events from one source to many targets.
See example
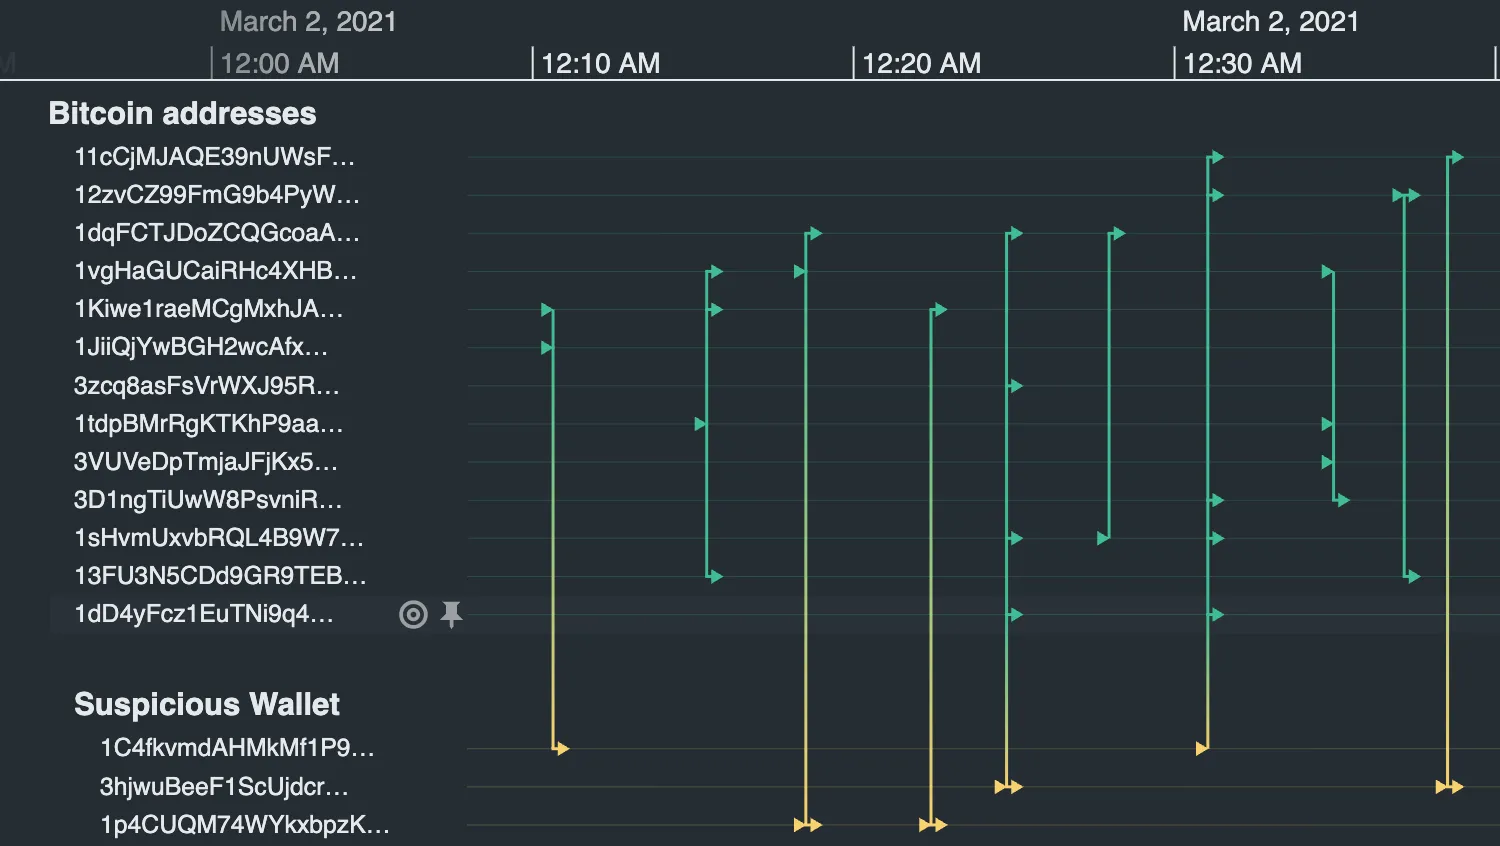
Multiple Sources
Represent many-to-many transactions across entities.
See example
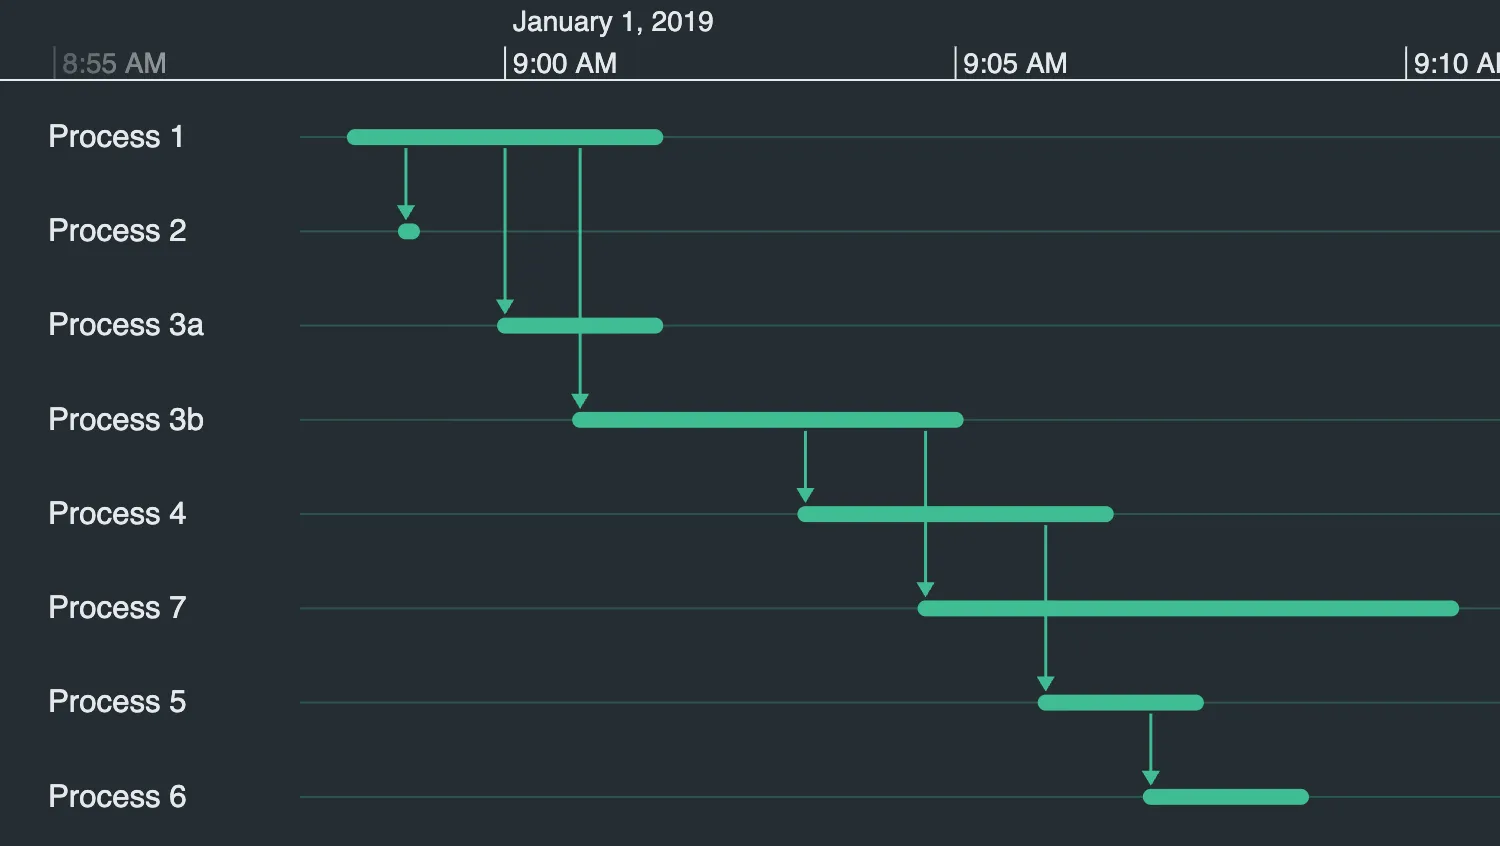
Gantt Chart
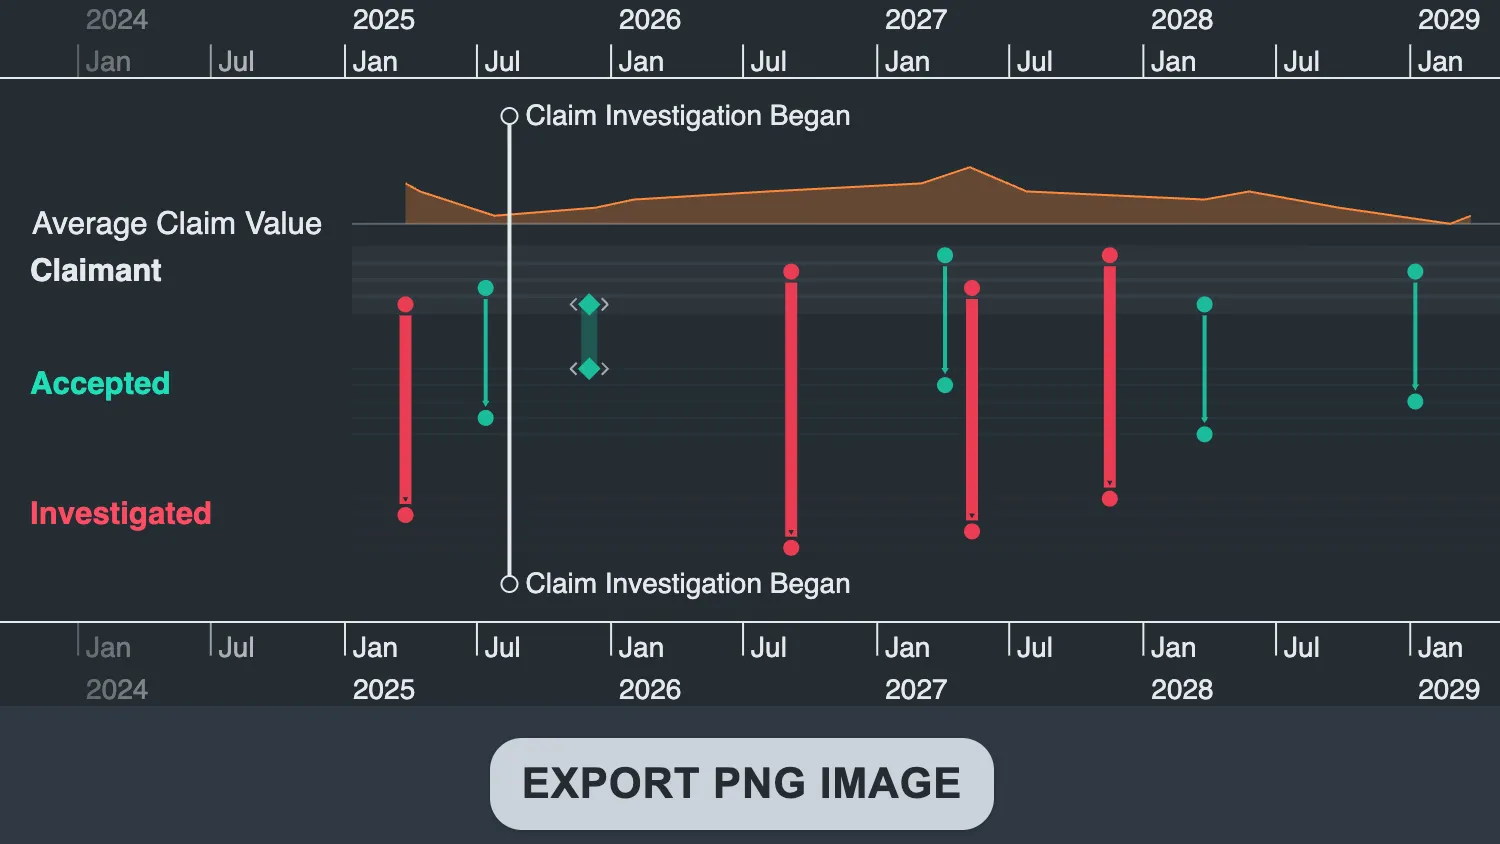
Visualize a sequence of processess using a Gantt chart.
See example
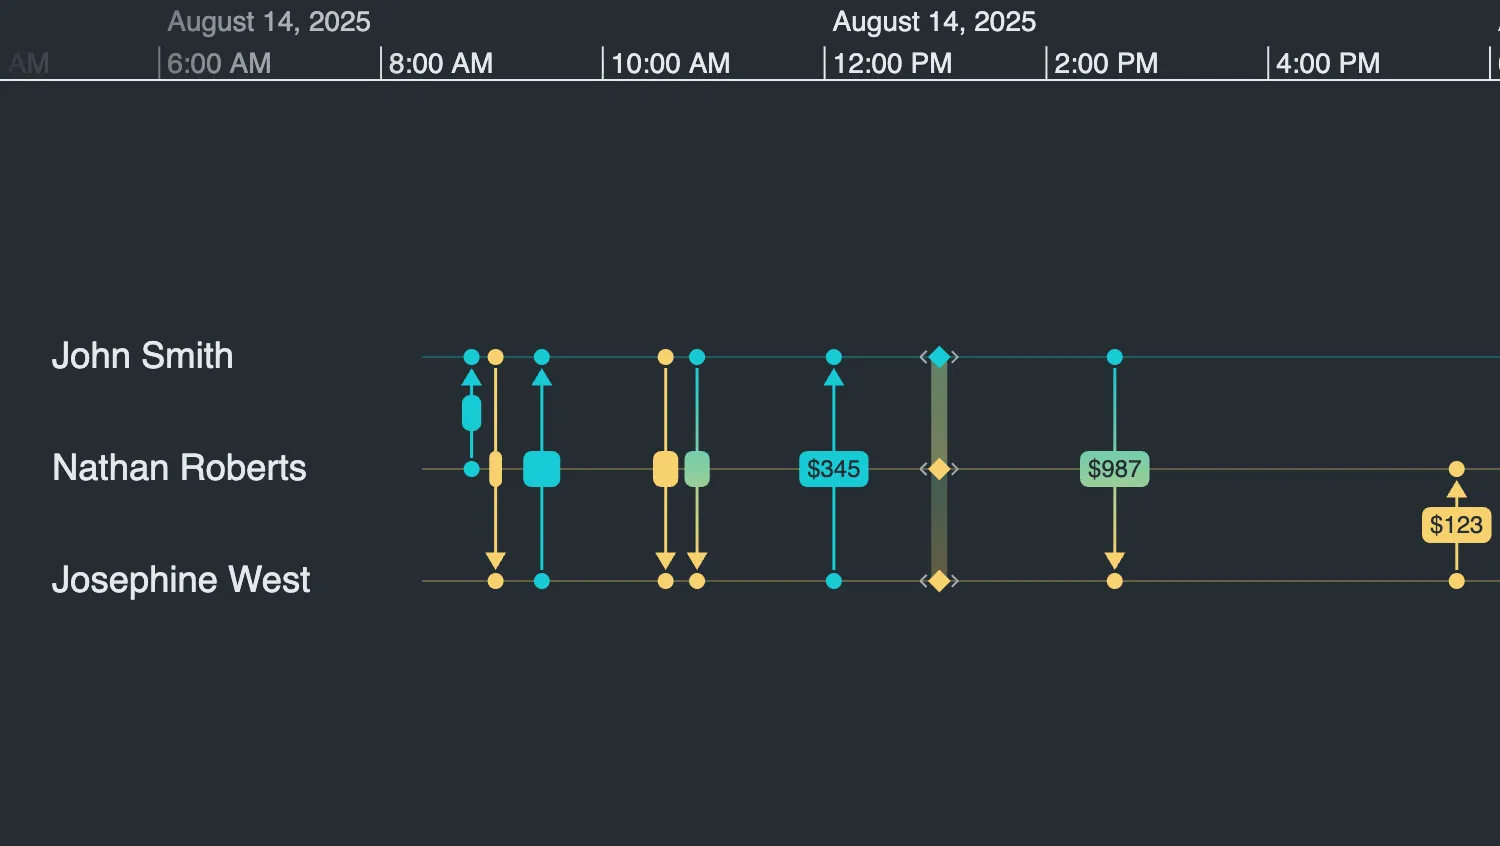
Event Labels
Display text labels on event lines with custom colors.
See example
Styling
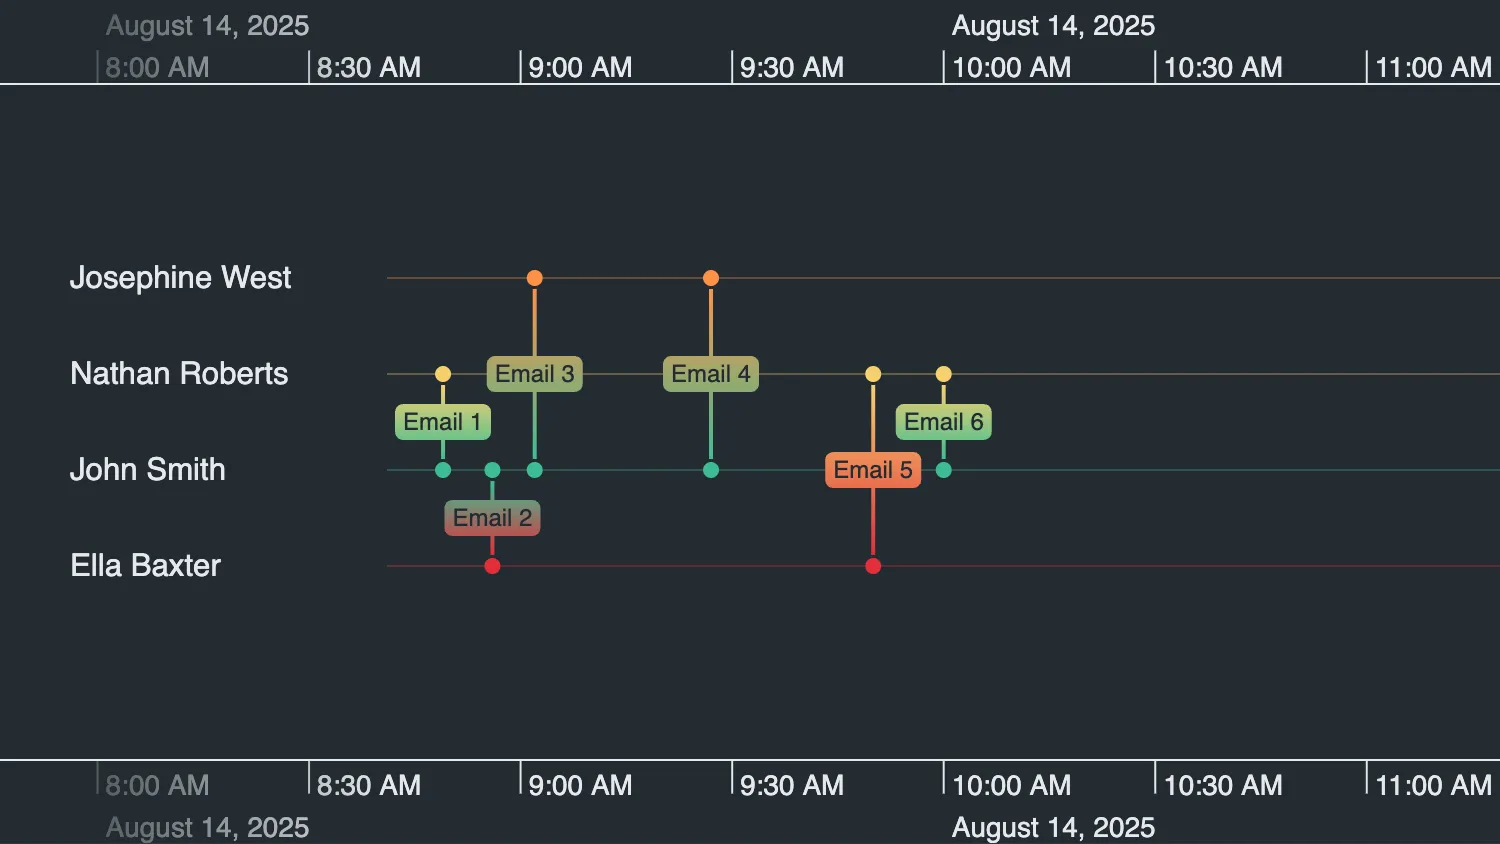
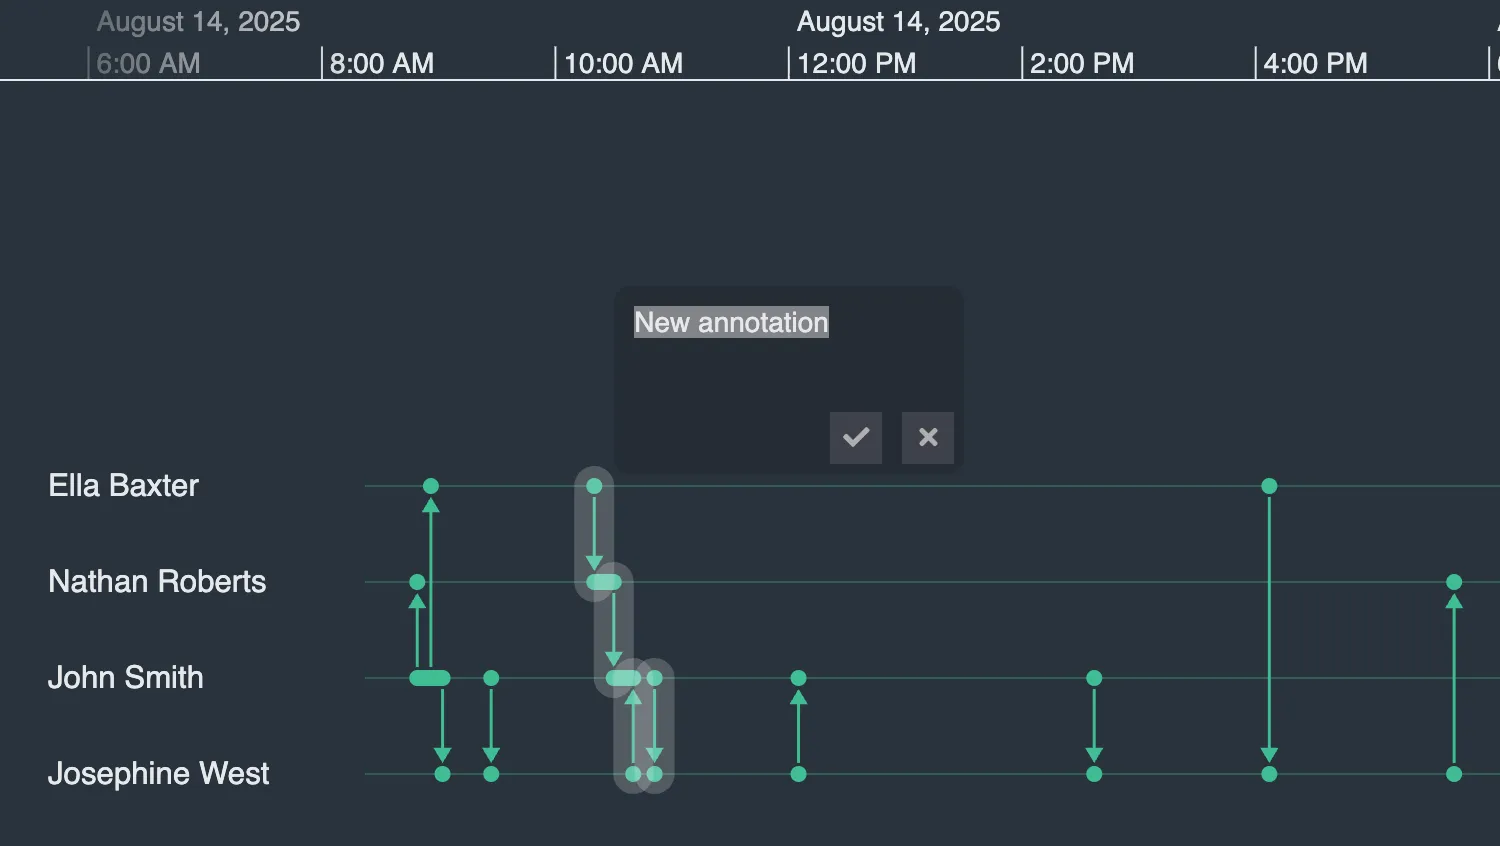
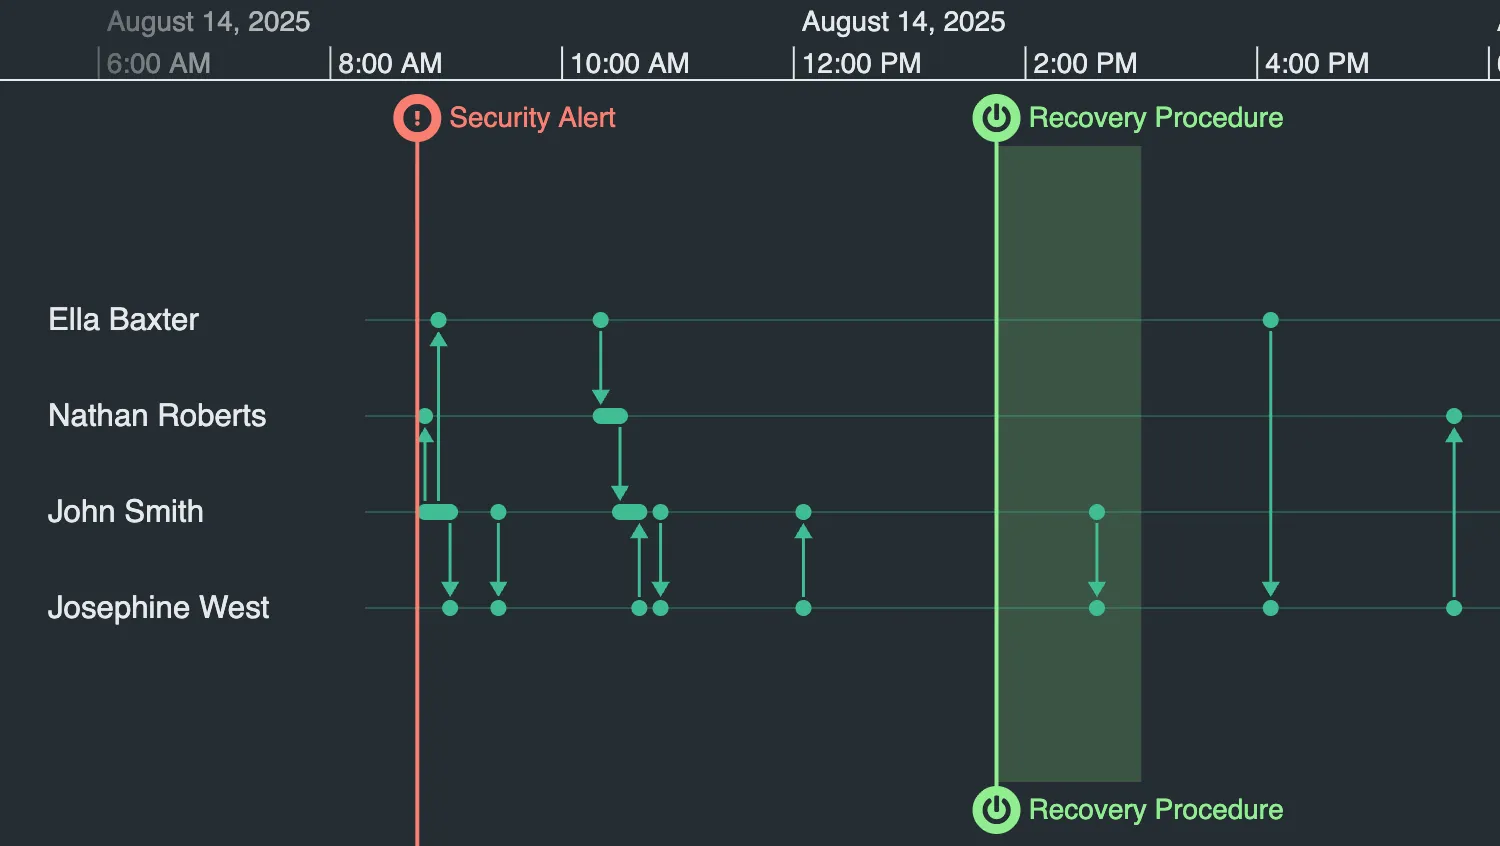
Annotations
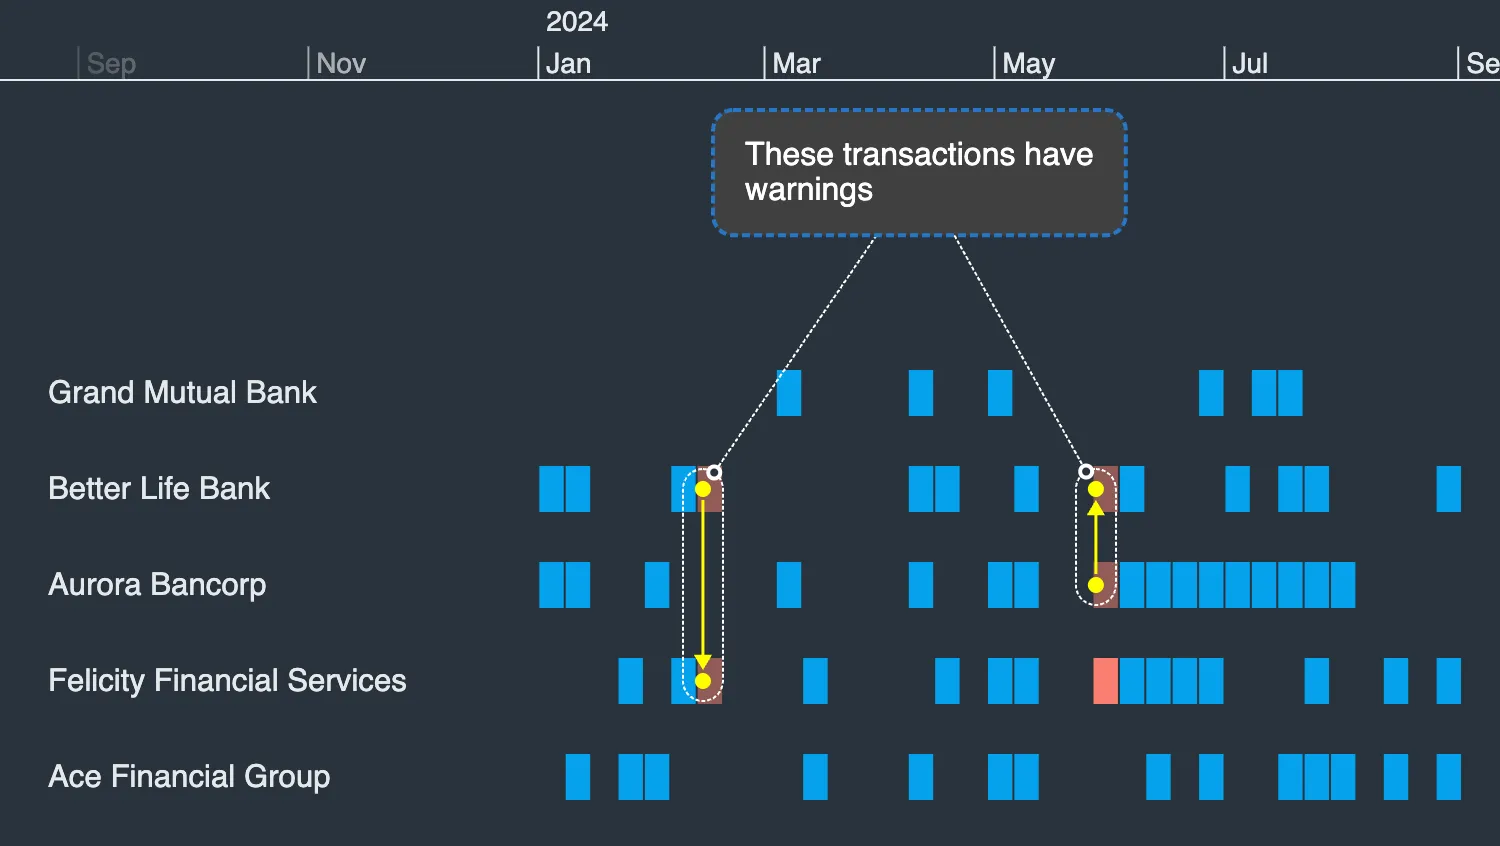
Sizing and Positioning
Handling Data
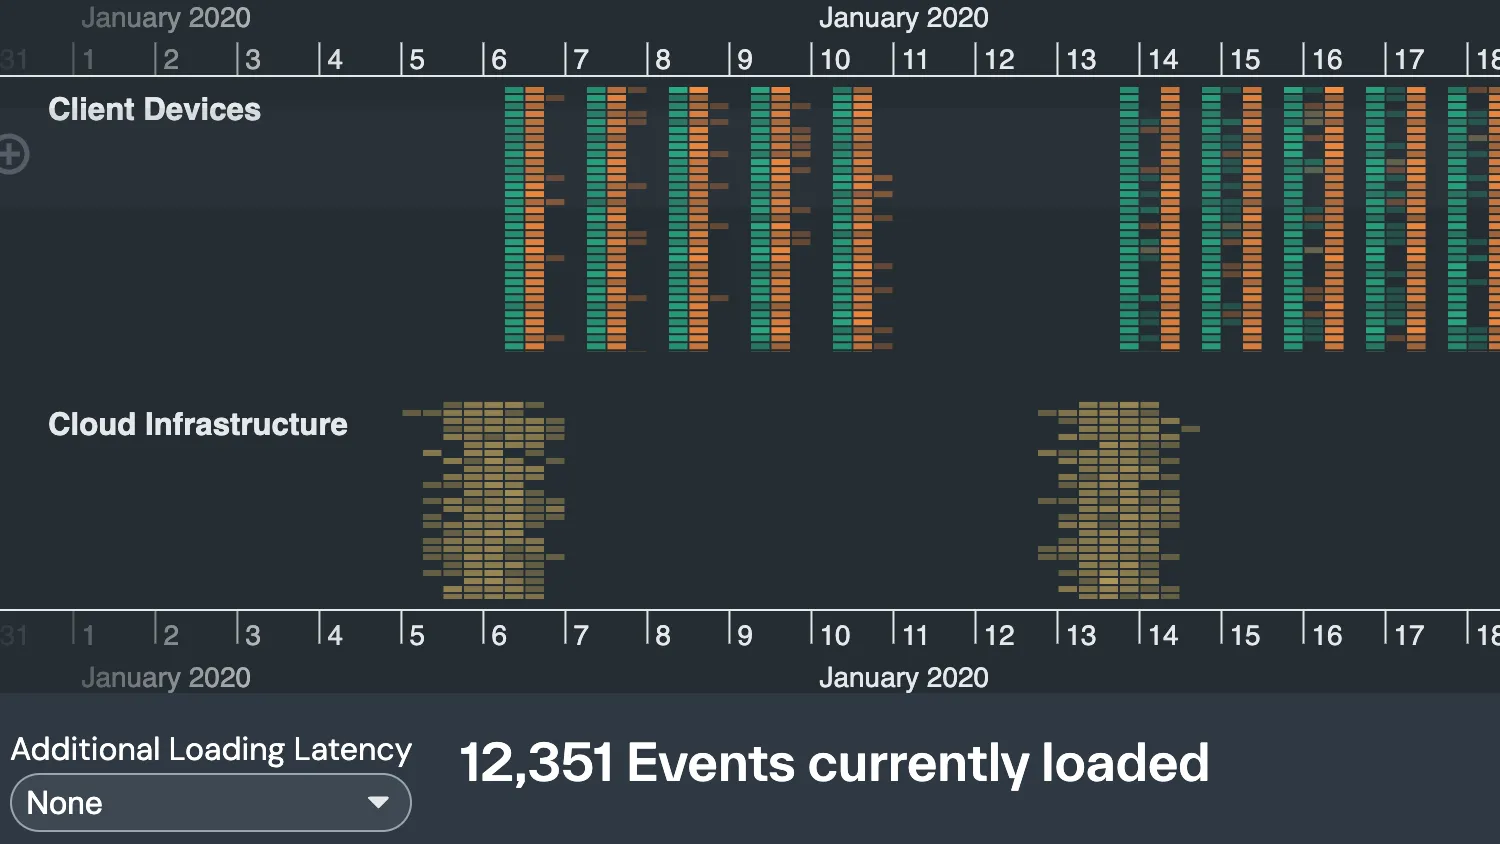
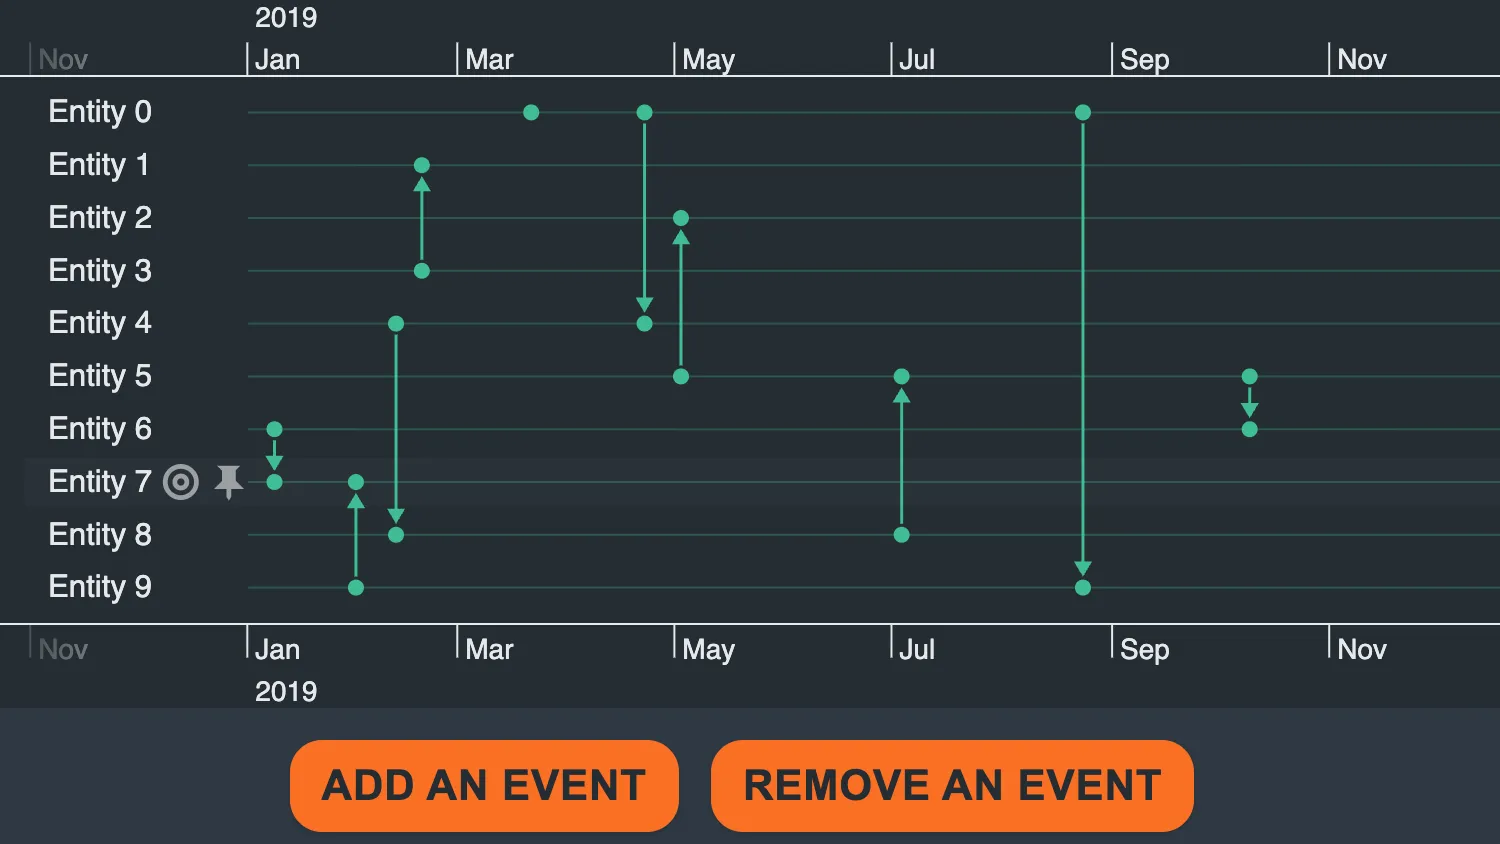
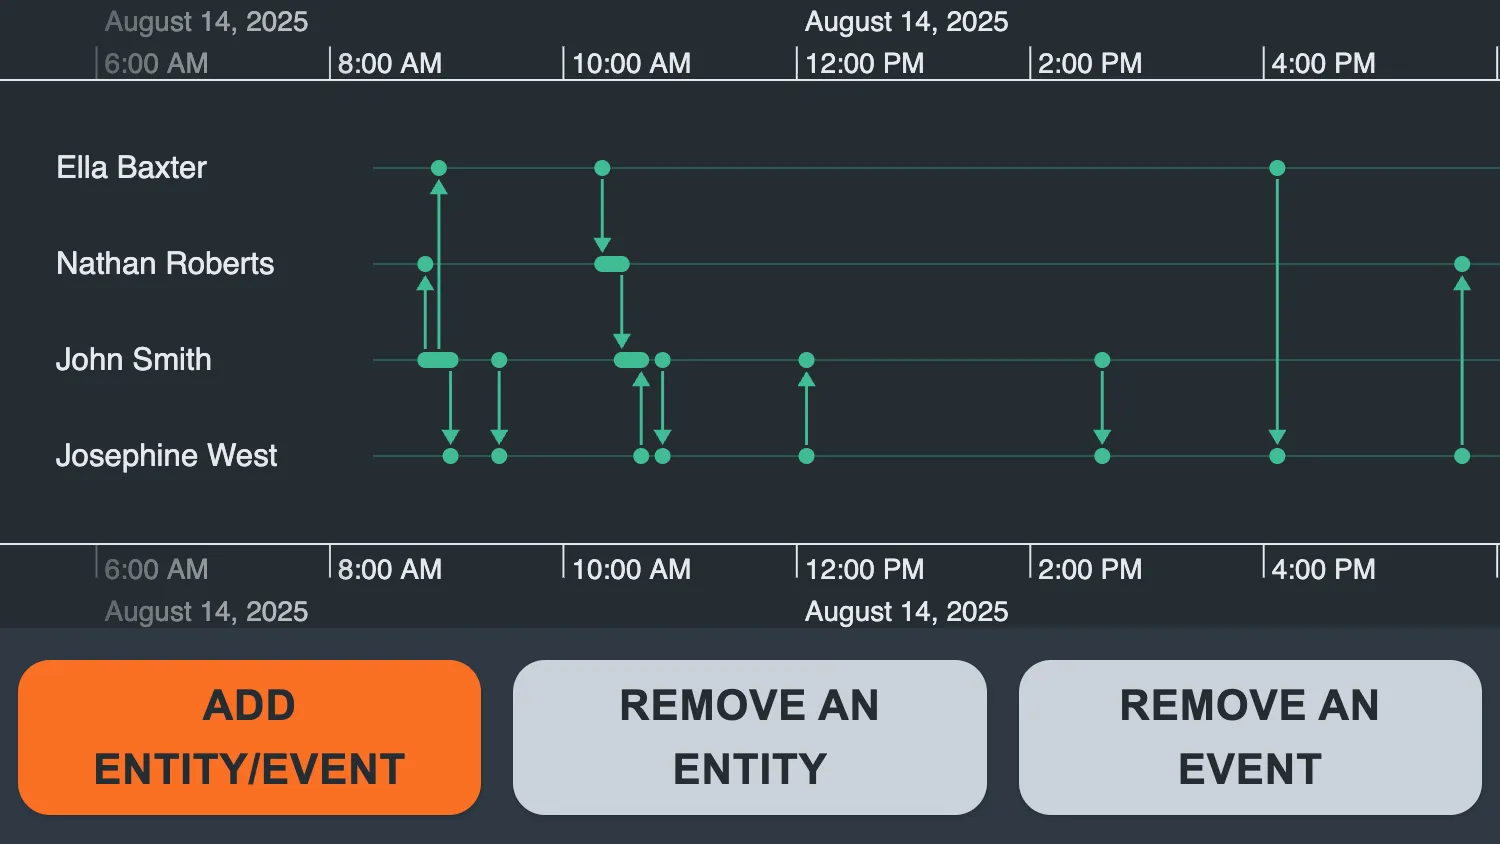
Heatmap
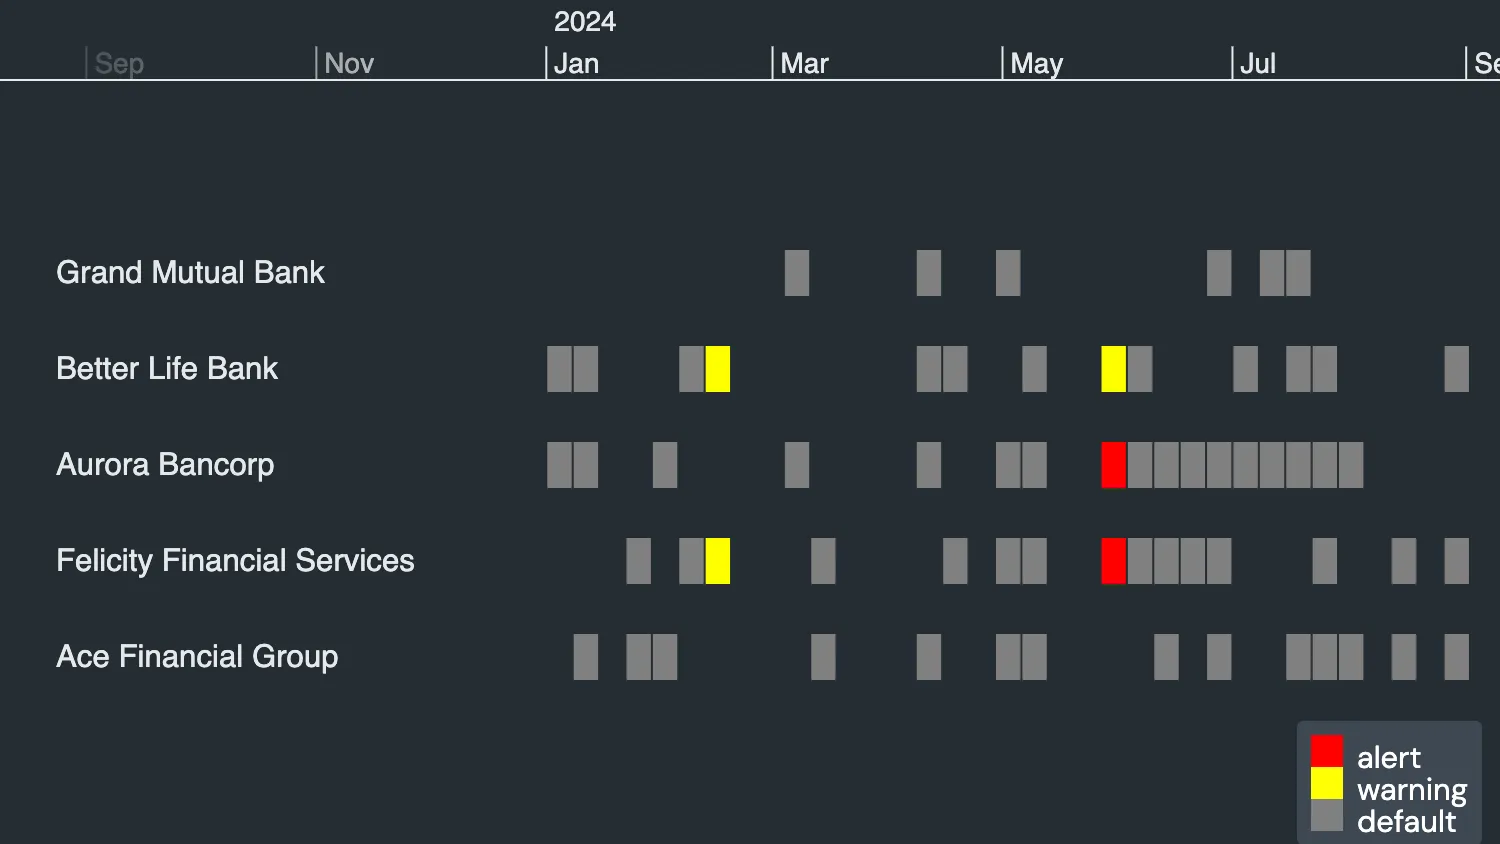
Heatmap Colors
Reveal hidden data patterns with custom color schemes.
See example
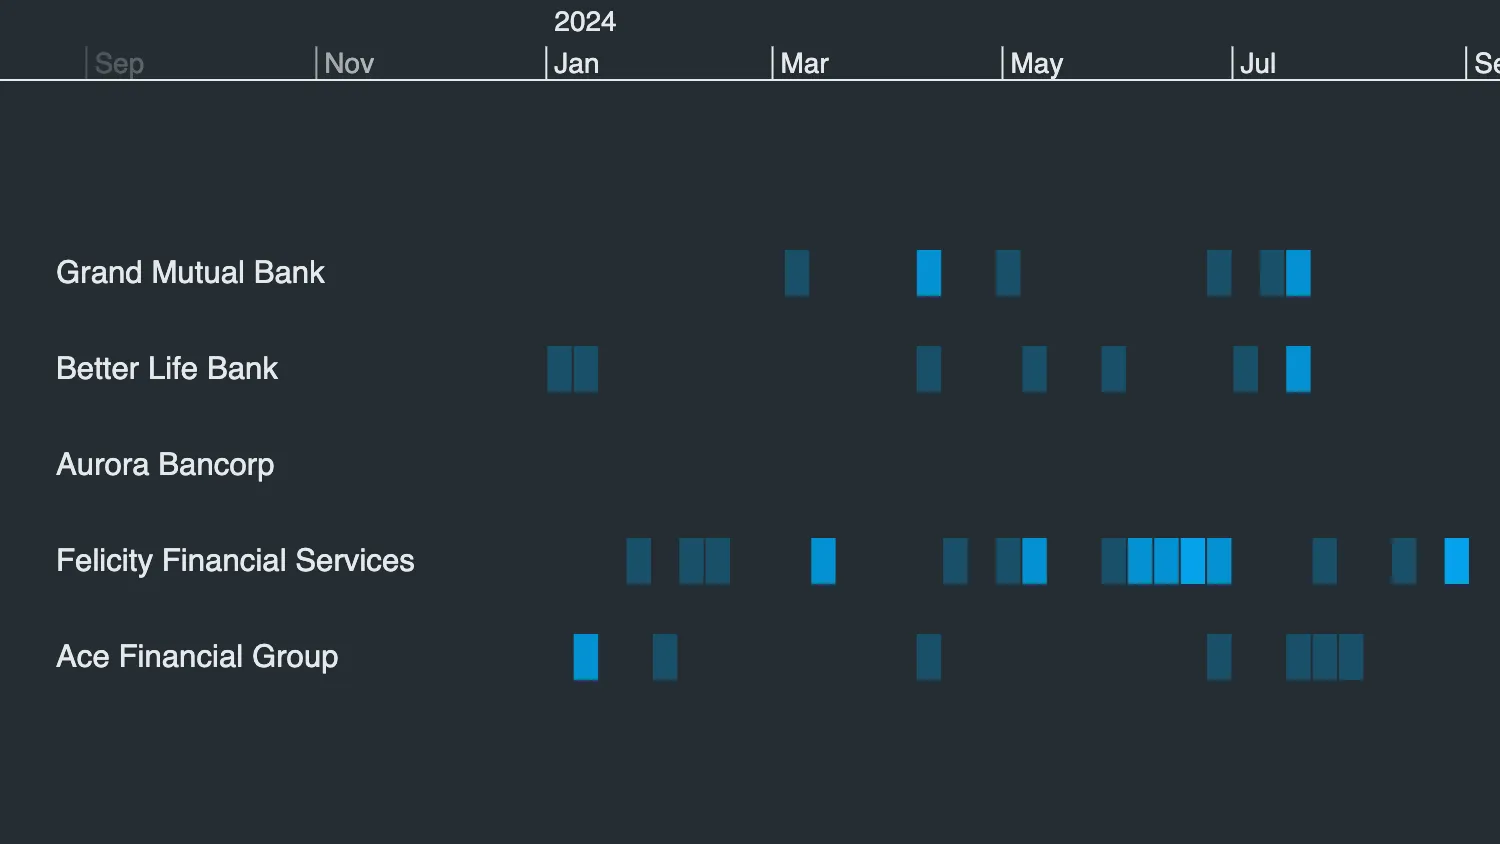
Custom Heatmaps
Customize heatmap with custom values and directions.
See example
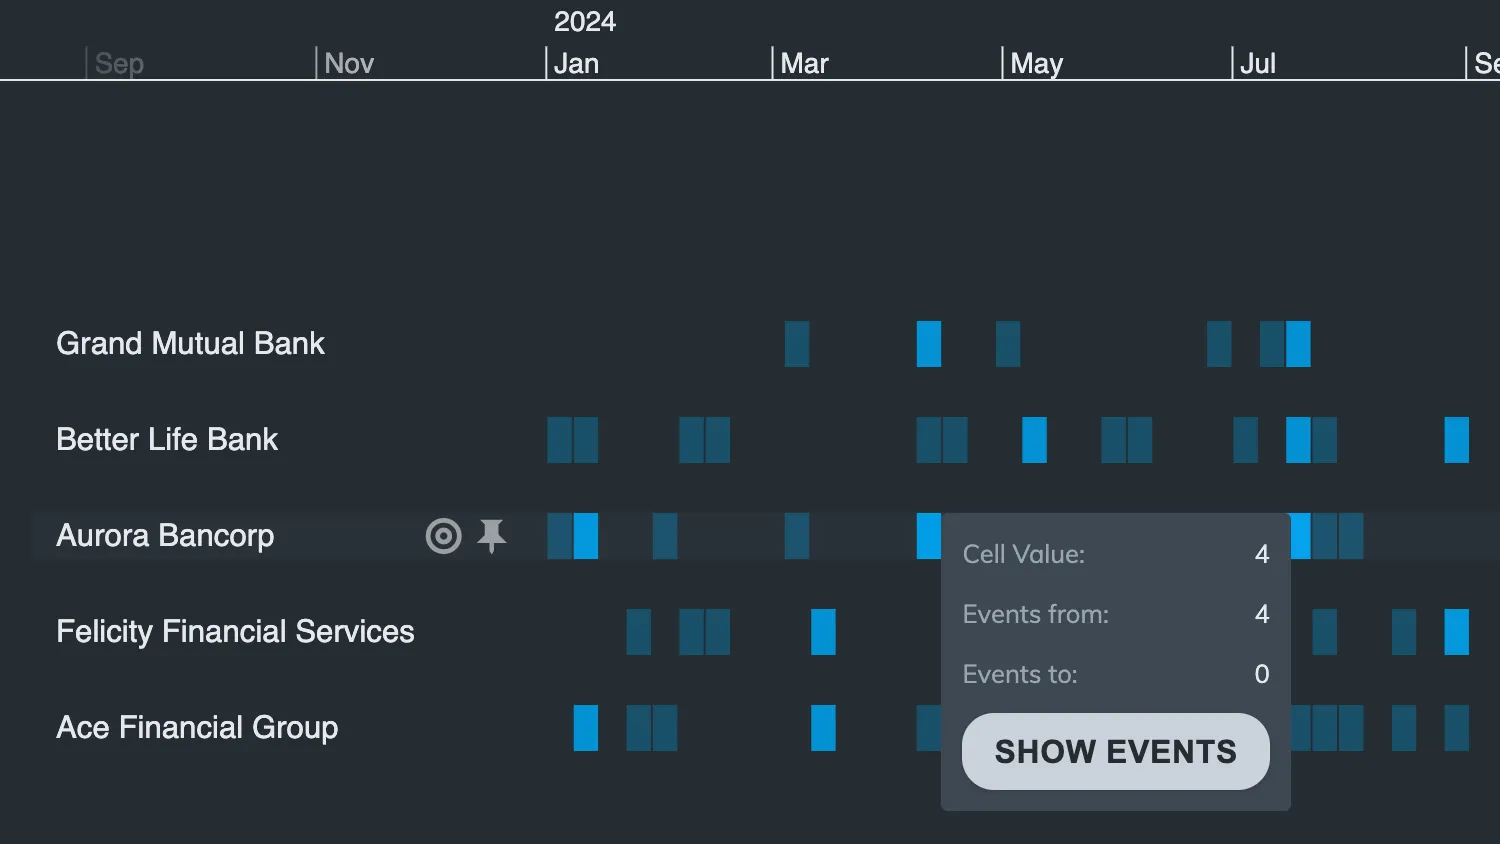
Heatmap Tooltips
Show tooltips on heatmap cells to add more context.
See example
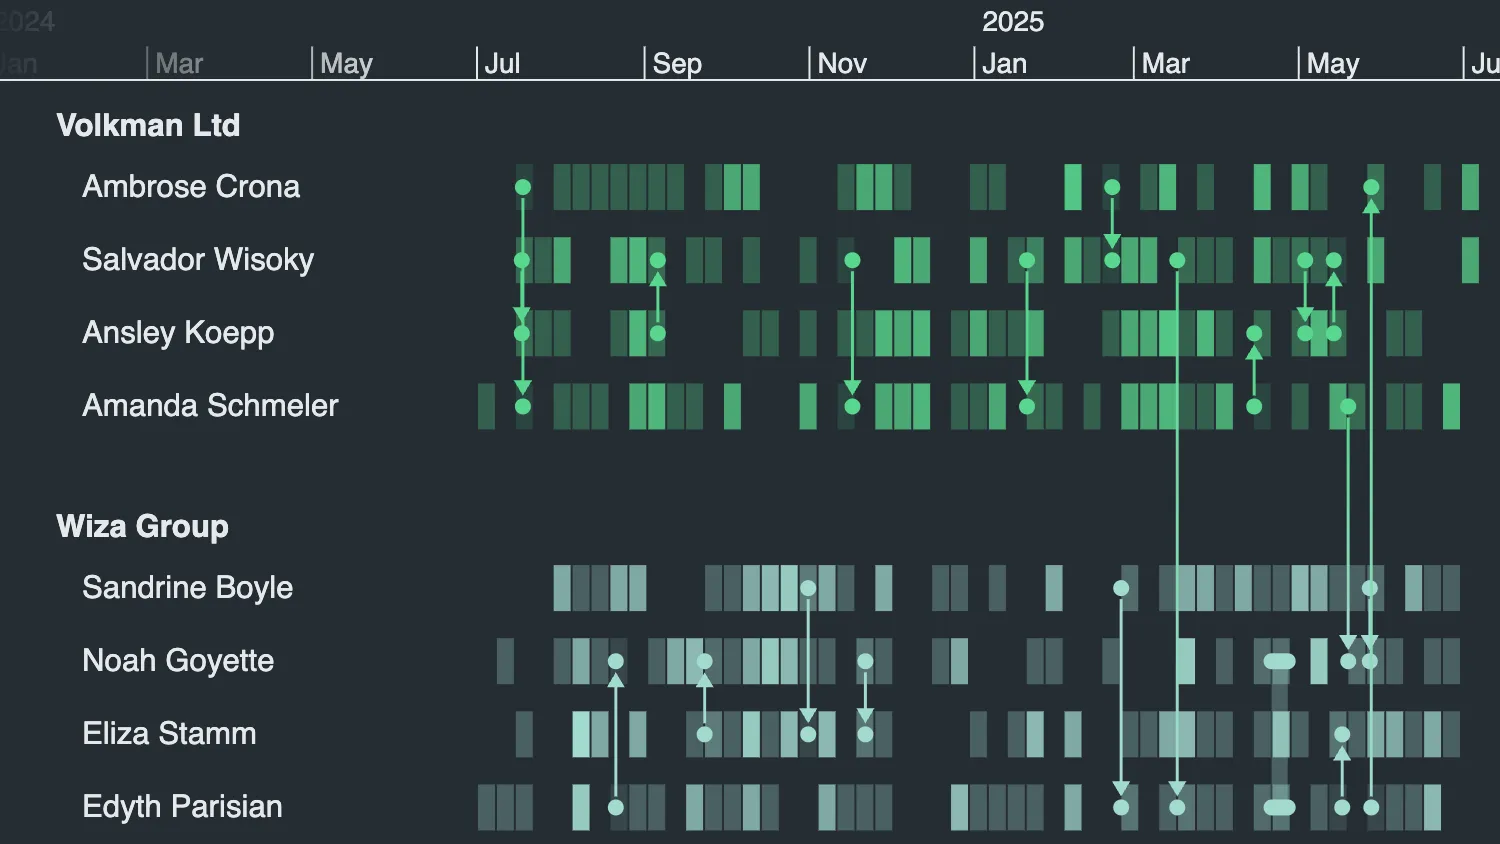
Reveal Events
Reveal particular events of interest inside heatmap cells.
See example
Time and Scales
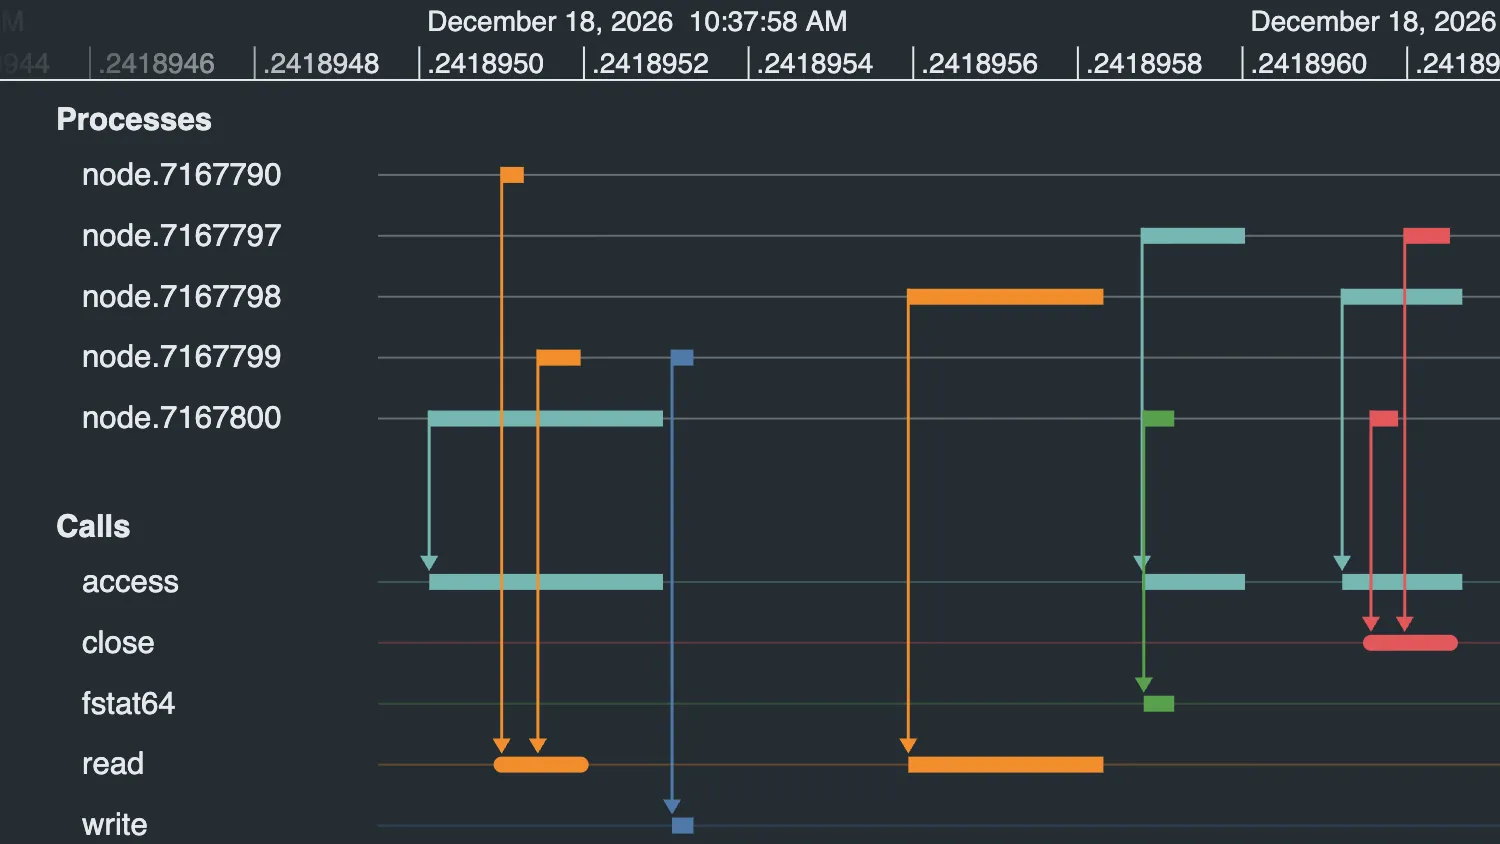
Higher Resolution Time
Visualize high-frequency data at nanosecond resolution.
See example
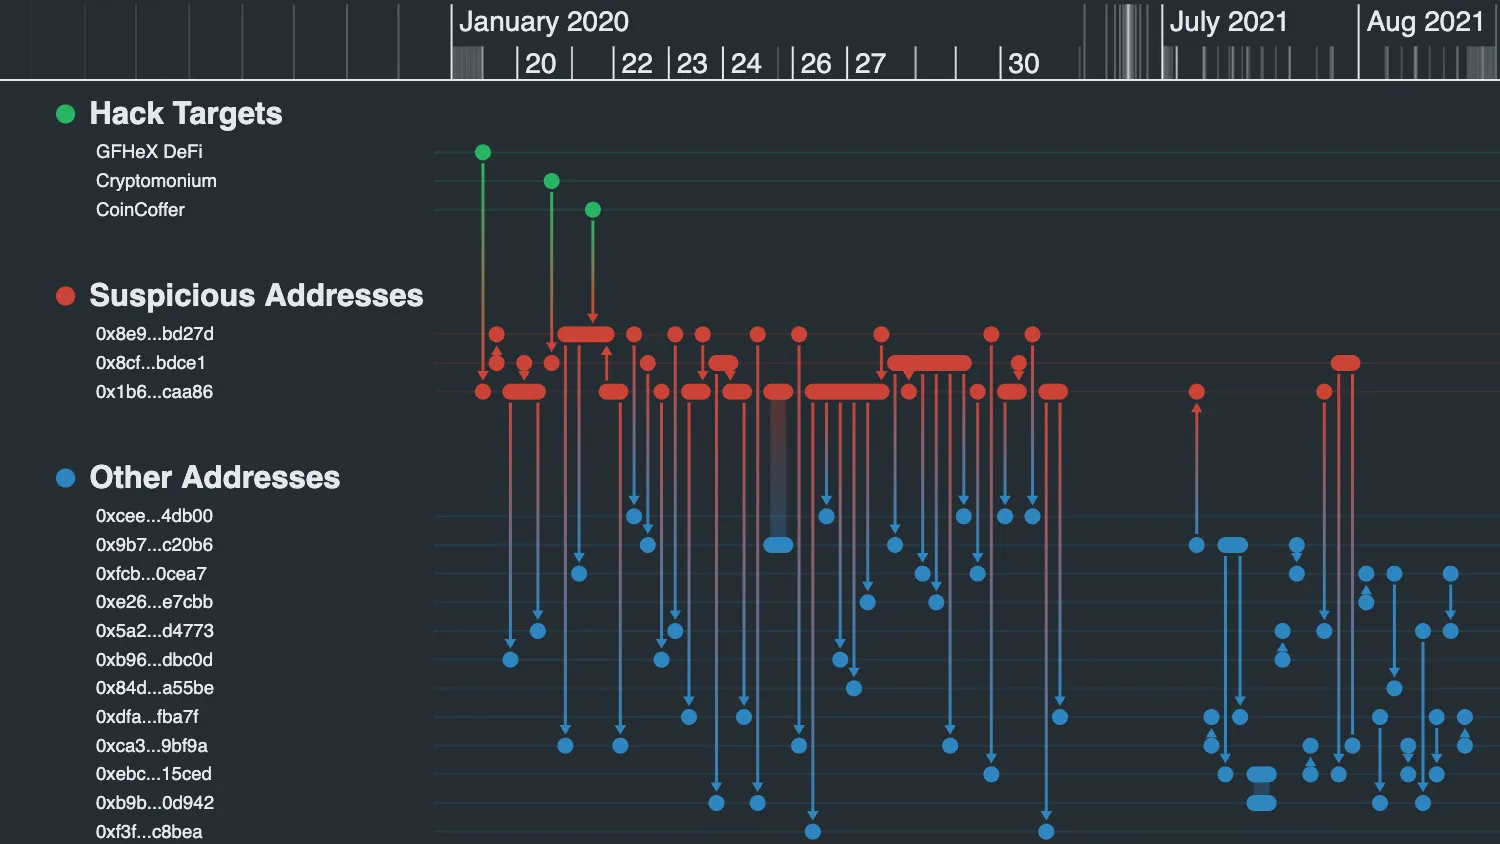
Nonlinear Scale Mode
Space events evenly to make the sequences easier to see.
See example
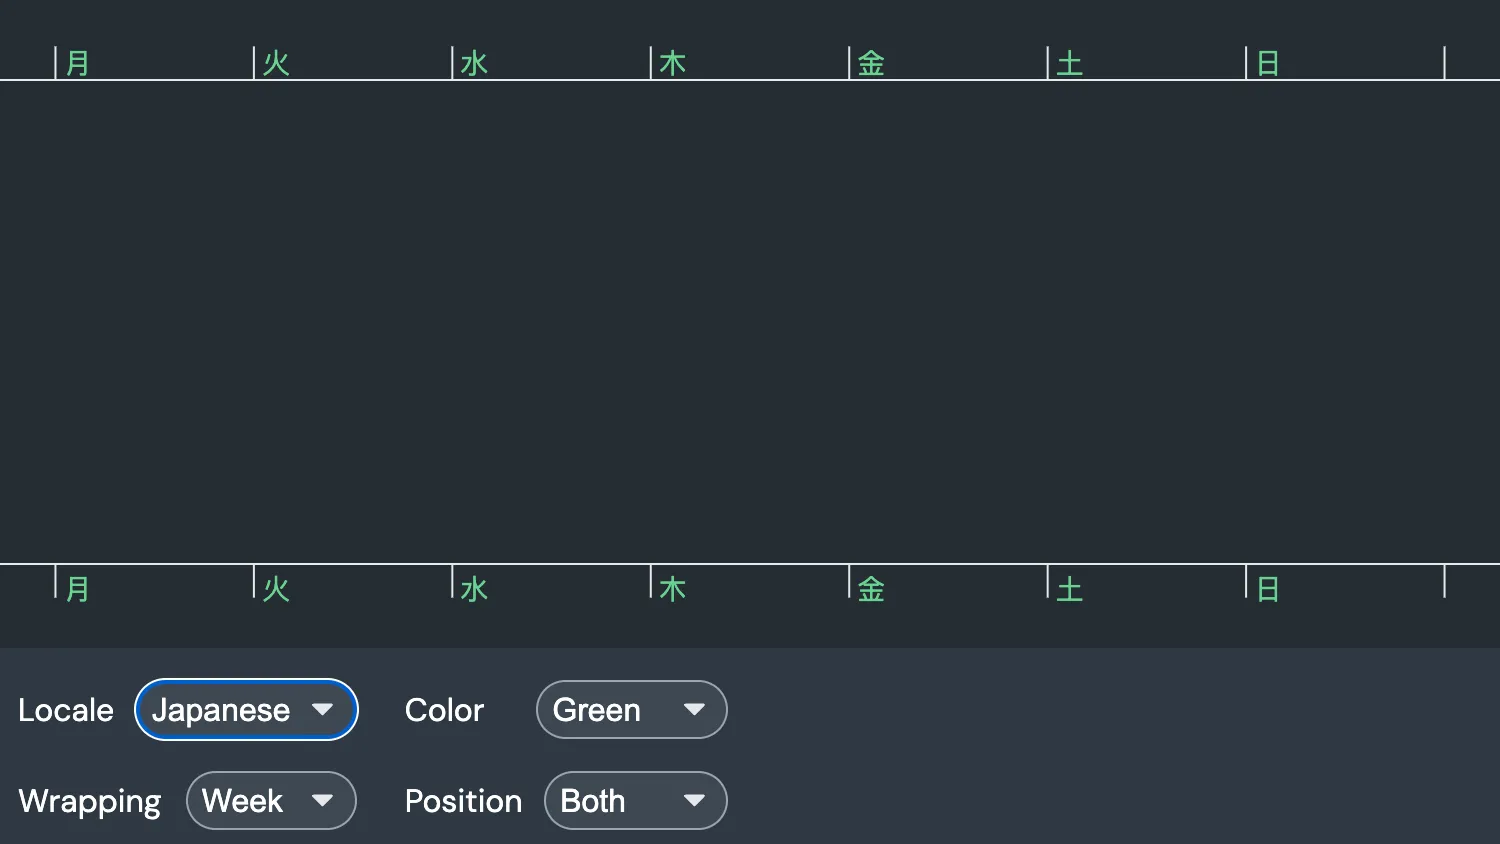
Scales Options
Customize date and time formats at each zoom level.
See example
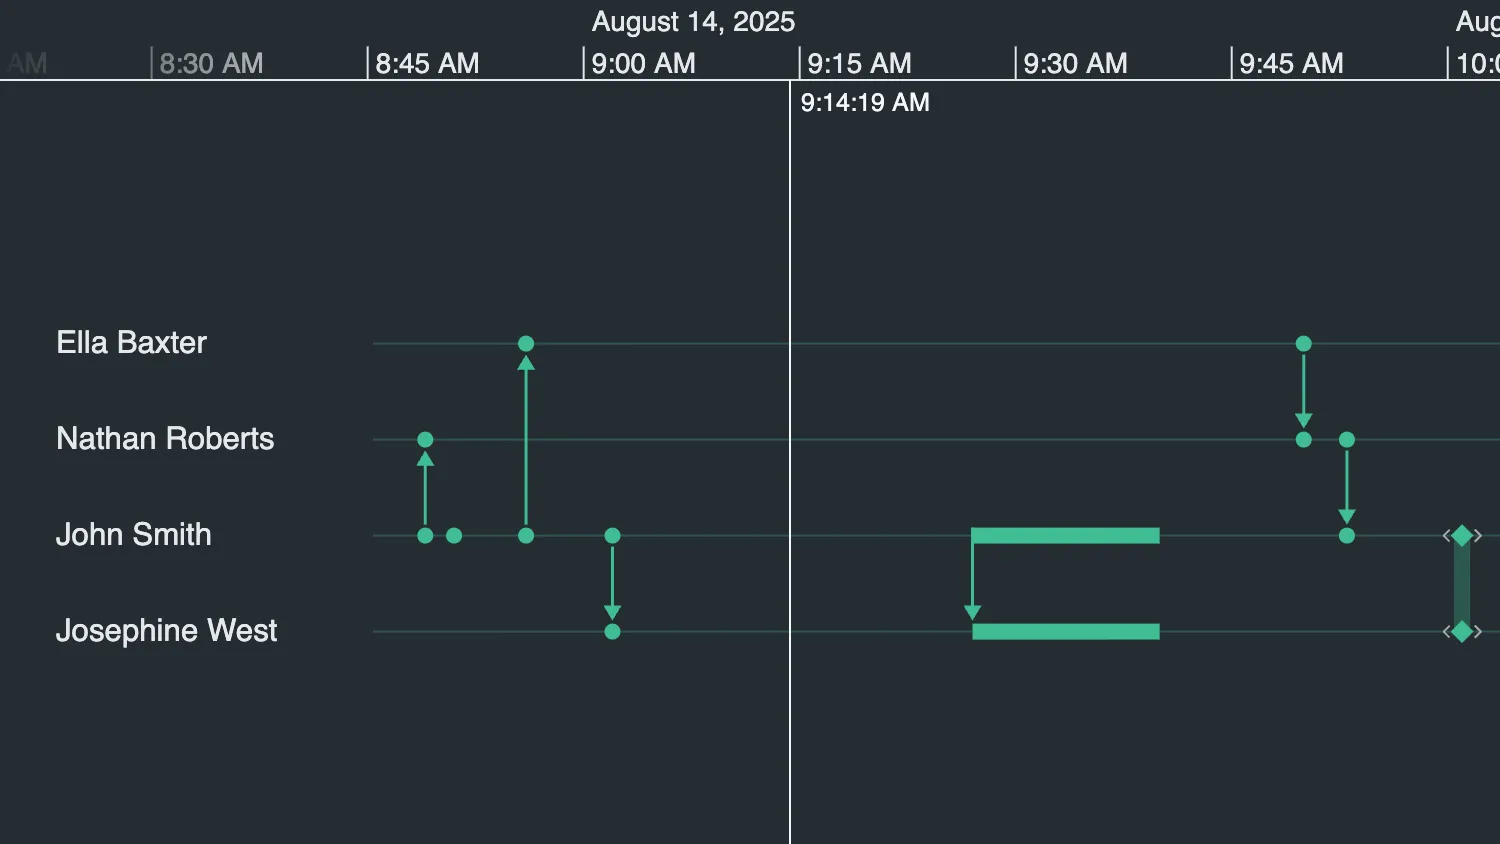
Scale Guide
Show a guide line on the timeline for reading precise times.
See example
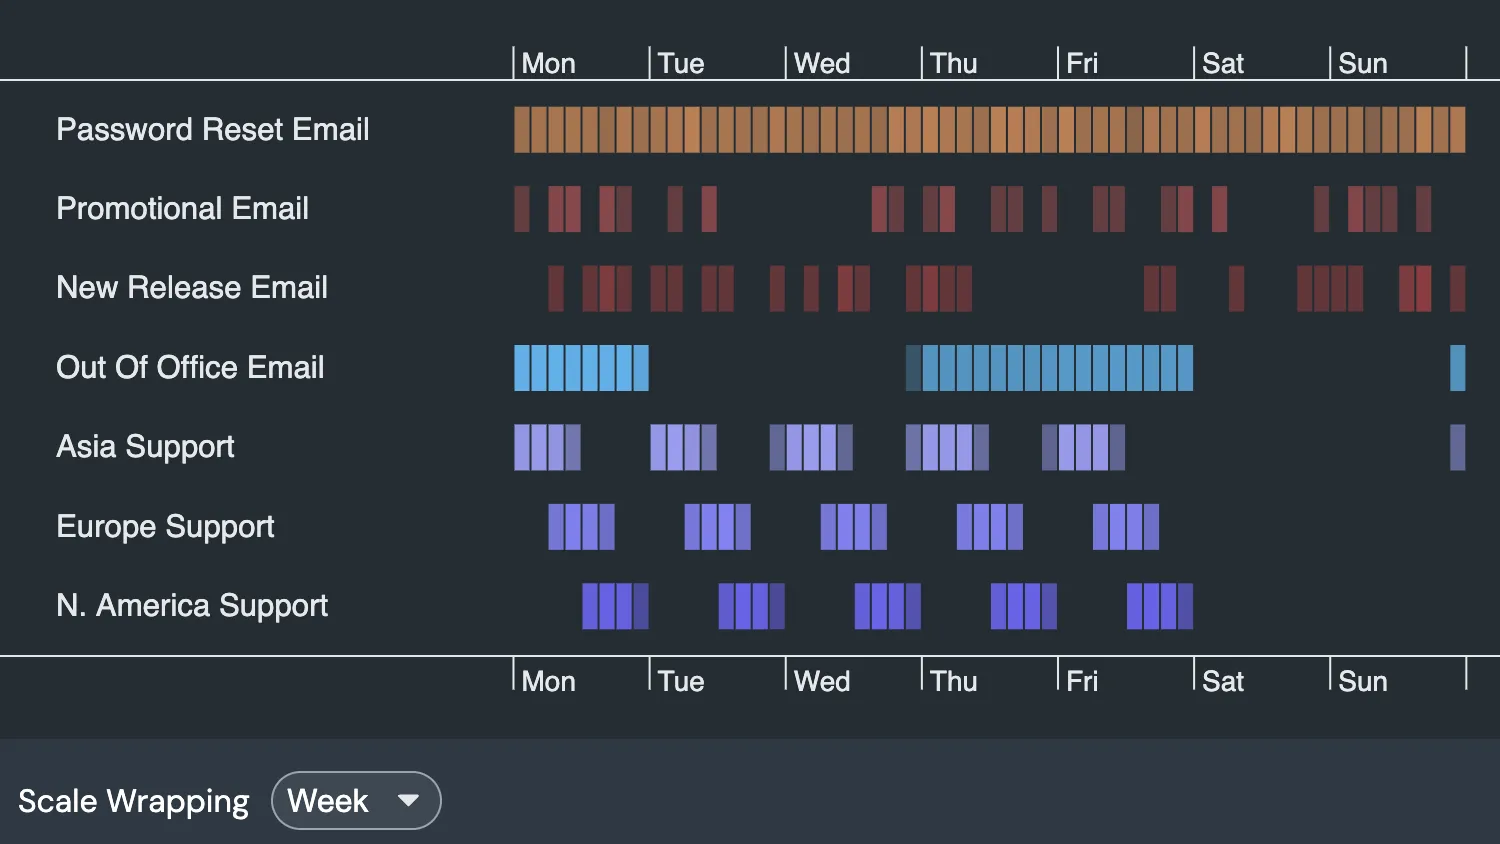
Scale Wrapping
Wrap time to a repeating scale to reveal repeated patterns.
See example
Time Series Charts
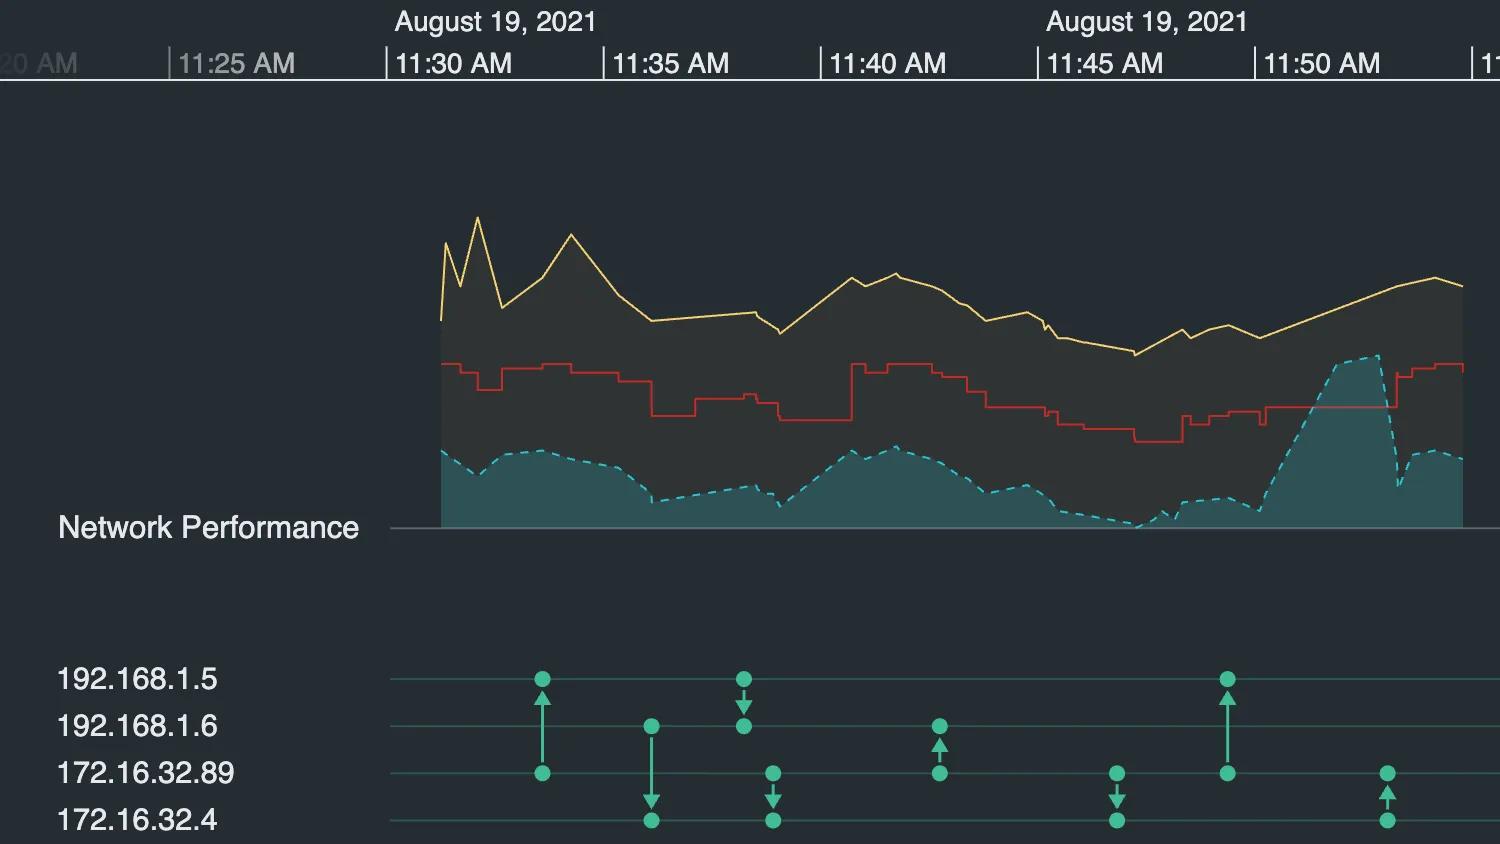
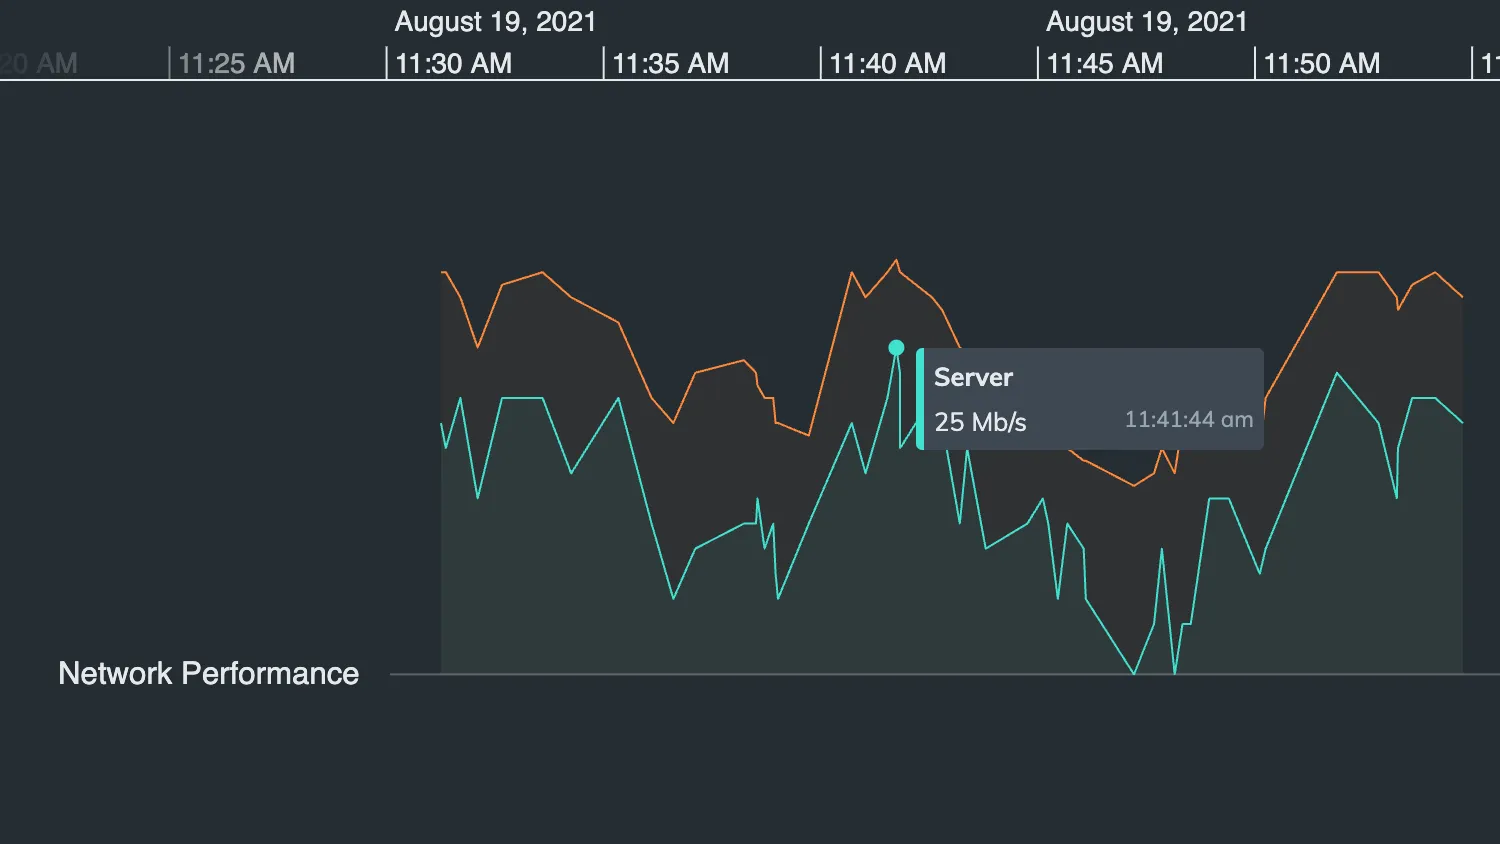
Interactions
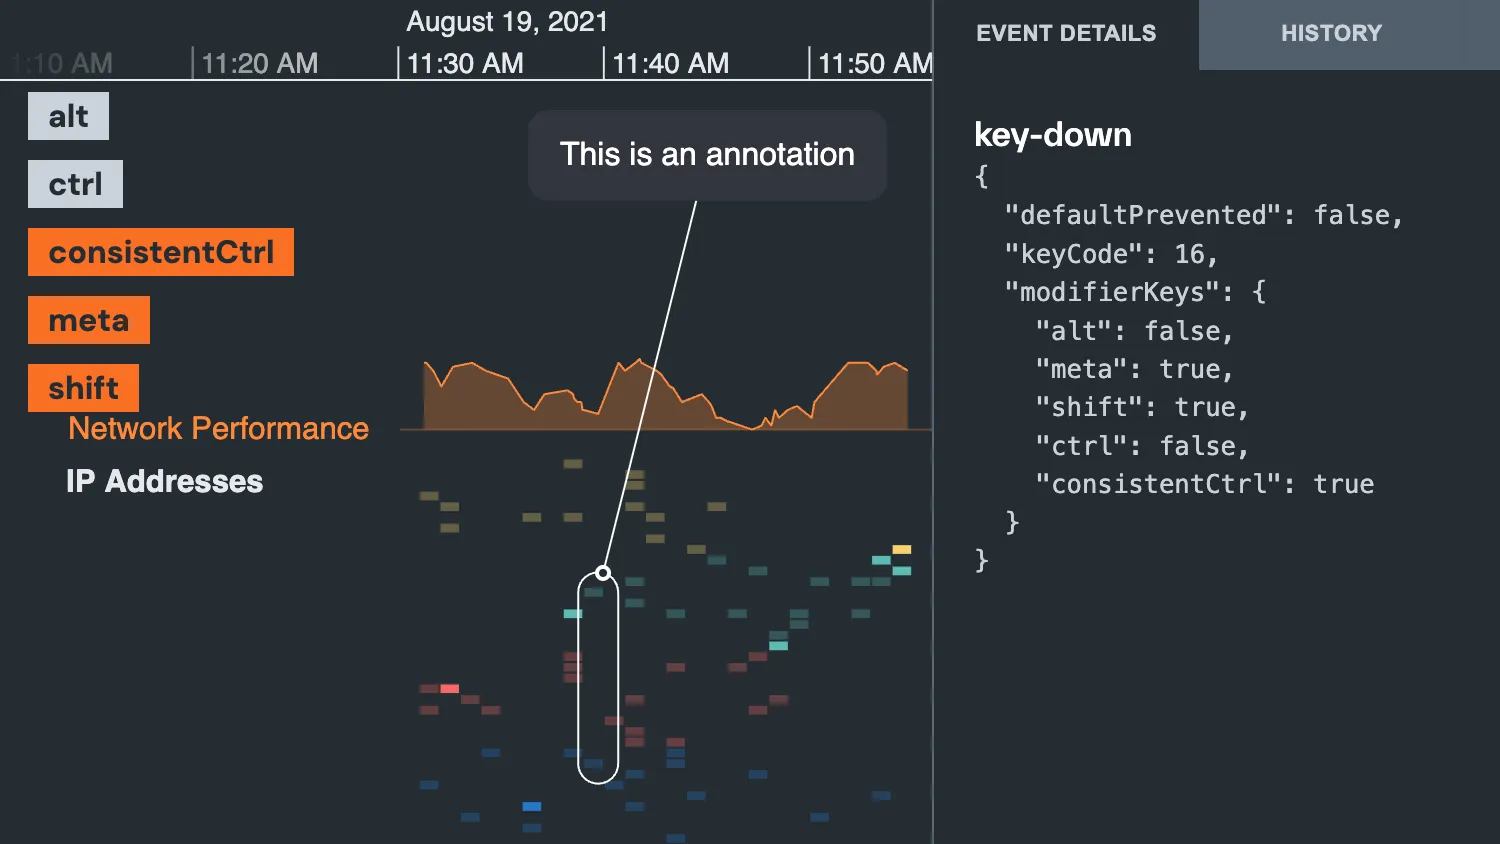
Events
Explore all pointer, keyboard, and touch events.
See example
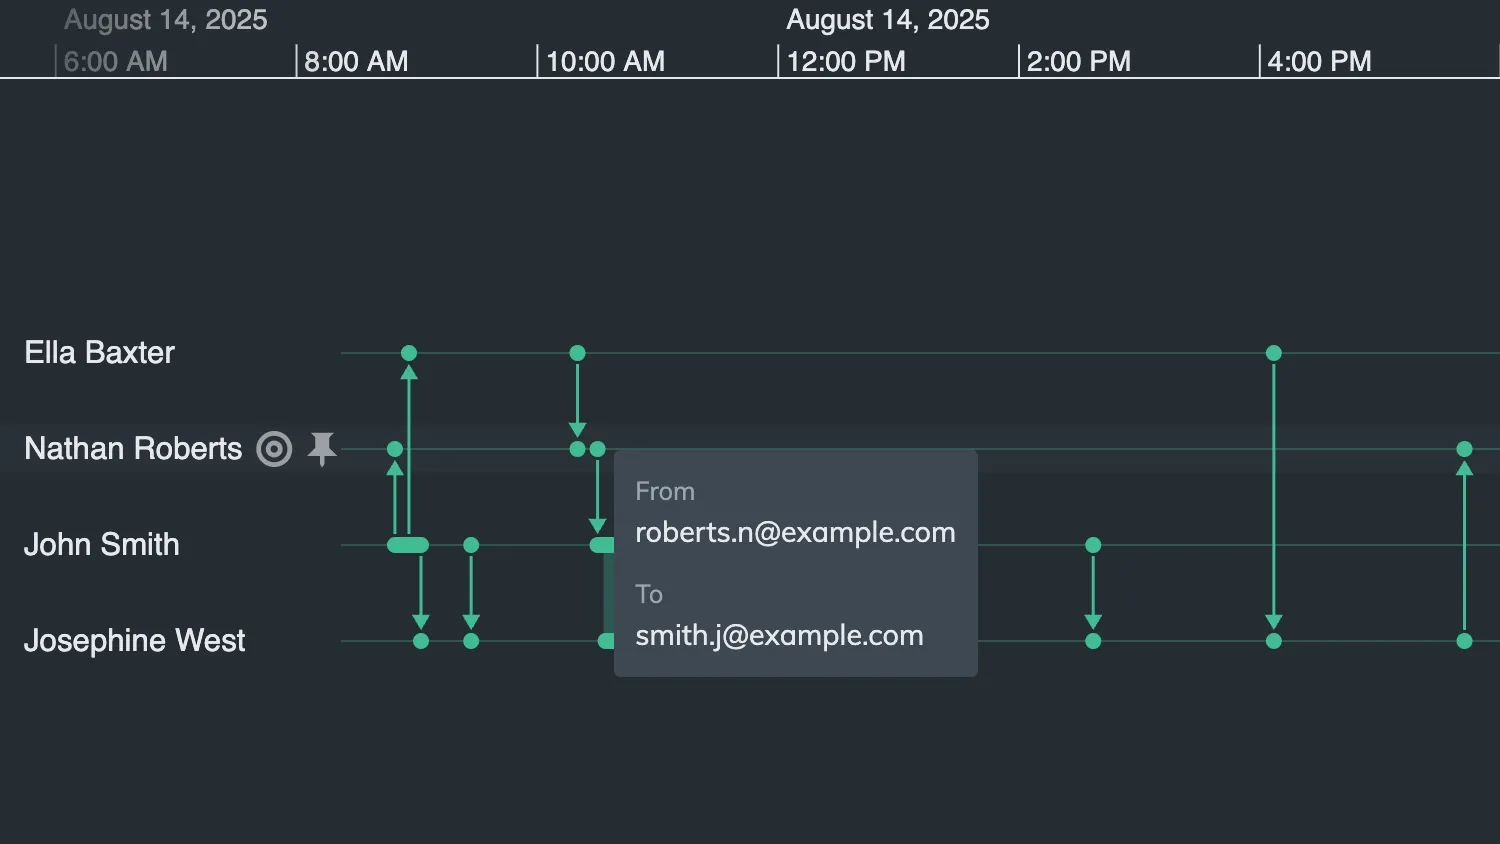
Timeline Tooltips
Show HTML tooltips by handling hover events.
See example
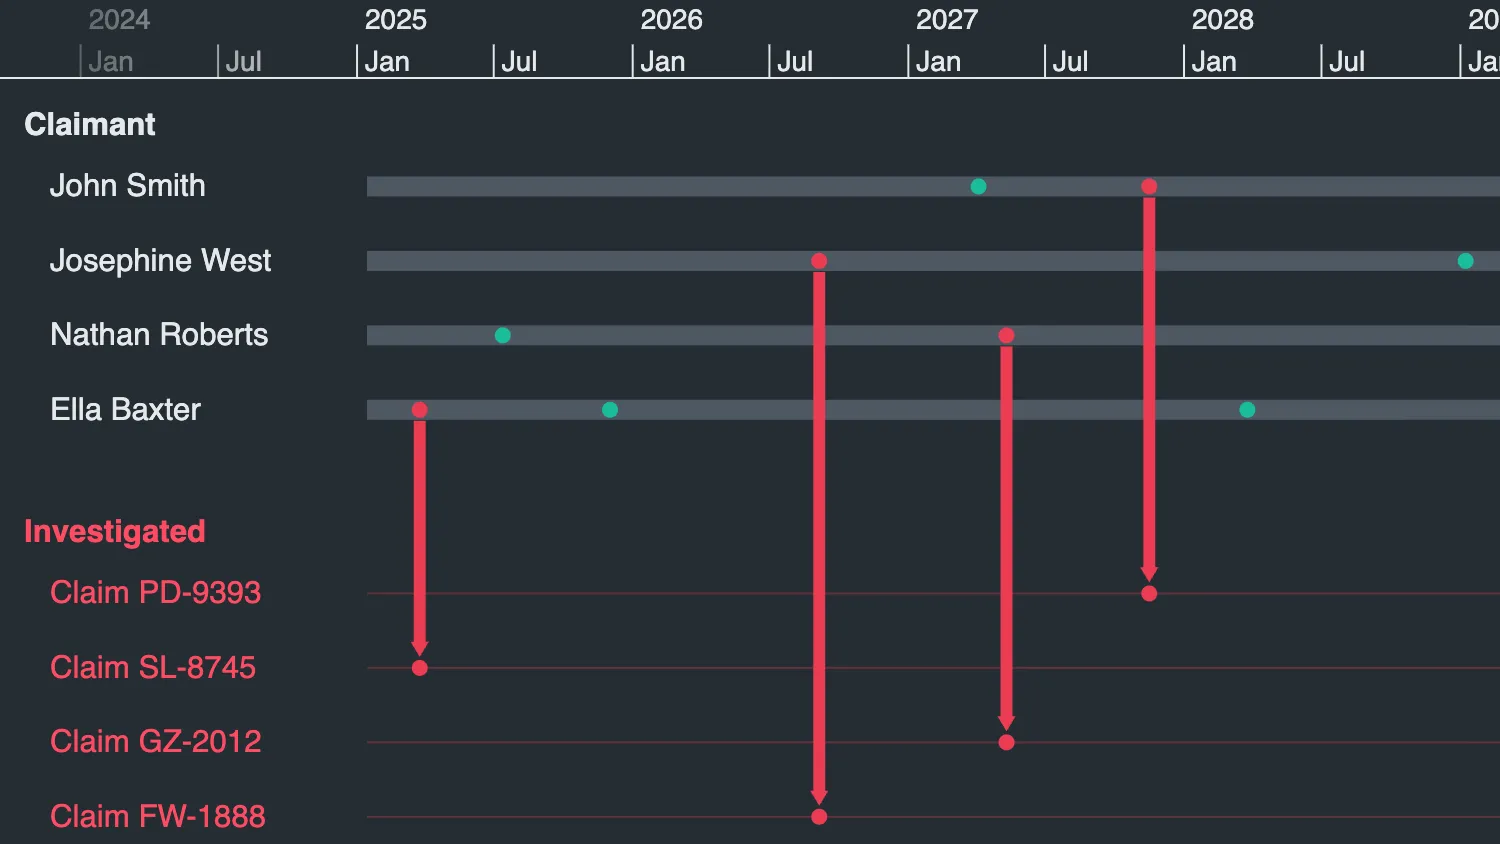
Filtering
Filter the timeline by various criteria on entities and events.
See example
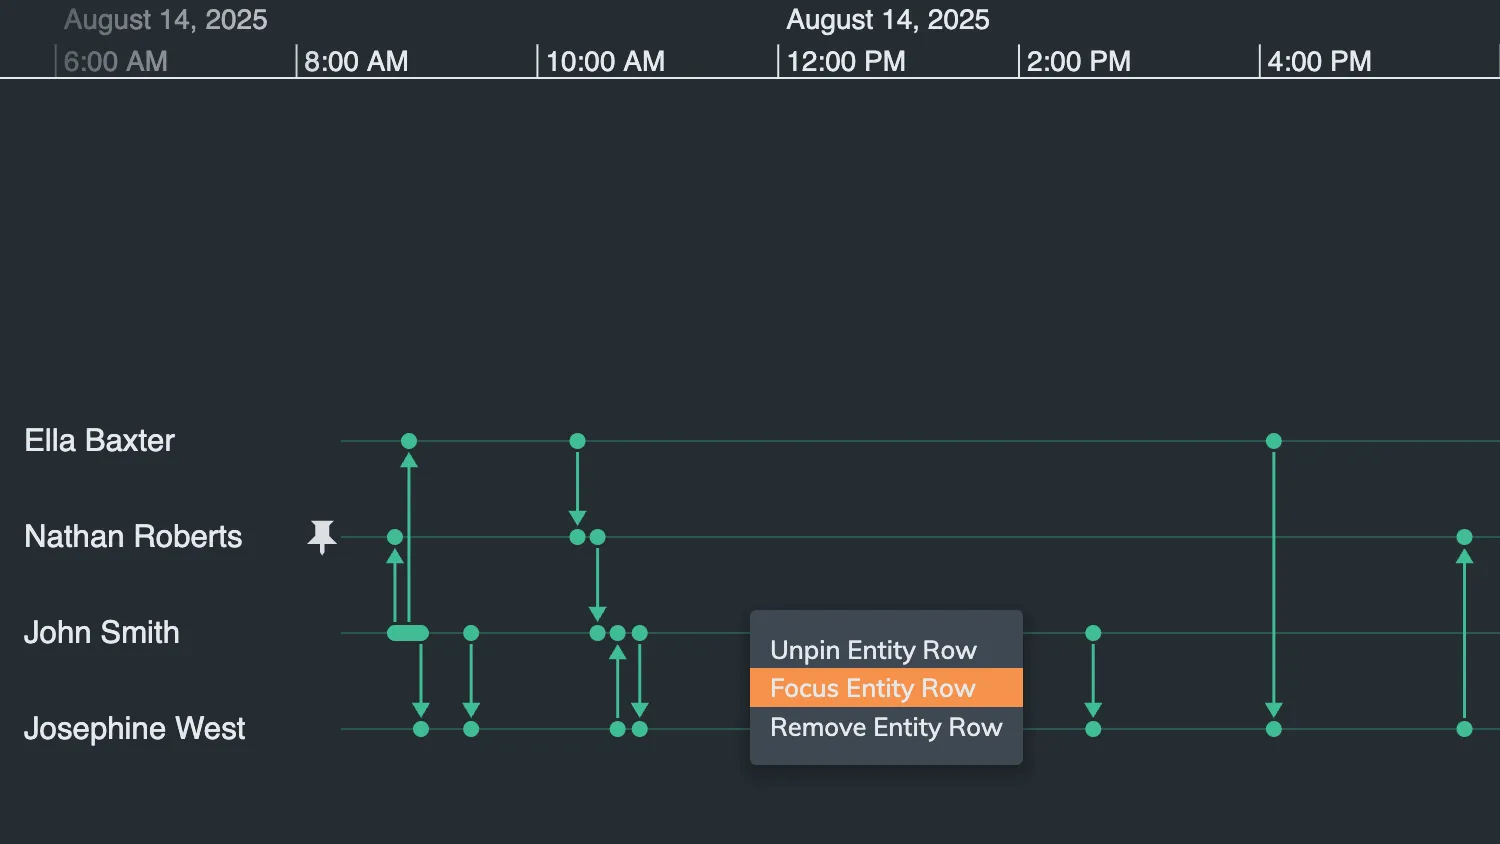
Context Menu
Add right-click context menus to the timeline.
See example
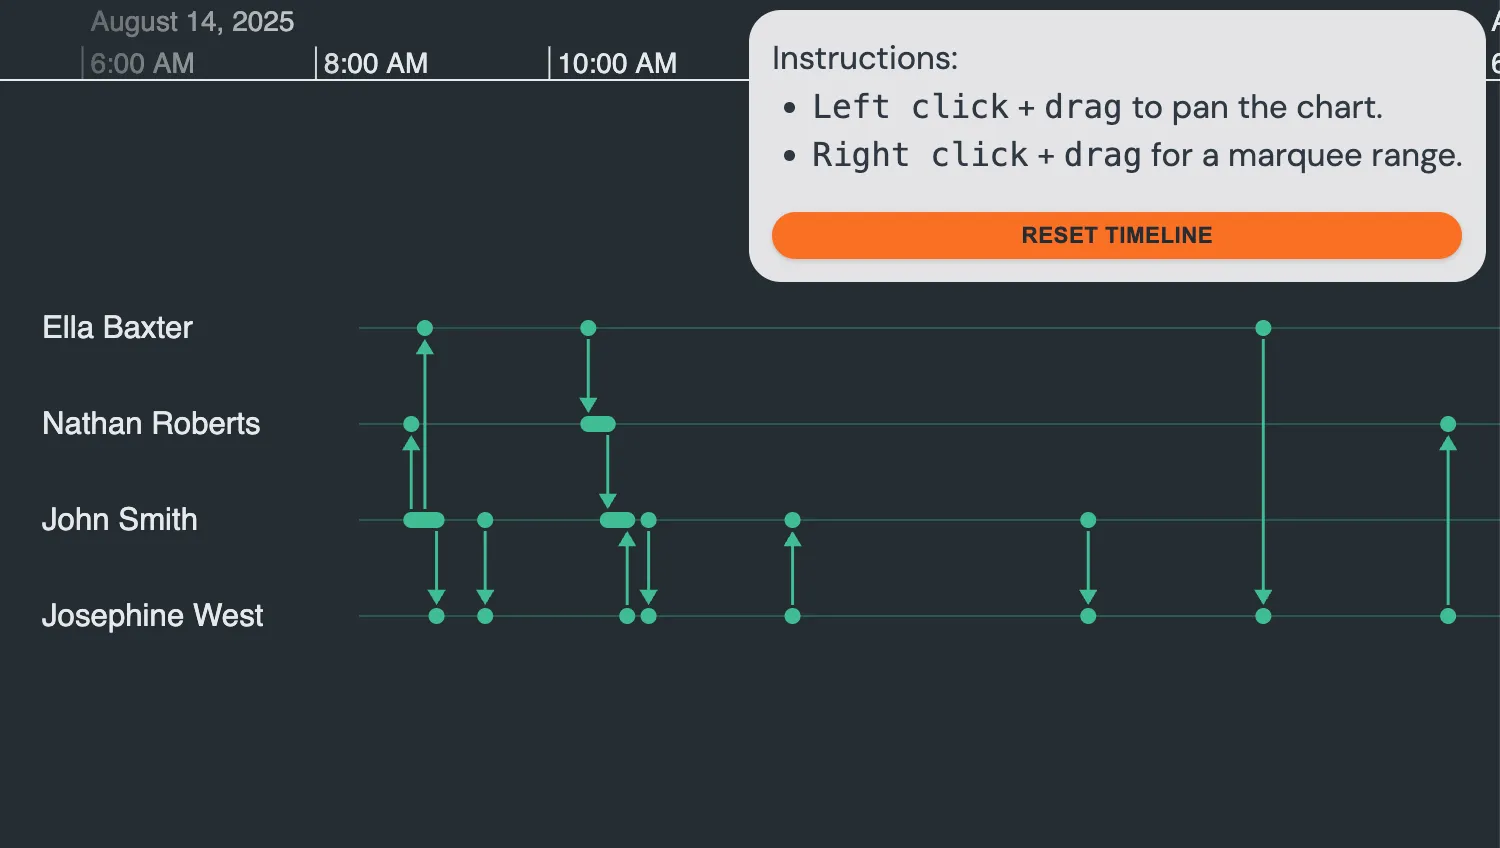
Custom Dragging
Customize dragging interactions in the timeline.
See example
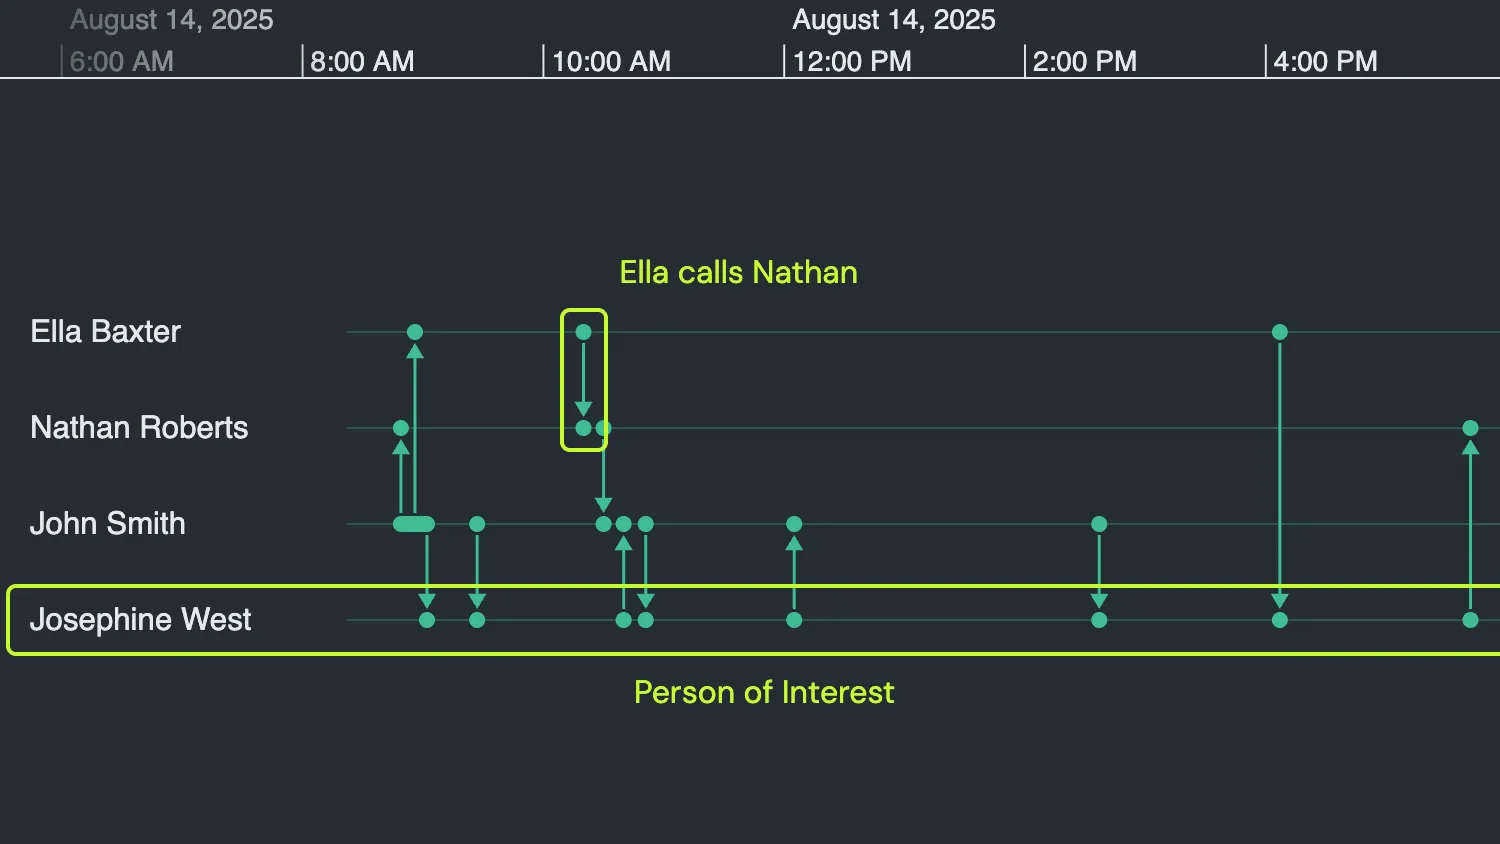
HTMLOverlays
Position HTML elements over entity and event locations.
See example
Change Event
Keep timeline state synchronized with any changes.
See example