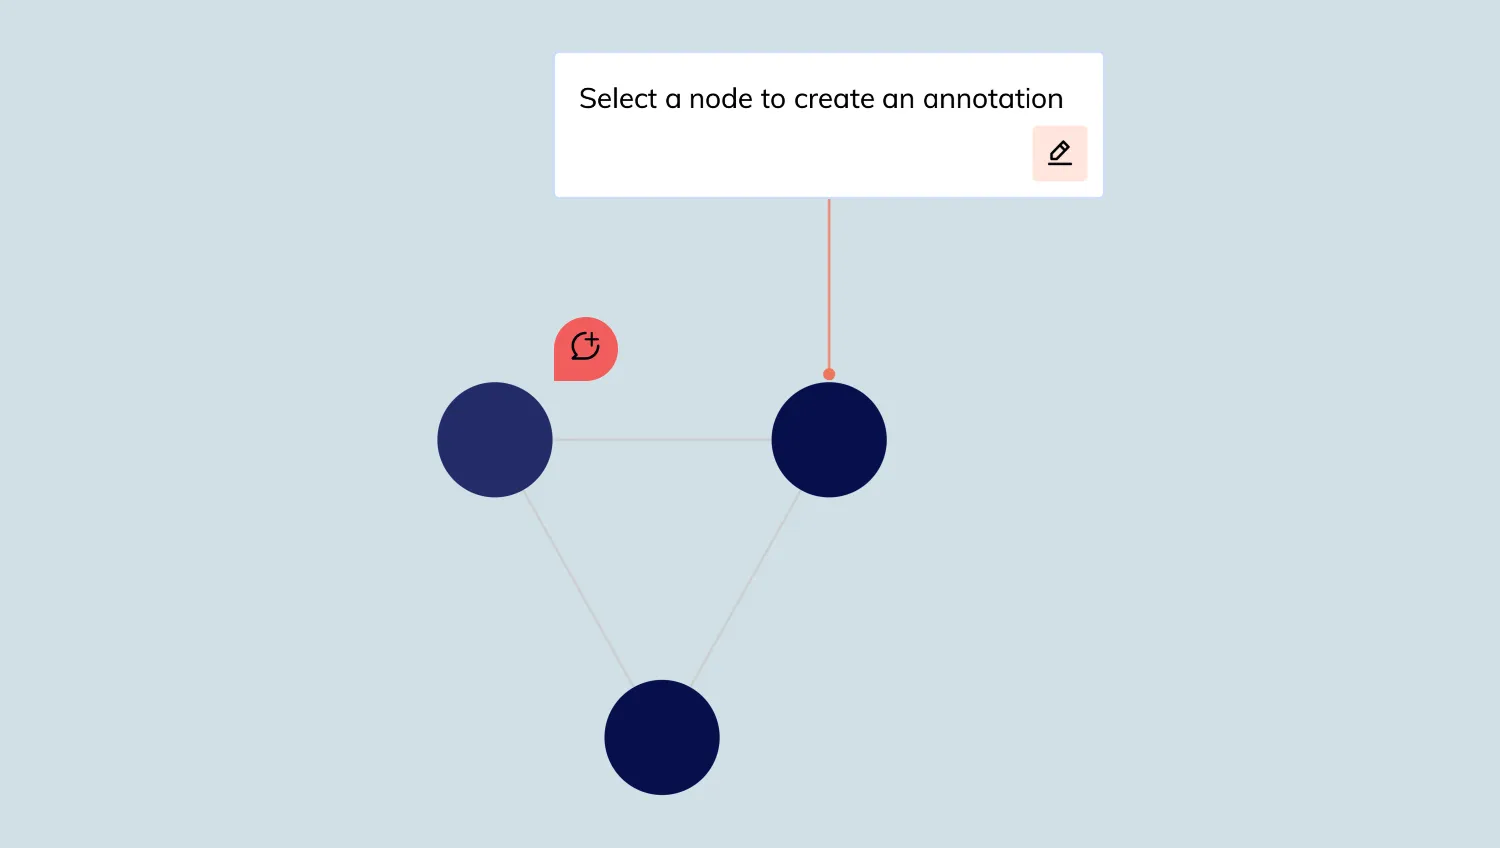
By adding annotations with their thoughts, chart users can help explain the narratives in the charts and collaborate with other users. This demo shows how to create annotations with user-editable text fields.
An annotation created on an item is overlaid with a background label t, which is passed to the chart.labelPosition() function to get the view coordinates of the background label and its parent annotation.
The returned coordinates are used to position an HTML overlay that handles creating and editing of the annotation text.
In addition, KeyLines labels are also used to add interactive elements on the annotations themselves.
Key functions used:
import KeyLines from "keylines";
import { colours, data, createAnnotation } from "./data.js";

let chart;
let annotationIdCount = 1;
let nodeIdWithAnnotateButton = null;
let annotationBeingUpdated = null;
let hoveredAnnotationId = null;
let annotationToolbarShown = false;
const editLabelIndex = 2;
const chartContainer = document.getElementById("klchart");
const annotateButton = document.getElementById("annotate-button");
const annotationPreview = document.getElementById("annotation-preview");
const annotationTextArea = document.getElementById("annotation-text");
const textMeasurementSpan = document.getElementById("text-measure");

async function annotate() {
  const annotationSubjects = getSelectedNodeIds();
  // Clear chart selection when an annotation is created
  chart.selection([]);
  hideAnnotateButton();
  // Reset the pointer cursor override from the edit label
  setCursor(null);

  // Add the initial annotation to the chart to help with overlay positioning
  annotationBeingUpdated = createAnnotation(
    `a${++annotationIdCount}`,
    annotationSubjects,
  );
  await chart.merge(annotationBeingUpdated);

  // Ensure the new annotations and its subjects are in view if required
  await fitViewToAnnotation();
  placeAnnotationPreview();
  setupAnnotationPreview();
}

async function finalizeAnnotation(action) {
  if (annotationBeingUpdated === null) return;
  if (action === undefined || action === "dismiss") {
    const annotationText = annotationBeingUpdated.t[1].t;
    action = annotationText === "" ? "delete" : "dismiss";
  }
  if (action === "delete") {
    chart.removeItem(annotationBeingUpdated.id);
  } else {
    const windowSelection = window.getSelection();
    // Clear text highlighting
    if (windowSelection.rangeCount !== 0) {
      windowSelection.removeAllRanges();
    }
  }
  annotationPreview.style.display = "none";
  annotationBeingUpdated = null;
}

async function initialiseAnnotationEdit() {
  chart.selection([]);
  placeAnnotationPreview();
  // Preconfigure the preview element for the annotation we are editing
  setupAnnotationPreview();
}

// Determines whether an annotation is currently in view
function isAnnotationOutOfBounds(id) {
  const annotationPosition = chart.labelPosition(id, 0);
  const chartContainerBounds = chartContainer.getBoundingClientRect();
  const outOfVerticalBounds =
    annotationPosition.y1 <= 0 ||
    annotationPosition.y2 >= chartContainerBounds.height;
  const outOfHorizontalBounds =
    annotationPosition.x1 <= 0 ||
    annotationPosition.x2 >= chartContainerBounds.width;
  return outOfVerticalBounds || outOfHorizontalBounds;
}

// Fits the view to the annotation and its subjects if required
async function fitViewToAnnotation() {
  // Check whether we need to adjust the view to allow the annotation space
  if (isAnnotationOutOfBounds(annotationBeingUpdated.id)) {
    await chart.zoom("fit", {
      ids: [
        annotationBeingUpdated.id,
        ...annotationBeingUpdated.subjects.map((id) => id),
      ],
      animate: true,
      time: 400,
    });
  }
}

function getSelectedNodeIds() {
  return chart.selection().filter((id) => chart.getItem(id).type === "node");
}

function getLatestSelectedNodeId() {
  const selectedNodeIds = getSelectedNodeIds();
  return selectedNodeIds[selectedNodeIds.length - 1];
}

/* Positions the annotate button based on the current
   chart zoom level and attached node position */
function updateAnnotateButtonPosition() {
  const nodeBaseSize = 27;
  const node = chart.getItem(nodeIdWithAnnotateButton);
  const { x, y } = chart.viewCoordinates(node.x, node.y);
  const { zoom } = chart.viewOptions();
  const nodeSize = nodeBaseSize * zoom;
  annotateButton.style.left = `${x + nodeSize}px`;
  annotateButton.style.top = `${y - annotateButton.clientHeight - nodeSize}px`;
}

// Hides / shows the edit tool bar on the annotation preview
function toggleAnnotationToolbar(show) {
  const annotationToolbar = document.getElementById("annotation-toolbar");
  const ghostDoneButton = document.getElementById("ghost-done-button");
  const toolbarDisplay = show ? "flex" : "none";
  const ghostDoneButtonDisplay = show ? "none" : "block";
  annotationToolbar.style.display = toolbarDisplay;
  ghostDoneButton.style.display = ghostDoneButtonDisplay;
  annotationToolbarShown = show;
}

function placeAnnotationPreview() {
  // Get the position of the annotation's background label to place the preview
  const annotationPosition = chart.labelPosition(annotationBeingUpdated.id, 0);
  annotationPreview.style.top = `${annotationPosition.y1}px`;
  annotationPreview.style.left = `${annotationPosition.x1}px`;
  annotationPreview.style.display = "flex";
  annotationTextArea.focus();
}

function updateTextAreaHeight() {
  annotationTextArea.style.height = "auto";
  annotationTextArea.style.height = `${annotationTextArea.scrollHeight}px`;
}

/* KeyLines doesn't wrap strings without spaces so add new lines manually
   to handle long words which exceed the annotation body width */
function wrapLongWord(word) {
  let wrappedText = "";
  let tempLine = "";
  for (const char of word) {
    // Add characters to the measurement span incrementally to check if the word exceeds the annotation bounds
    textMeasurementSpan.textContent = `${tempLine}${char}`;
    if (
      textMeasurementSpan.getBoundingClientRect().width >
      annotationTextArea.clientWidth
    ) {
      wrappedText += `${tempLine}\n`;
      tempLine = char;
    } else {
      tempLine += char;
    }
  }
  // Add remaining part of word
  wrappedText += tempLine;
  return wrappedText;
}

function formatAnnotationInputText(string) {
  let formattedText = "";
  const words = string.split(" ");
  words.forEach((word) => {
    textMeasurementSpan.textContent = word;
    /* Use the measurement span to check if a word doesn't fit on a single line in the text area
           if it does wrap it across multiple lines */
    if (
      textMeasurementSpan.getBoundingClientRect().width >
      annotationTextArea.clientWidth
    ) {
      formattedText += wrapLongWord(word) + " ";
    } else {
      formattedText += word + " ";
    }
  });
  return formattedText.trim();
}

/* Updates the chart annotation text & height properties to ensure the preview
   element can be synced to the correct position */
async function updateAnnotationTextAndHeight(text, height) {
  const annotationBeingUpdatedLabels = annotationBeingUpdated.t;
  annotationBeingUpdatedLabels[1].t = text;
  await chart.setProperties({
    id: annotationBeingUpdated.id,
    t: annotationBeingUpdatedLabels,
    h: height,
  });
}

async function onAnnotationInput() {
  // Remove any trailing whitespaces and new lines (\n) that may have been added from previous long words
  const cleanTextInput = annotationTextArea.value.replace(/\n/g, "").trim();
  const cleanTextLength = cleanTextInput.length;
  const showToolbar = cleanTextLength > 0 && !annotationToolbarShown;
  // Ensure annotation preview height grows / shrinks with the text input
  updateTextAreaHeight();

  if (showToolbar) {
    toggleAnnotationToolbar(true);
  } else if (annotationToolbarShown && cleanTextLength === 0) {
    // If we only have white space hide the toolbar
    toggleAnnotationToolbar(false);
  }

  // Format text so long words are wrapped correctly before updating chart annotation text
  const formattedText = formatAnnotationInputText(cleanTextInput);
  // Update the chart annotation text & height so we can position the preview
  await updateAnnotationTextAndHeight(
    formattedText,
    annotationPreview.offsetHeight,
  );
  // Sync the preview overlay position with the chart annotation position
  placeAnnotationPreview();
}

async function onAnnotationKeyDown(e) {
  const { key } = e;
  if (annotationBeingUpdated !== null) {
    if (key === "Escape") {
      finalizeAnnotation();
    }
    if (key === "Enter") {
      // Don't create new lines for enter
      e.preventDefault();
      await finalizeAnnotation("dismiss");
    }
  }
}

// Sets up the initial state for the preview based on the annotation being edited
function setupAnnotationPreview() {
  const { t } = annotationBeingUpdated;
  const annotationText = t[1].t;
  annotationTextArea.value = annotationText;
  toggleAnnotationToolbar(annotationText !== "");
  updateTextAreaHeight();
}

function hideAnnotateButton() {
  annotateButton.style.display = "none";
  nodeIdWithAnnotateButton = null;
}

function placeAnnotateButtonOnNode(nodeId) {
  nodeIdWithAnnotateButton = nodeId;
  annotateButton.style.display = "block";
  updateAnnotateButtonPosition();
}

async function onSelectionChange() {
  // remove the glyph from the previous selected node if we have one
  if (nodeIdWithAnnotateButton) {
    hideAnnotateButton();
  }
  if (getSelectedNodeIds().length > 0) {
    placeAnnotateButtonOnNode(getLatestSelectedNodeId());
  }
}

async function onClick({ id, subItem, preventDefault }) {
  // If the chart is clicked while an annotation is being edited finalize the annotation
  if (annotationBeingUpdated !== null) {
    finalizeAnnotation();
    preventDefault();
    return;
  }

  if (id) {
    const clickedItem = chart.getItem(id);
    if (
      clickedItem.type === "annotation" &&
      subItem?.index === editLabelIndex
    ) {
      if (nodeIdWithAnnotateButton !== null) {
        hideAnnotateButton();
      }
      // Prevent selection from being cleared when an annotation is clicked
      preventDefault();
      setCursor(null);
      annotationBeingUpdated = clickedItem;
      await initialiseAnnotationEdit();
    }
  }
}

async function onDragStart() {
  // If the chart is dragged while an annotation is being edited finalize the annotation
  if (annotationBeingUpdated !== null) {
    await finalizeAnnotation();
  }
}

function onDragMove({ id }) {
  // Update the annotate button position while dragging the attached node
  if (id && getSelectedNodeIds().includes(id)) {
    updateAnnotateButtonPosition();
  }
}

function onViewChange() {
  // Update the annotate button position while zooming and panning the chart
  if (nodeIdWithAnnotateButton) {
    updateAnnotateButtonPosition();
  }
  if (annotationBeingUpdated !== null) {
    finalizeAnnotation();
  }
}

/* Ensures annotate button position is updated when nodes
   are moved using the keyboard arrow keys */
function onPreChange({ type }) {
  if (type === "move" && nodeIdWithAnnotateButton !== null) {
    setTimeout(() => {
      updateAnnotateButtonPosition();
    });
  }
}

async function onHover({ id, subItem }) {
  const hoveringEditLabel = id && subItem?.index === editLabelIndex;
  if (hoveringEditLabel) {
    hoveredAnnotationId = id;
  }
  // Apply styling updates when the chart annotation edit button is hovered
  if (hoveredAnnotationId !== null) {
    await updateEditLabelHoverState(
      hoveringEditLabel,
      chart.getItem(hoveredAnnotationId),
    );
    const cursorUpdateType = hoveringEditLabel ? "pointer" : "null";
    setCursor(cursorUpdateType);
  }
  if (id === null) {
    hoveredAnnotationId = null;
  }
}

async function updateEditLabelHoverState(hovered, hoveredAnnotation) {
  const hoveredAnnotationLabel = hoveredAnnotation?.t;
  if (hoveredAnnotationLabel) {
    const editLabelHoverColour = hovered
      ? colours.hoveredEditLabel
      : colours.defaultEditLabel;
    hoveredAnnotation.t[editLabelIndex].fbc = editLabelHoverColour;
    await chart.setProperties({
      id: hoveredAnnotation.id,
      t: hoveredAnnotation.t,
    });
  }
}

// Enable cursor styling override while interacting with the chart
function setCursor(type) {
  // get all non-cursor classes
  const classes = Array.from(chartContainer.classList).filter(
    (cn) => !cn.match(/^cursor-/),
  );
  if (type) {
    classes.push(`cursor-${type}`);
  }
  chartContainer.className = classes.join(" ");
}

function initialiseInteractions() {
  chart.on("selection-change", onSelectionChange);
  chart.on("click", onClick);
  chart.on("hover", onHover);
  chart.on("drag-start", onDragStart);
  chart.on("drag-move", onDragMove);
  chart.on("prechange", onPreChange);
  chart.on("view-change", onViewChange);
  const confirmAnnotationUpdateButton = document.getElementById("done");
  const deleteAnnotationButton = document.getElementById("delete");
  annotateButton.addEventListener("click", annotate);
  confirmAnnotationUpdateButton.addEventListener("click", () =>
    finalizeAnnotation("dismiss"),
  );
  deleteAnnotationButton.addEventListener("click", () =>
    finalizeAnnotation("delete"),
  );
  annotationTextArea.addEventListener("input", onAnnotationInput);
  annotationTextArea.addEventListener("keydown", onAnnotationKeyDown);
}

async function startKeyLines() {
  const options = {
    handMode: true,
    backColour: "rgb(209, 224, 230)",
    overview: false,
    navigation: false,
    selectedNode: {
      c: colours.selectedNode,
    },
    selectedLink: {},
    hover: 10,
    fontFamily: "Muli",
    iconFontFamily: "CI-Icons",
  };

  chart = await KeyLines.create({ container: "klchart", options });
  await chart.load(data);
  await chart.layout("sequential", {
    level: "level",
    tightness: 0,
    stretch: 0.54,
    animate: false,
  });

  await chart.zoom("fit", { ids: ["n1", "n2", "n3"] });

  initialiseInteractions();
}

// if you need font icons, keep this.
// If not, call startKeyLines() from the listener on the last line and delete this function
function loadWebFontsAndKeylines() {
  Promise.all([
    document.fonts.load("24px 'Muli'"),
    document.fonts.load('24px "CI-Icons"'),
  ]).then(startKeyLines);
}

window.addEventListener("DOMContentLoaded", loadWebFontsAndKeylines);export const colours = {
defaultNode: "rgb(7, 15, 77)",
selectedNode: "rgb(35, 43, 105)",
defaultLink: "rgb(202, 202, 202)",
defaultEditLabel: "rgb(255, 229, 222)",
hoveredEditLabel: "rgb(244, 167, 150)",
};
export const BASE_ANNOTATION = {
type: "annotation",
connectorStyle: {
c: "rgb(238, 116, 90)",
},
w: 274,
h: 46,
c: "rgb(255, 255, 255)",
b: "rgb(201, 218, 252)",
t: [
{
fbc: "transparent",
minWidth: "stretch",
minHeight: "stretch",
position: { vertical: "middle", horizontal: "centre" },
textWrap: "normal",
},
{
t: "",
fc: "rgb(0, 0, 0)",
textAlignment: {
horizontal: "left",
},
position: {
horizontal: "left",
vertical: "top",
},
padding: "16 12 12 12",
textWrap: "normal",
maxHeight: 2000,
maxWidth: 274,
},
{
fi: {
t: "ci-icon-pencil-edit",
c: "rgb(0, 0, 0)",
ff: "CI-Icons",
},
fbc: colours.defaultEditLabel,
position: {
horizontal: "right",
vertical: "bottom",
},
padding: 8,
margin: 8,
borderRadius: 3,
},
],
};
export function createAnnotation(
id,
subject,
text,
position,
w = BASE_ANNOTATION.w,
h = BASE_ANNOTATION.h,
) {
const t = BASE_ANNOTATION.t.map((t) => ({ ...t }));
if (text) {
const textContentLabelIndex = 1;
t[textContentLabelIndex].t = text;
}
return {
...BASE_ANNOTATION,
id,
subject,
connectorStyle: {
...BASE_ANNOTATION.connectorStyle,
},
t,
position,
w,
h,
};
}
const defaultAnnotation = createAnnotation(
"a1",
["n2"],
"Select a node to create an annotation",
{
angle: "n",
distance: 80,
},
274,
72,
);
export const data = {
type: "LinkChart",
items: [
{
id: "n1",
type: "node",
c: colours.defaultNode,
d: {
level: 1,
},
},
{
id: "n2",
type: "node",
c: colours.defaultNode,
d: {
level: 1,
},
},
{
id: "n3",
type: "node",
c: colours.defaultNode,
d: {
level: 2,
},
},
{
id: "n1-n2",
type: "link",
id1: "n1",
id2: "n2",
c: colours.defaultLink,
},
{
id: "n1-n3",
type: "link",
id1: "n1",
id2: "n3",
c: colours.defaultLink,
},
{
id: "n2-n3",
type: "link",
id1: "n2",
id2: "n3",
c: colours.defaultLink,
},
defaultAnnotation,
],
};<!doctype html>
<html lang="en" style="background-color: #2d383f">
<head>
<meta charset="utf-8" />
<title>User-Created Annotations</title>
<link rel="stylesheet" type="text/css" href="@ci/theme/kl/css/keylines.css" />
<link rel="stylesheet" type="text/css" href="@ci/theme/kl/css/minimalsdk.css" />
<link rel="stylesheet" type="text/css" href="@ci/theme/kl/css/sdk-layout.css" />
<link rel="stylesheet" type="text/css" href="@ci/theme/kl/css/demo.css" />
<link rel="stylesheet" type="text/css" href="@ci/theme/kl/css/ci-icons.css" />
<link rel="stylesheet" href="./style.css" />
</head>
<body>
<div id="klchart" class="klchart">
<div class="overlay" oncontextmenu="return false;">
<button class="overlay-button" id="annotate-button">
<span class="ci-icon-annotate"></span>
</button>
<div id="annotation-preview" oncontextmenu="return false;">
<div id="annotation-upper">
<textarea
id="annotation-text"
placeholder="Add comment"
rows="1"
spellcheck="false"
></textarea
><button class="control-button" id="ghost-done-button" disabled>
<span class="ci-icon-check"></span>
</button>
</div>
<div id="annotation-toolbar">
<div id="edit-controls">
<button class="overlay-button" id="delete"><span class="ci-icon-bin"></span></button
><button class="overlay-button" id="done"><span class="ci-icon-check"></span></button>
</div>
</div>
</div>
<span id="text-measure"></span>
</div>
</div>
<script type="module" src="./code.js"></script>
</body>
</html>/* Enable cursor overriding while hovering the chart */
.cursor-pointer canvas {
cursor: pointer !important;
}
.overlay {
position: absolute;
width: 100%;
height: 100%;
overflow: hidden;
/* Allow chart interaction through the overlay div*/
pointer-events: none;
}
.overlay-button {
background-color: rgb(241, 93, 91);
border: none;
cursor: pointer !important;
color: black;
&:hover {
background-color: rgb(254, 167, 154);
}
&:not(:disabled):hover {
background-color: rgb(254, 167, 154) !important;
> span {
color: rgb(0, 0, 0);
}
}
&:disabled {
background-color: rgba(0, 163, 255);
border: none;
cursor: not-allowed !important;
color: black !important;
&:hover {
border: none;
background-color: rgba(0, 163, 255);
}
}
&:focus {
background-color: rgb(241, 93, 91) !important;
color: black !important;
}
}
/* Overlay button (position (top/left) is updated from JS) */
#annotate-button {
position: absolute;
z-index: 1000;
width: 32px;
height: 32px;
border-radius: 20px 20px 20px 0px !important;
padding: 0px;
pointer-events: auto;
display: none;
}
/* Preview overlay*/
#annotation-preview {
display: none; /* Initially none otherwise flex */
position: absolute;
flex-direction: column;
padding: 10px;
border-radius: 3px;
width: 274px;
max-width: 274px;
gap: 4px;
background-color: rgb(255, 255, 255);
z-index: 499;
box-sizing: border-box;
pointer-events: auto;
}
#annotation-upper {
display: flex;
align-items: center;
}
#annotation-toolbar {
display: none;
justify-content: flex-end;
padding: 0px;
width: 100%;
}
#edit-controls {
display: flex;
gap: 6px;
}
#edit-controls > button {
cursor: pointer;
border: none;
width: 26px;
height: 26px;
padding: 0px;
border-radius: 3px !important;
&:hover {
background-color: (84, 193, 255);
}
}
#delete {
background-color: rgb(255, 229, 222);
}
#annotation-text {
resize: none;
border: none;
font-family: "Muli";
width: 100%;
height: auto;
overflow: hidden;
line-height: 16px;
font-size: 14px;
background-color: rgb(255, 255, 255);
&:focus {
outline: none;
}
}
#text-measure {
font-family: "Muli";
line-height: 15px;
font-size: 14px;
padding: 2px;
visibility: hidden;
}
/* Place holder disabled button for when we first
create an empty annotation */
#ghost-done-button {
width: 26px;
height: 26px;
padding: 0px;
background-color: #213d450d;
border: none;
border-radius: 3px;
cursor: auto;
&:disabled > span {
color: black !important;
}
}
.ci-icon-check {
font-size: 10px;
margin-top: 4px;
}
.ci-icon-bin {
font-size: 13px;
margin-top: 2px;
}
.cicontent > p > span {
display: inline-block;
width: 22px;
height: 22px;
vertical-align: bottom;
pointer-events: none;
background-color: rgb(234, 234, 234);
&:hover {
background-color: initial;
}
> i {
font-size: 10px;
}
}
.inline-edit-button {
margin: 0px 6px 0px 4px;
padding: 0px 0px 0px 6px;
}
.inline-annotate-button {
border-radius: 20px 20px 20px 0px;
margin: 0px 4px 0px 5px;
padding: 0px 0px 0px 6px;
}