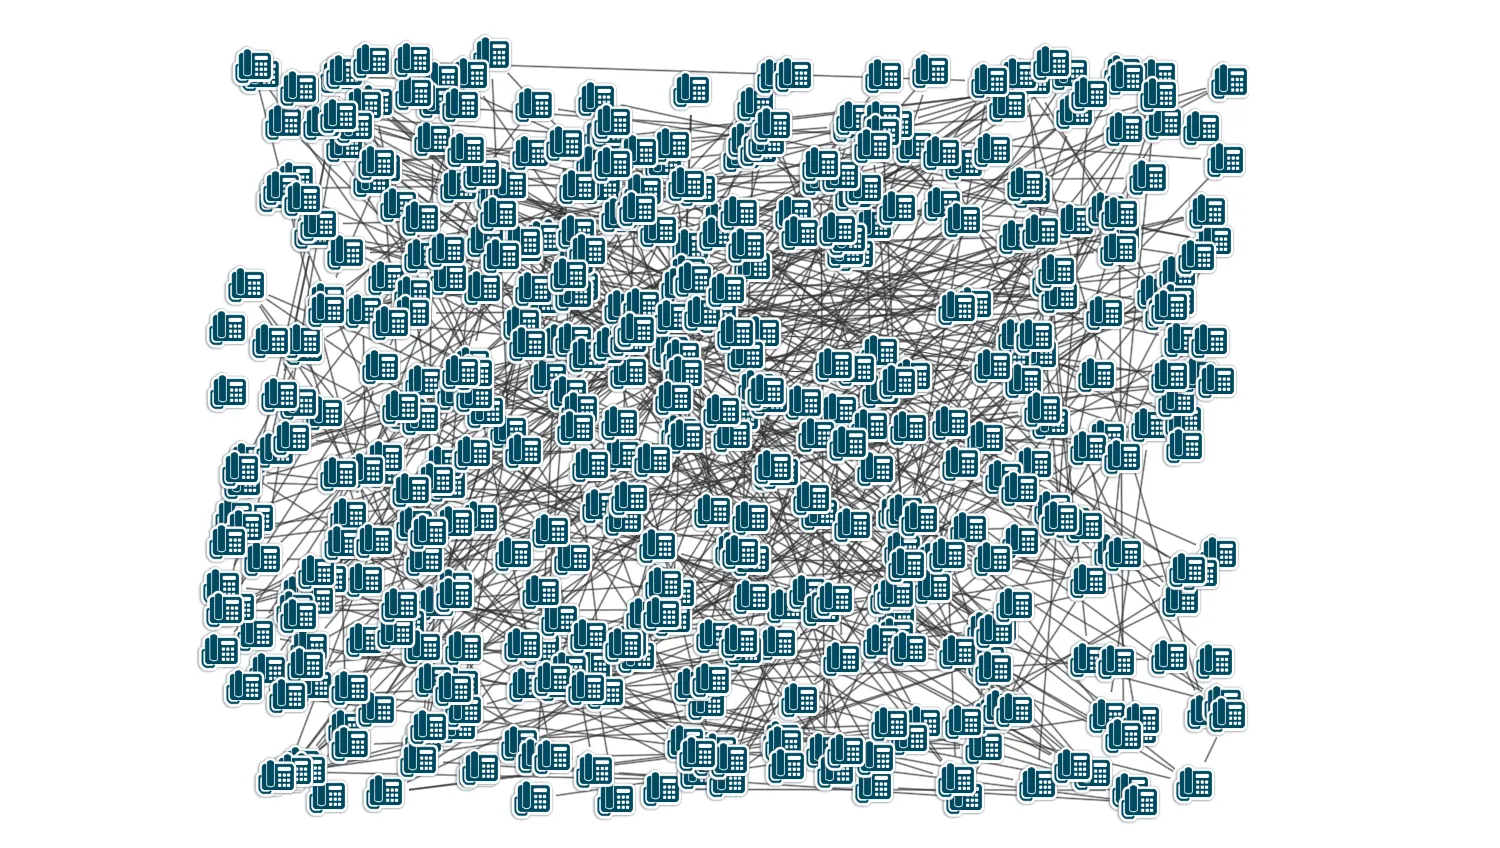
You will need to know how KeyLines performs.
This demo is designed for you to test its performance on your target hardware, browser and OS combination.
There are two main ways of measuring performance: frame rate and running layouts.
Frame Rate
The frame rate is the number of frames the browser is able to render per second. It is a critical measure of the responsiveness of an application from a user's perspective.
Browsers typically 'cap' their frame rates at 60 frames a second, so KeyLines can't draw faster than that. At sixty frames a second users cannot perceive individual frames and the experience is smooth. If the frame rate drops below 5 then users will start to complain when they are performing interactive tasks such as dragging nodes or selecting them.
The KeyLines' frame rate is roughly linear with the number of items drawn. I.e., drawing twice the number of items will typically halve the frame rate.
Layouts
KeyLines layouts are very fast, out-performing open source alternatives.
The demo uses our ‘organic’ layout, which has excellent performance on large datasets.
What happens when KeyLines isn't fast enough?
In general your users will struggle to comprehend networks of thousands of nodes and links, so sometimes it is worth thinking about things from their perspective and designing to that.
There are two basic techniques to get around this problem: filtering the network, and aggregating nodes together.
For more details, see Performance.
import KeyLines from "keylines";

function lerp(a, b, t) {
  return (1 - t) * a + t * b;
}

/**
 * Stars an FPS counter recording exponentially weighted mean and
 * standard deviation.
 */
function FpsCounter() {
  let tick = -1;
  let mean = -1;
  let sd = 0;

  (function next() {
    requestAnimationFrame((tock) => {
      if (tick > 0) {
        const durr = tock - tick;

        sd = mean > 0 ? lerp(sd, (mean - durr) ** 2, 0.06) : 0;
        mean = lerp(mean, durr, 0.02);
      }
      tick = tock;
      next();
    });
  })();

  return {
    get: () => {
      const fps = 1000 / mean;
      const fpsStd = (1000 * Math.sqrt(sd)) / (mean * mean);

      return { mean: fps, std: fpsStd };
    },
  };
}

var width = 638;
var height = 470;
var numNodes;
var numLinks;
var spacing;
var zooming = false;
var zoomHow = "out";
var animating = false;
var showLabels = false;
var chart;

function pushData(loadedChart) {
  chart = loadedChart;

  function linkIds() {
    var obj = {
      id1: "id" + Math.floor(Math.random() * numNodes),
      id2: "id" + Math.floor(Math.random() * numNodes),
    };
    if (obj.id1 === obj.id2) {
      return linkIds(numNodes); // try again
    }

    return obj;
  }

  function randomX() {
    return Math.floor(Math.random() * width * spacing);
  }

  function randomY() {
    return Math.floor(Math.random() * height * spacing);
  }

  function random(nNodes, nLinks) {
    cancelAnimations();
    numNodes = nNodes;
    numLinks = nLinks;
    spacing = numNodes < 150 ? 1 : Math.sqrt(numNodes / 150);

    var nodes = (function () {
      var ret = [];
      for (var i = 0; i < numNodes; i++) {
        ret.push({
          id: "id" + i,
          type: "node",
          t: showLabels ? i : null,
          d: { label: i },
          x: randomX(),
          y: randomY(),
          u: "/public/images/icons/telephone.png",
        });
      }
      return ret;
    })();

    var links = (function () {
      var ret = [];
      for (var i = 0; i < numLinks; i++) {
        var ids = linkIds();
        ret.push({
          id: "linkid" + i,
          type: "link",
          t: showLabels ? i : null,
          d: { label: i },
          id1: ids.id1,
          id2: ids.id2,
          c: "rgb(50, 50, 50)",
          w: 1,
        });
      }
      return ret;
    })();

    var items = nodes.concat(links);

    chart.load({
      type: "LinkChart",
      items: items,
    });
    chart.zoom("fit");
  }

  async function startAnimation() {
    if (animating) {
      var items = [];
      for (var i = 0; i < numNodes; i++) {
        items.push({ id: "id" + i, x: randomX(), y: randomY() });
      }
      await chart.animateProperties(items, { time: 3000 });
      startAnimation();
    }
  }

  function swapButtons(type, isActive) {
    // cast the isActive because undefined is different from false in this case
    $("#" + type + "On").toggleClass("active btn-kl", !!isActive);
    $("#" + type + "Off").toggleClass("active btn-kl", !isActive);
  }

  $("#animationOff").click(function (evt) {
    animating = false;
    swapButtons("animation", false);

    evt.preventDefault();
  });

  $("#animationOn").click(function (evt) {
    if (numNodes > 0 && animating === false) {
      swapButtons("animation", true);
      animating = true;
      startAnimation();
    }

    evt.preventDefault();
  });

  async function startZooming() {
    if (zooming) {
      // Invert the current zoom
      zoomHow = zoomHow === "in" ? "out" : "in";
      // Run the zoom
      await chart.zoom(zoomHow, { animate: true });
      startZooming();
    }
  }

  $("#zoomOff").click(function (evt) {
    zooming = false;
    swapButtons("zoom", false);

    evt.preventDefault();
  });

  $("#zoomOn").click(function (evt) {
    if (numNodes > 0 && zooming === false) {
      zooming = true;
      swapButtons("zoom", true);
      startZooming();
    }

    evt.preventDefault();
  });

  function toggleLabels() {
    var items = [];
    chart.each({ type: "all" }, function (item) {
      items.push({ id: item.id, t: showLabels ? item.d.label : null });
    });
    chart.setProperties(items);
  }

  $("#labelsOff").click(function (evt) {
    showLabels = false;
    swapButtons("labels", false);
    toggleLabels();
    evt.preventDefault();
  });

  $("#labelsOn").click(function (evt) {
    if (numNodes > 0) {
      showLabels = true;
      swapButtons("labels", true);
      toggleLabels();
    }

    evt.preventDefault();
  });

  function cancelAnimations() {
    // Cancel nodes animation
    animating = false;
    swapButtons("animation", false);
    // Cancel zoom
    zooming = false;
    swapButtons("zoom", false);
  }

  $("#generate").click(function (evt) {
    var option = $("#nodelink").val();
    if (option) {
      $("#animationOn").removeClass("disabled");
      $("#zoomOn").removeClass("disabled");
      $("#labelsOn").removeClass("disabled");
      var parts = option.split(",");
      random(Number(parts[0]), Number(parts[1]));
    }

    evt.preventDefault();
  });

  $("#layout").click(async function (evt) {
    cancelAnimations();
    evt.preventDefault();
    var start = new Date().getTime();
    await chart.layout("organic", { animate: false, packing: "circle" });
    var endtime = new Date().getTime();
    var secs = (endtime - start) / 1000;
    $("#layoutStats").text(secs + "s");
  });

  // display frame rate
  setInterval(
    function (fps) {
      let { mean, std } = fps.get();
      // fps +/- half standard deviation
      // n.b. filters extreme standard deviations (e.g. if the frame rate drops to zero
      // for several frames)
      const range = std > mean / 2 ? "-" : Math.round(std);
      $("#fps").text(Math.round(mean) + ` (± ${range}) Frames per Second`);
    },
    1000,
    FpsCounter(),
  );
}

$(function () {
  var options = {
    logo: { u: "/public/images/Logo.png" },
    minZoom: 0.02,
  };
  KeyLines.create({ container: "klchart", options: options }).then(pushData);
});<!doctype html>
<html lang="en" style="background-color: #2d383f">
<head>
<meta charset="utf-8" />
<title>Test Performance</title>
<link rel="stylesheet" type="text/css" href="@ci/theme/kl/css/keylines.css" />
<link rel="stylesheet" type="text/css" href="@ci/theme/kl/css/minimalsdk.css" />
<link rel="stylesheet" type="text/css" href="@ci/theme/kl/css/sdk-layout.css" />
<link rel="stylesheet" type="text/css" href="@ci/theme/kl/css/demo.css" />
<style>
h5 {
margin-bottom: 0;
}
</style>
<script src="jquery" defer type="text/javascript"></script>
</head>
<body>
<div id="klchart" class="klchart"></div>
<script type="module" src="./code.js"></script>
</body>
</html>