ReGraph Examples
Data
Styles
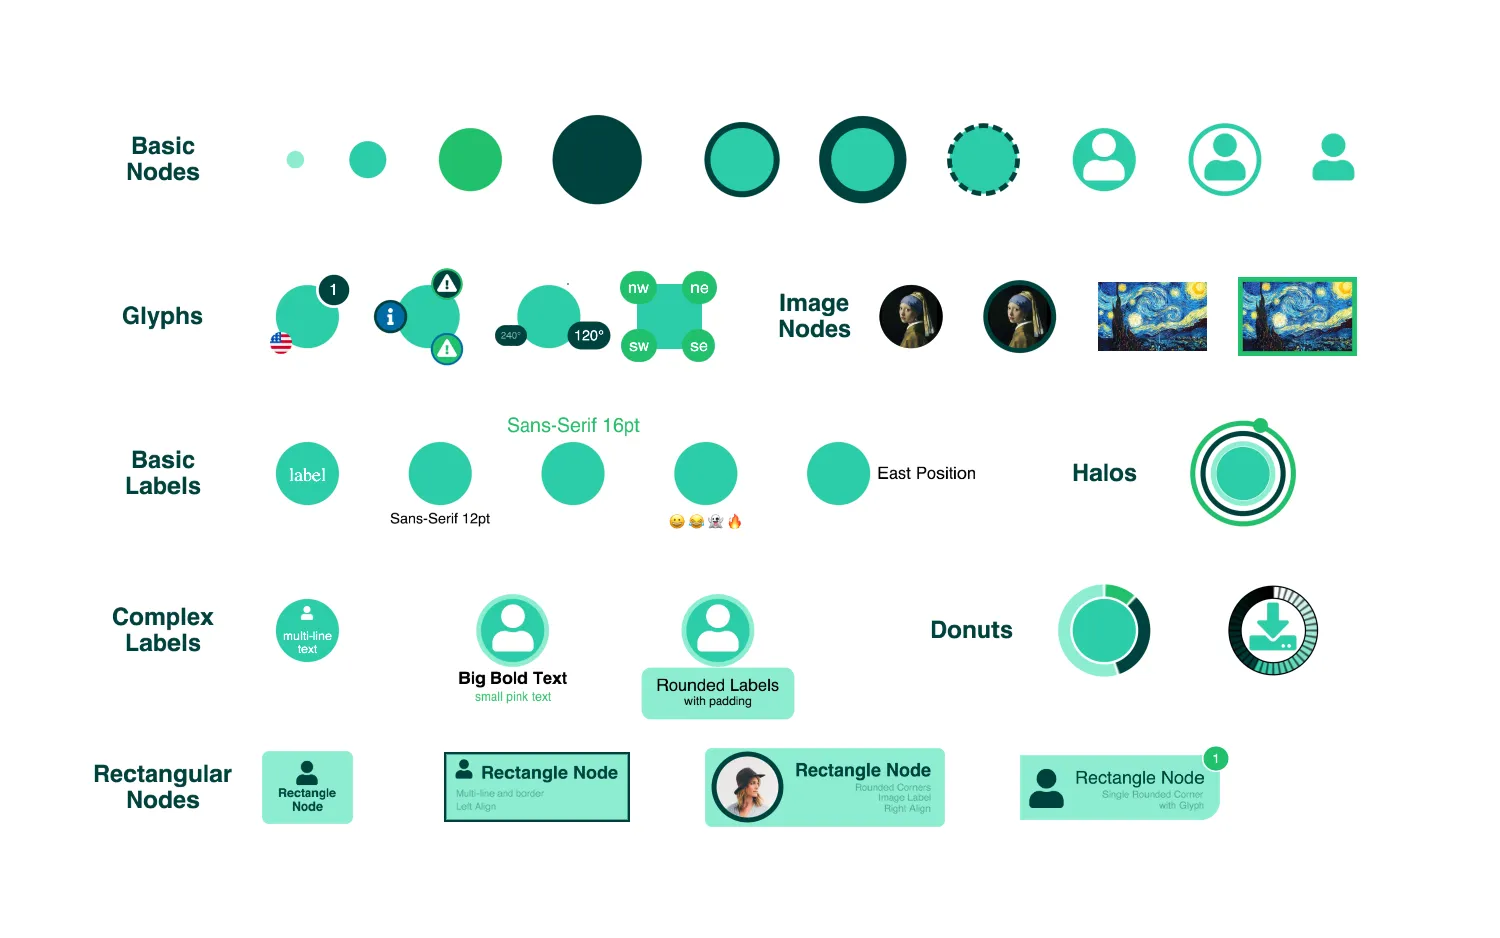
Node Gallery
Explore node styles with images, labels, glyphs and more.
See example
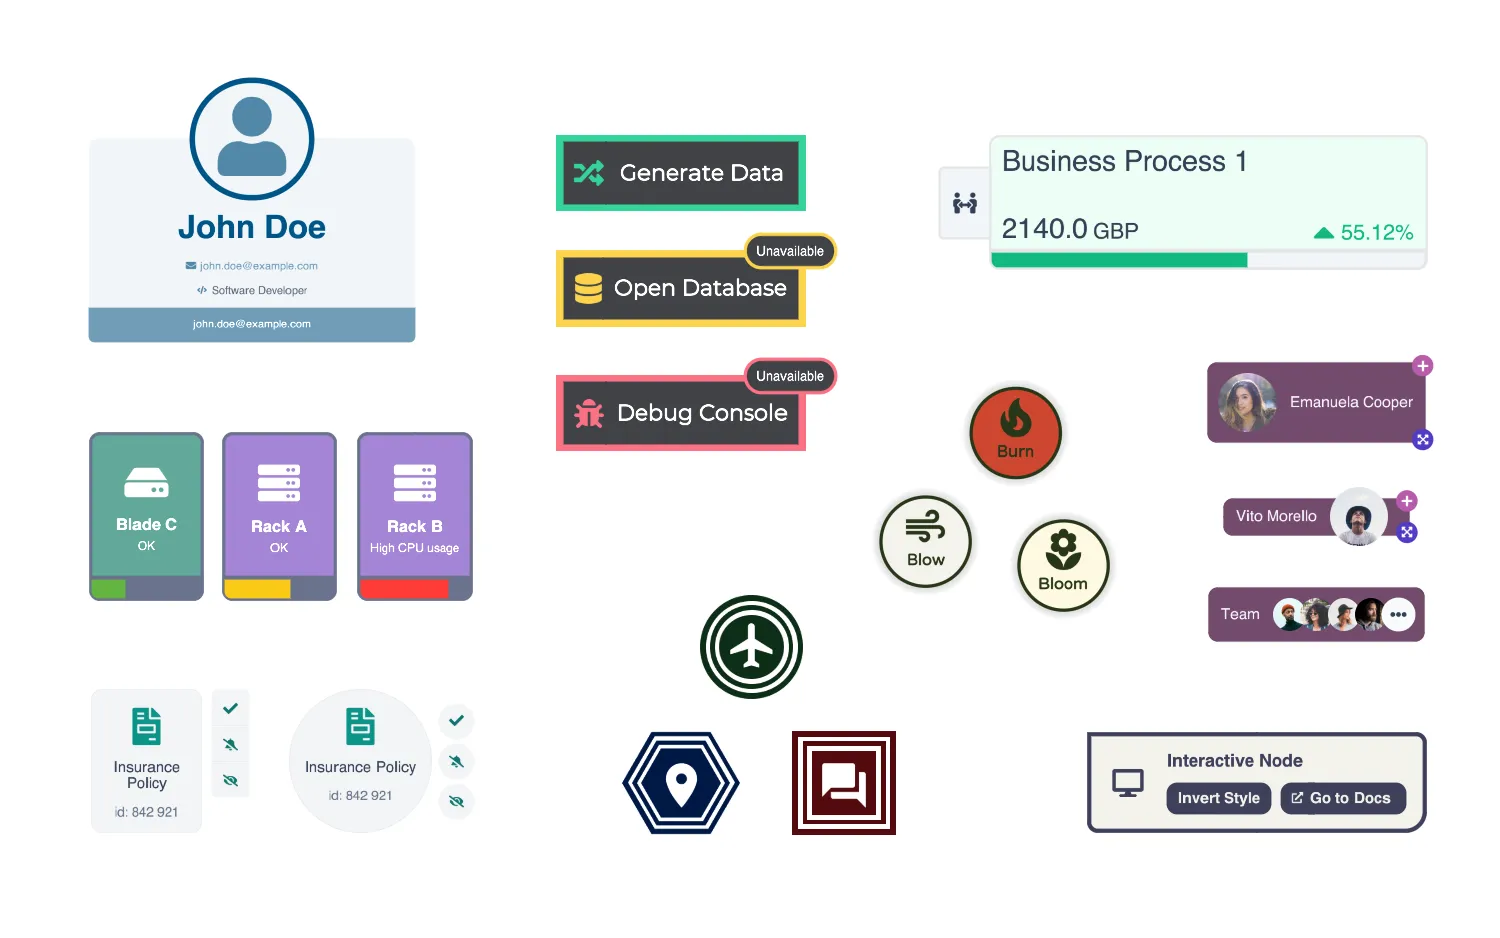
Advanced Node Gallery
Create custom shaped nodes with multiple labels and styles.
See example
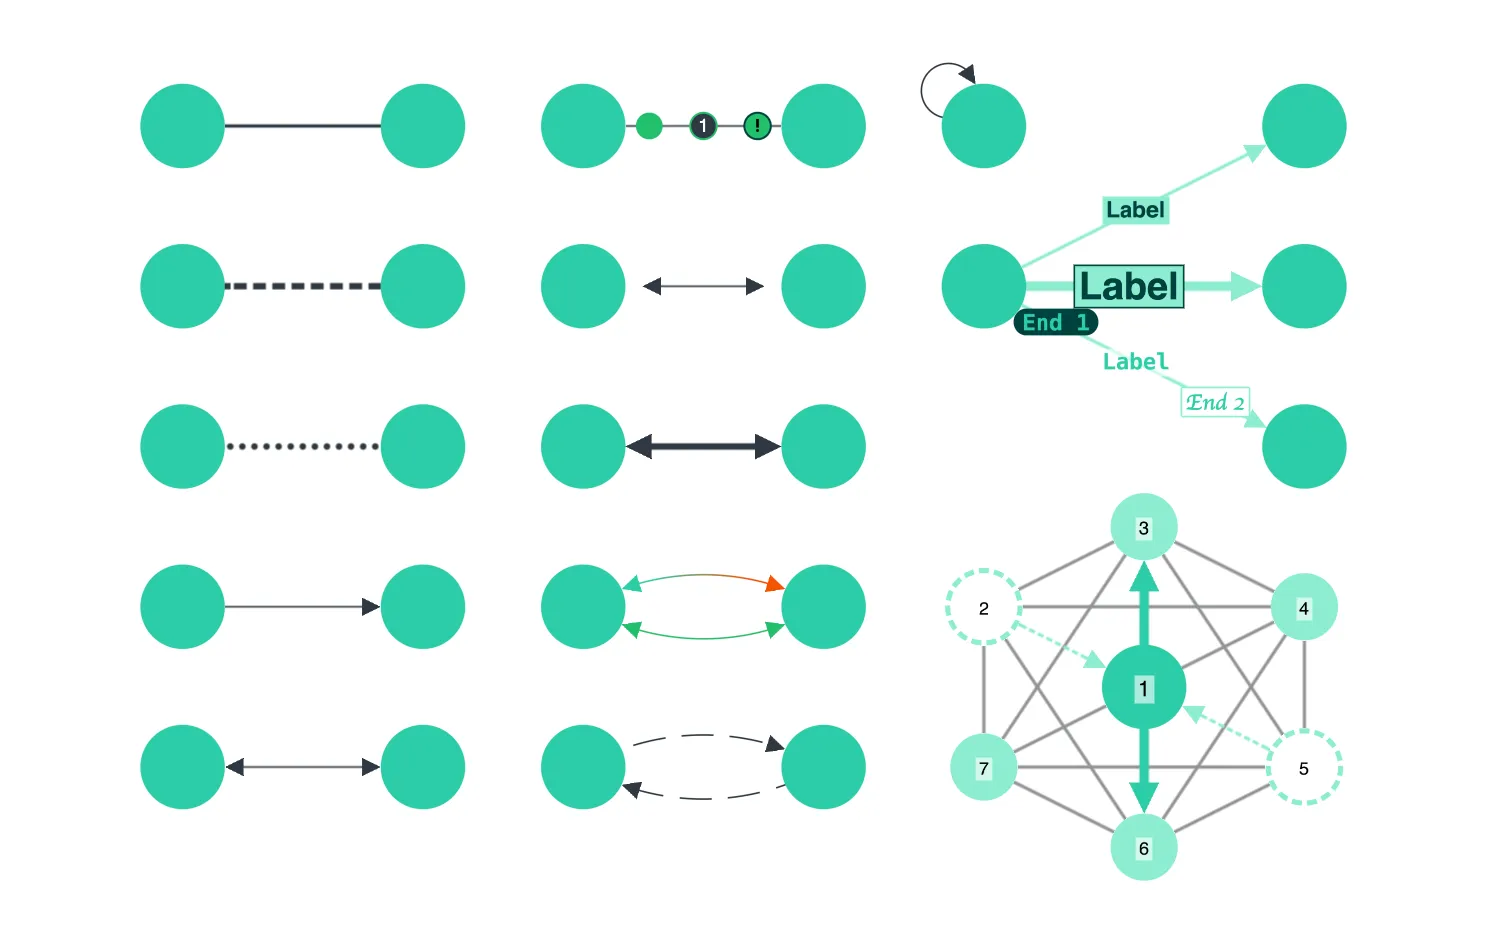
Link Gallery
Explore link styles with arrowheads, labels, glyphs and more.
See example
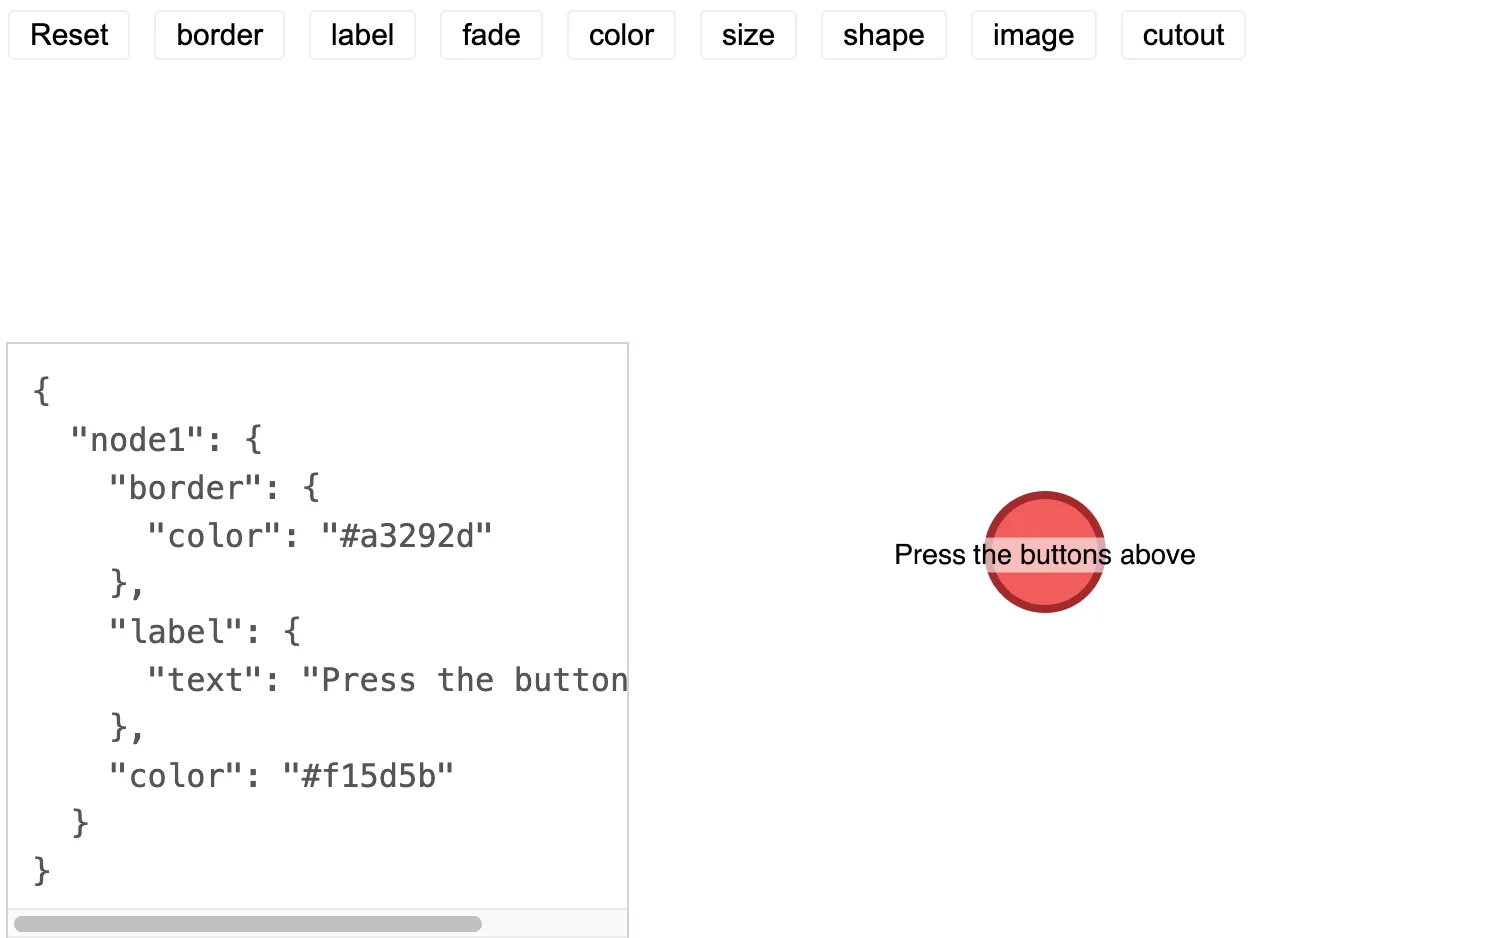
Node
Customize the nodes in your chart.
See example
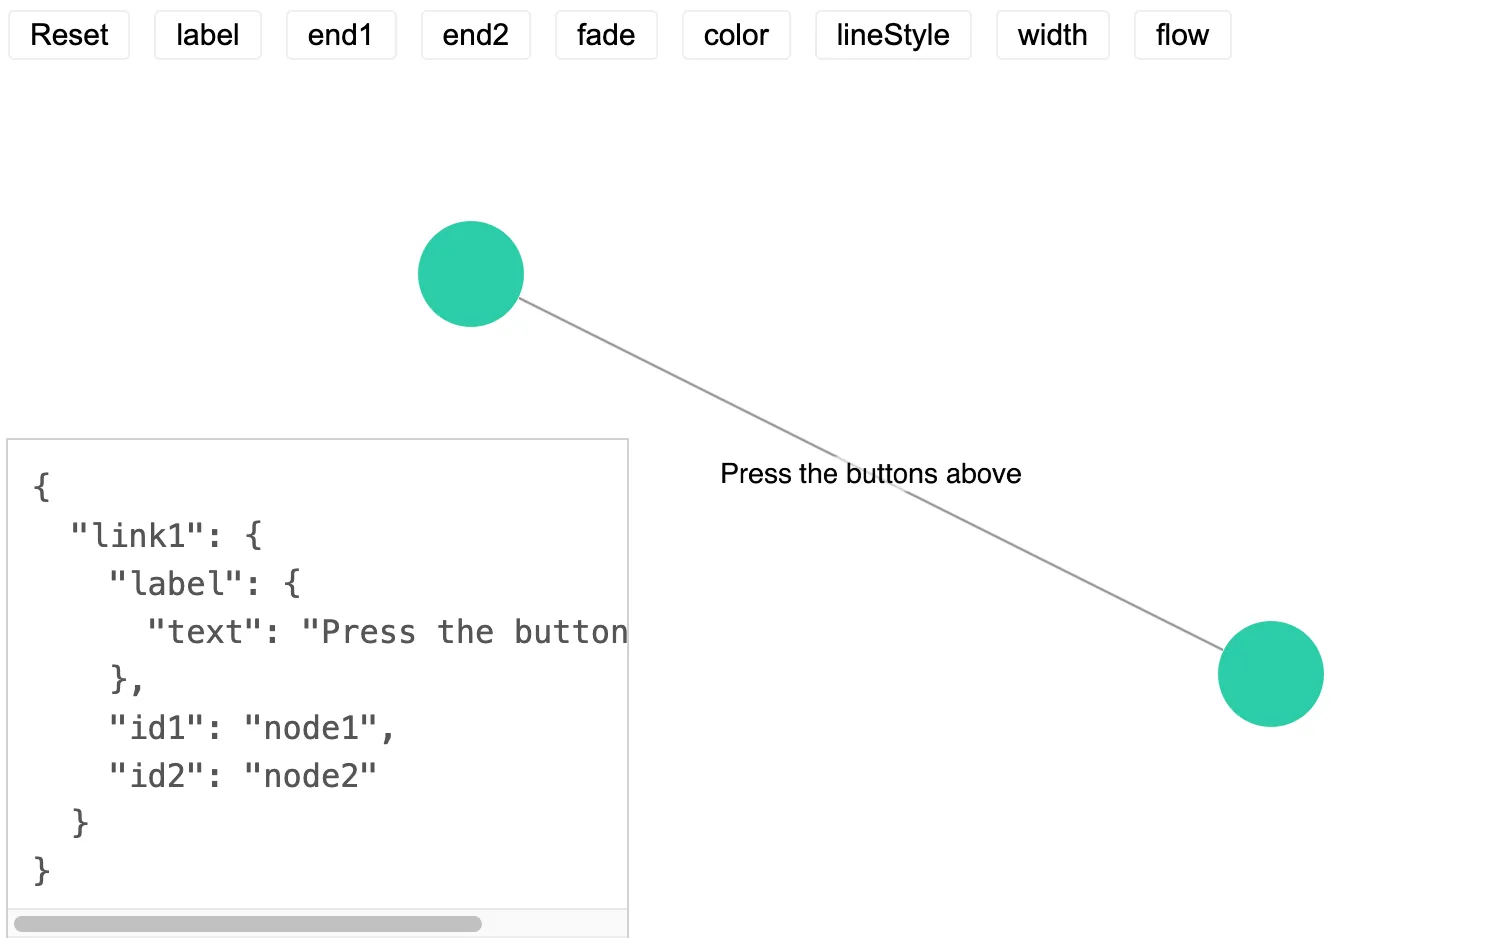
Link
Customize the links in your chart.
See example
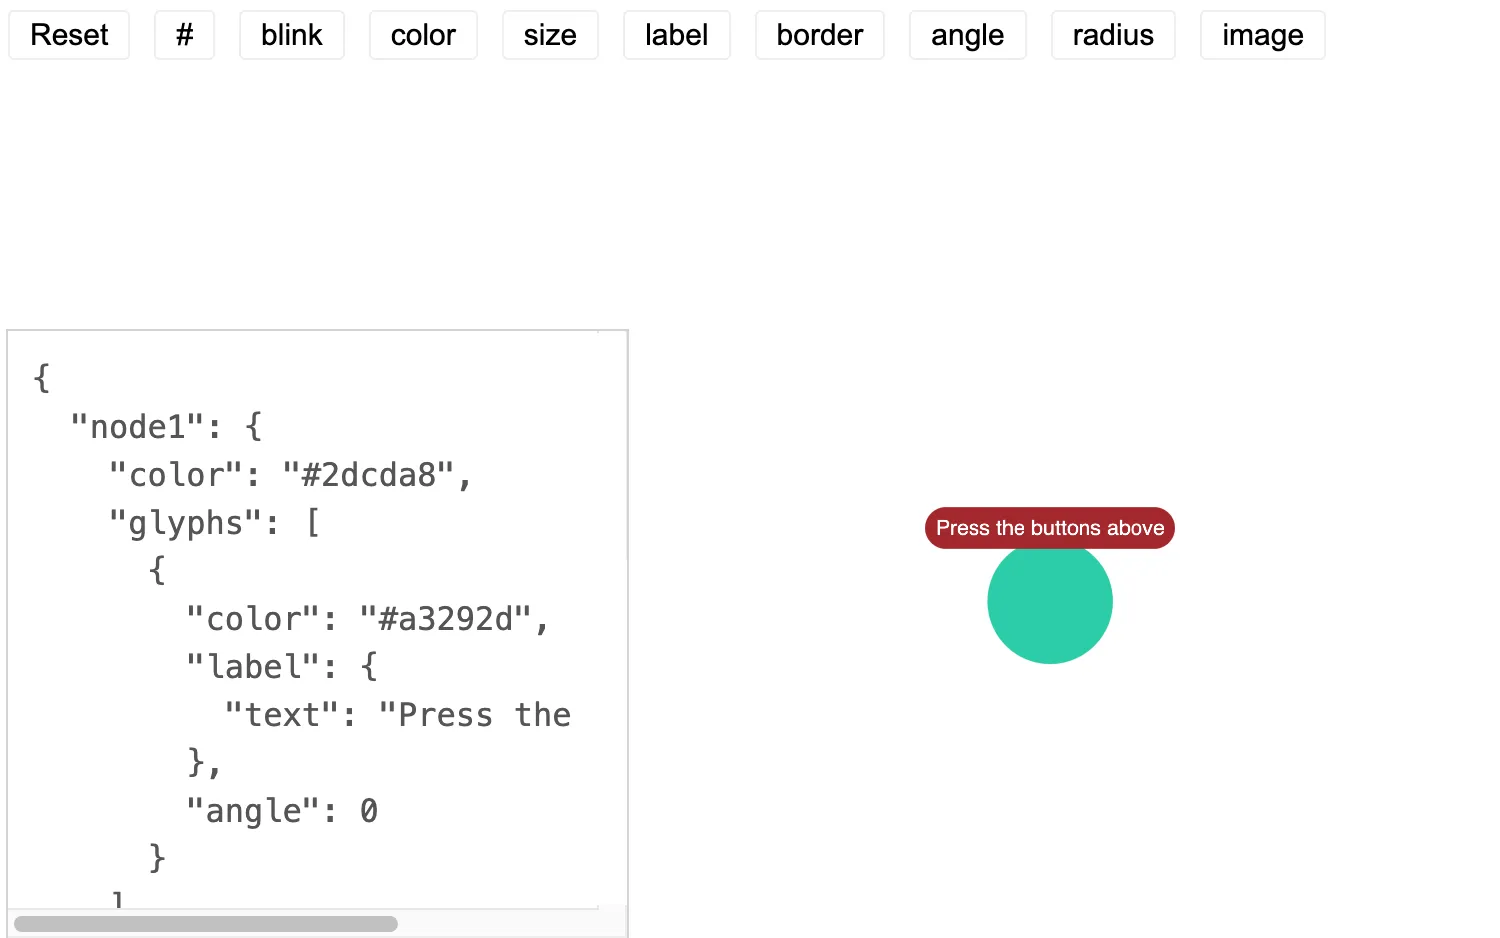
Node Glyph
Customize nodes with various glyphs.
See example
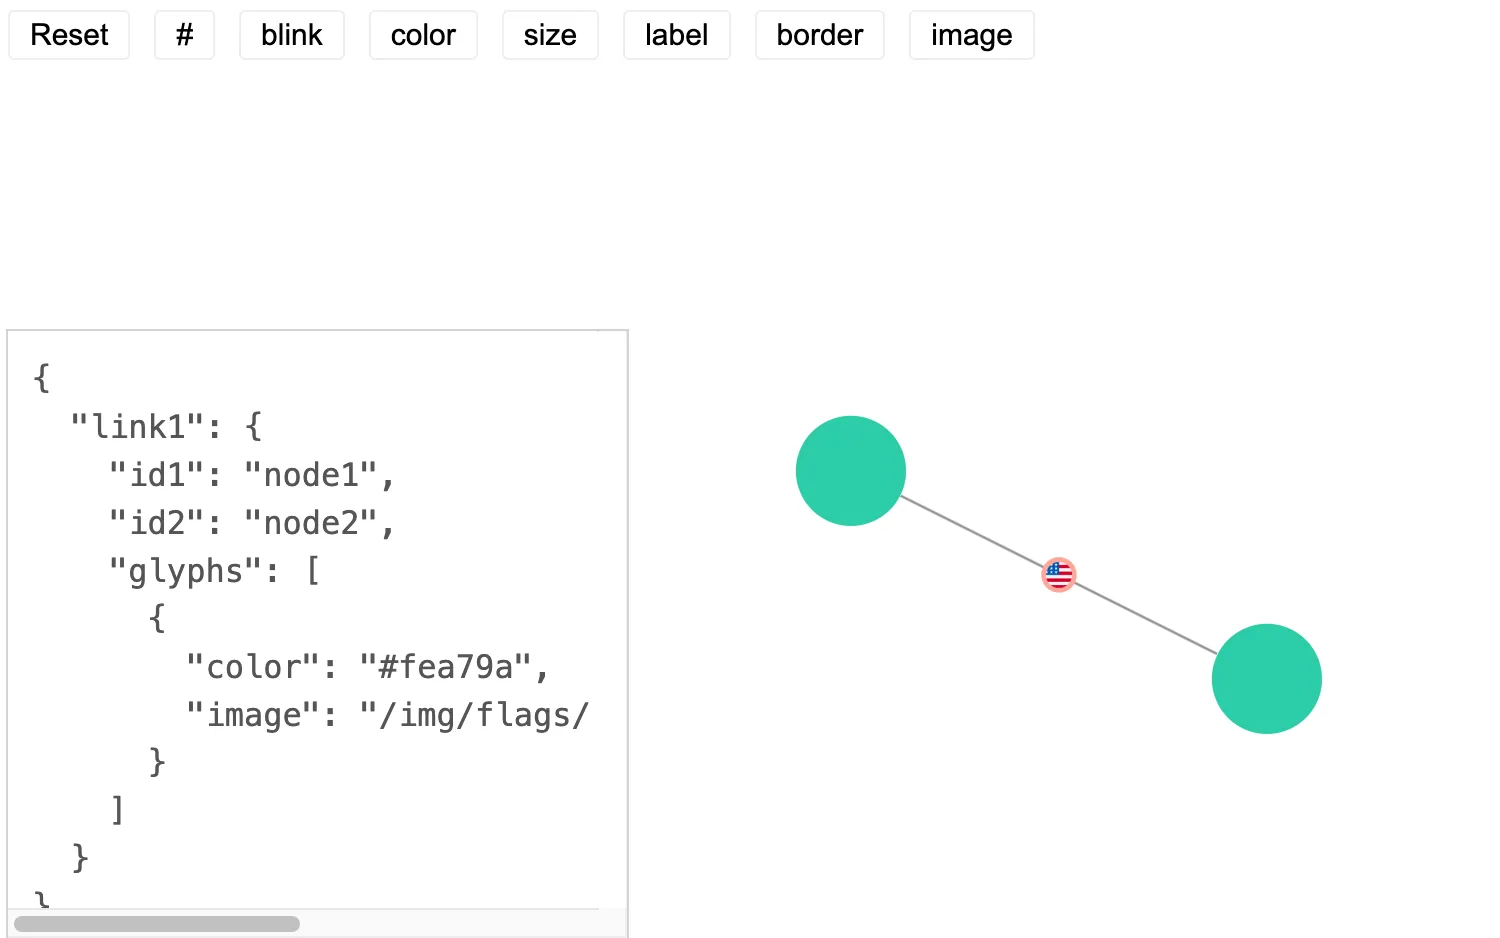
Link Glyph
Customize links with various glyphs.
See example
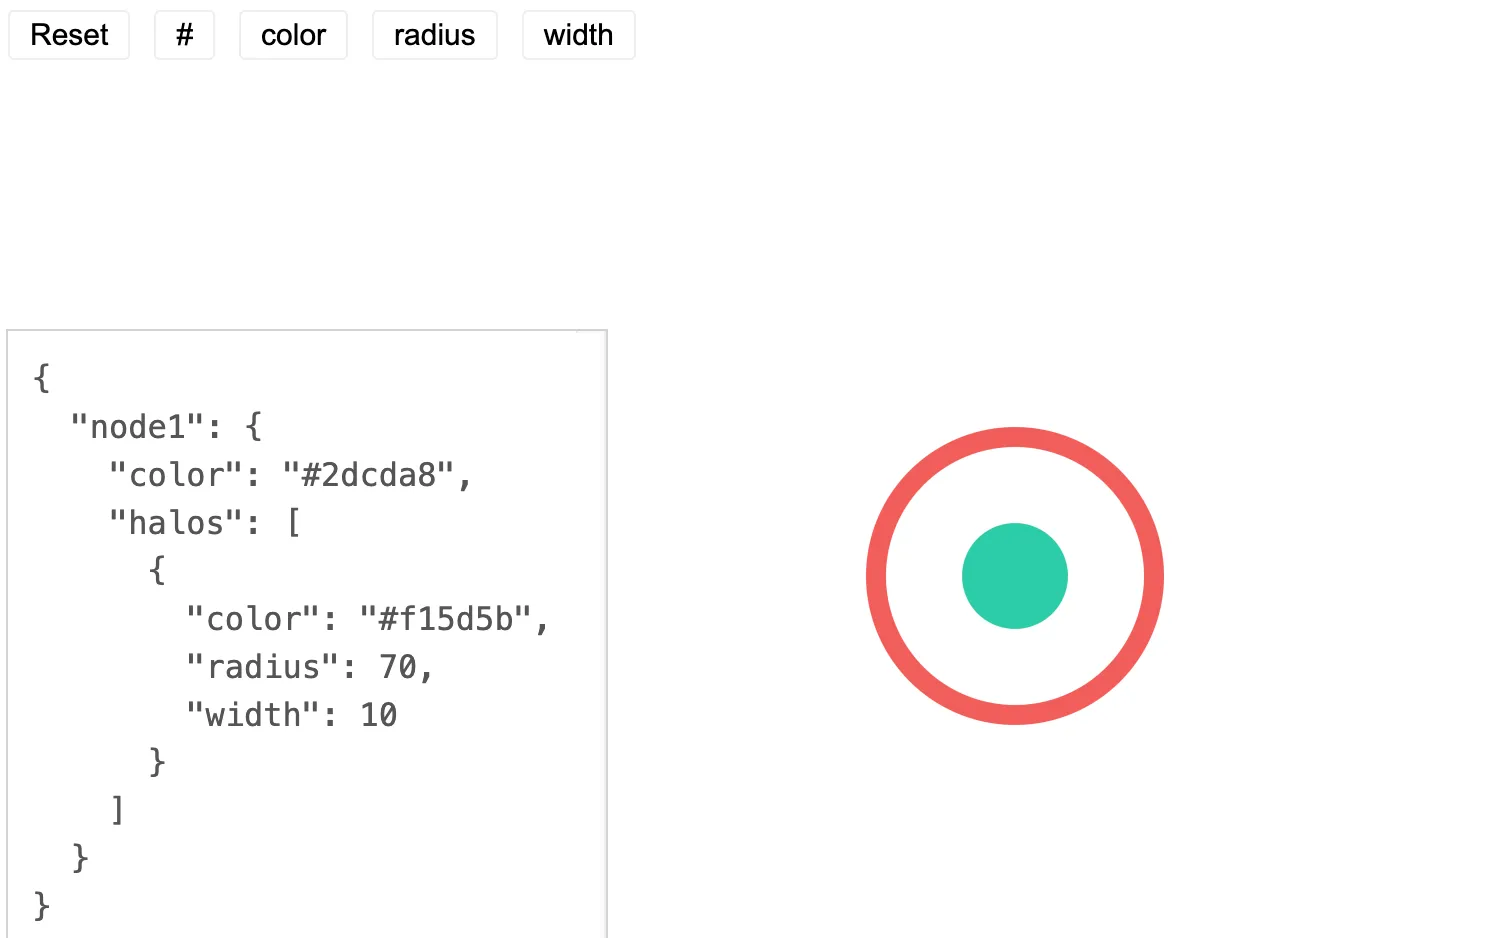
Halo
Highlight nodes with colored halos.
See example
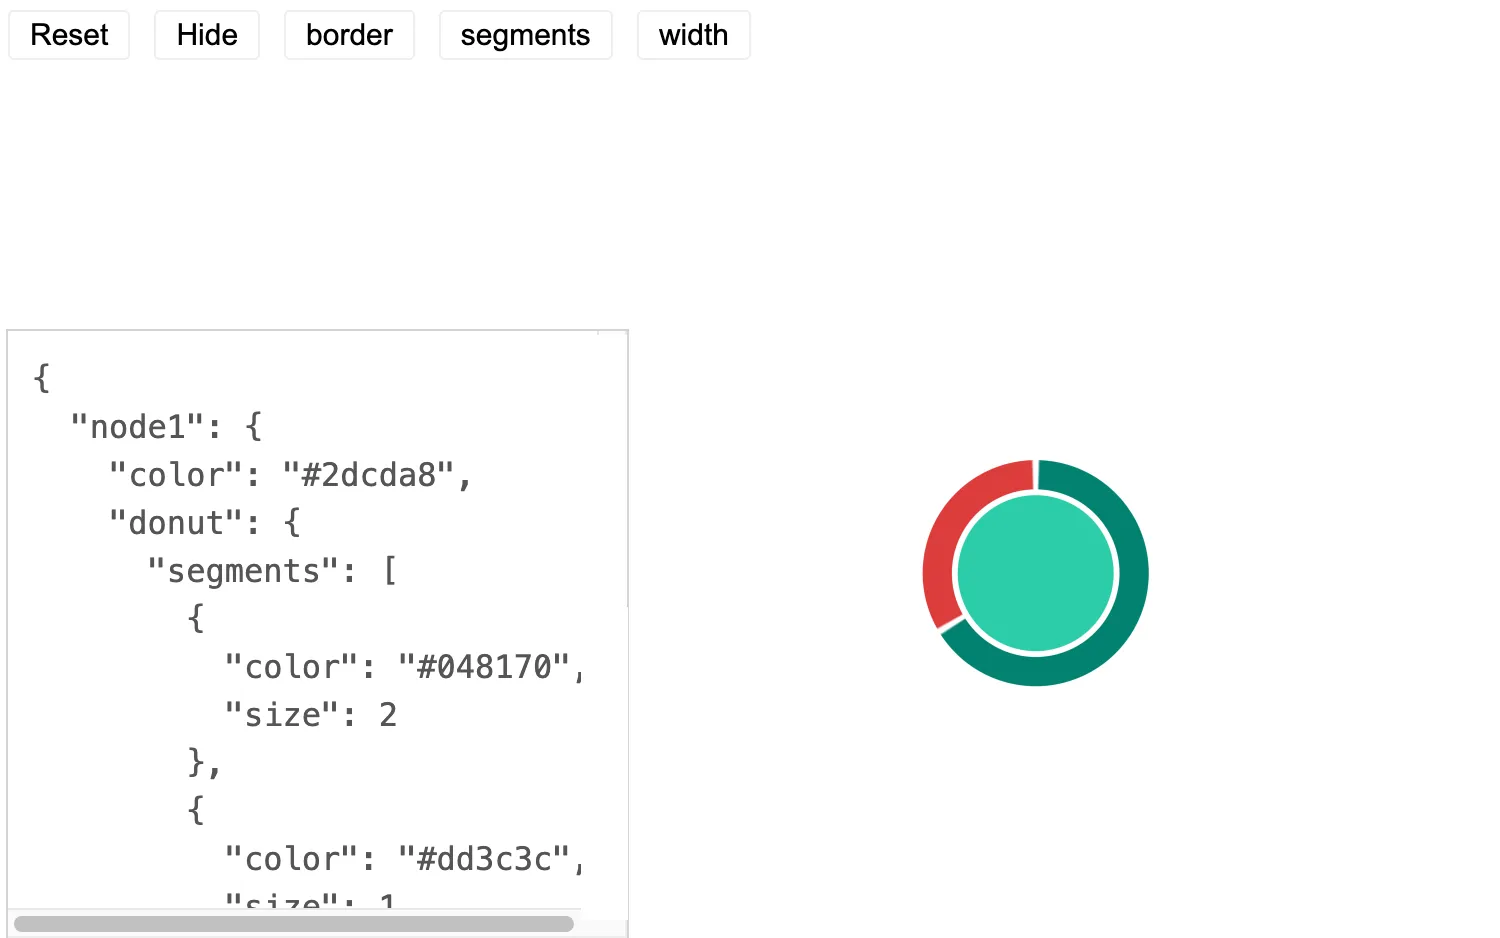
Donut
Add donuts with proportional segments to your chart nodes.
See example
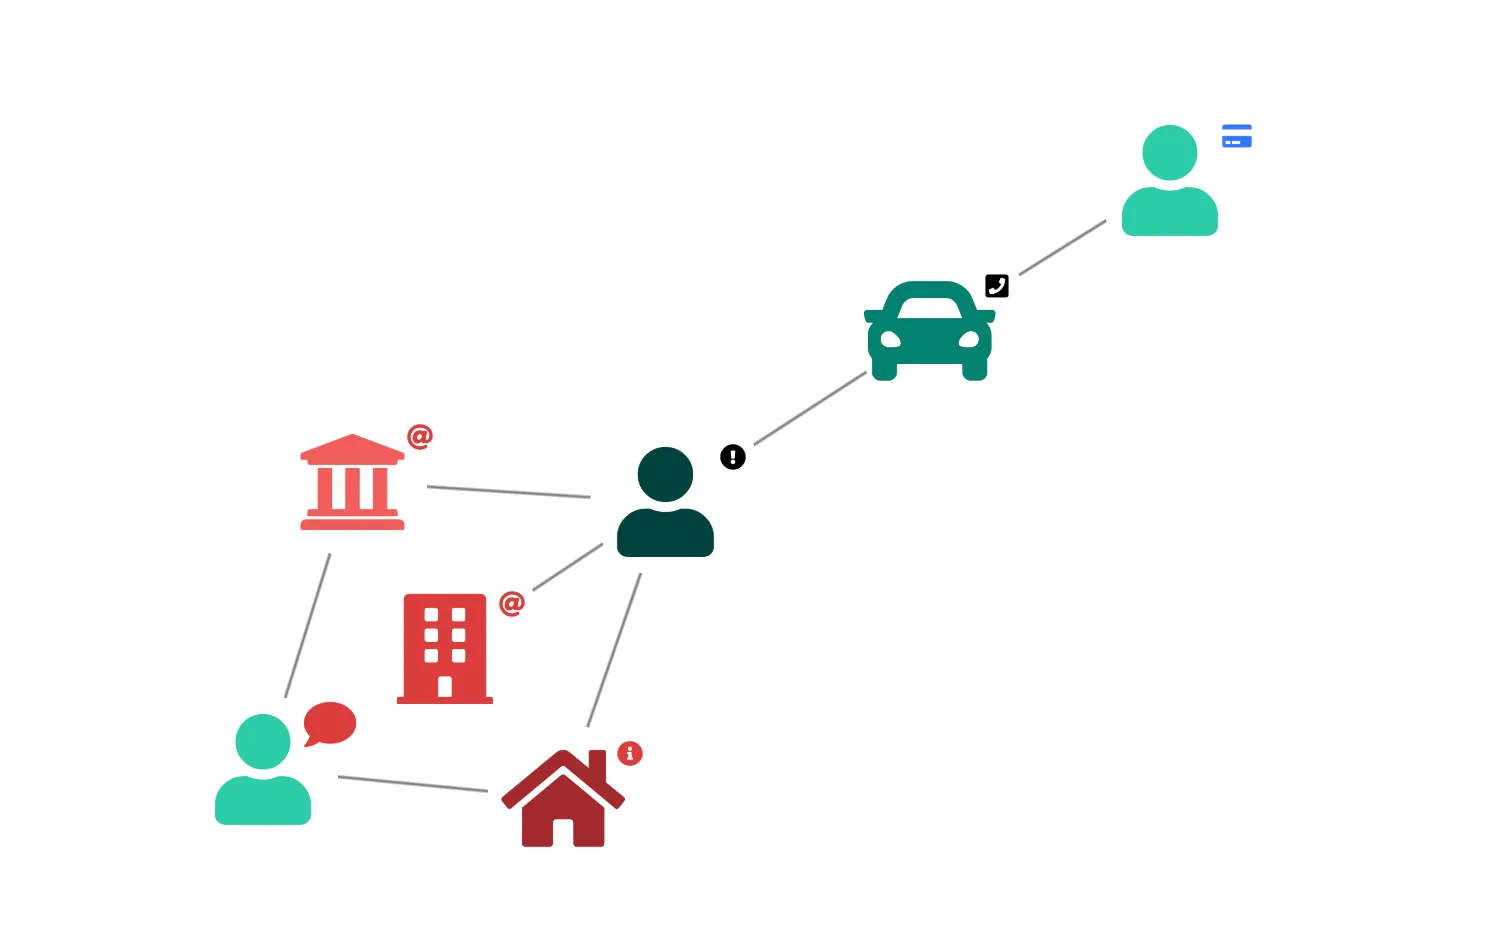
Font Awesome
Use Font Awesome font icons on nodes and glyphs.
See example
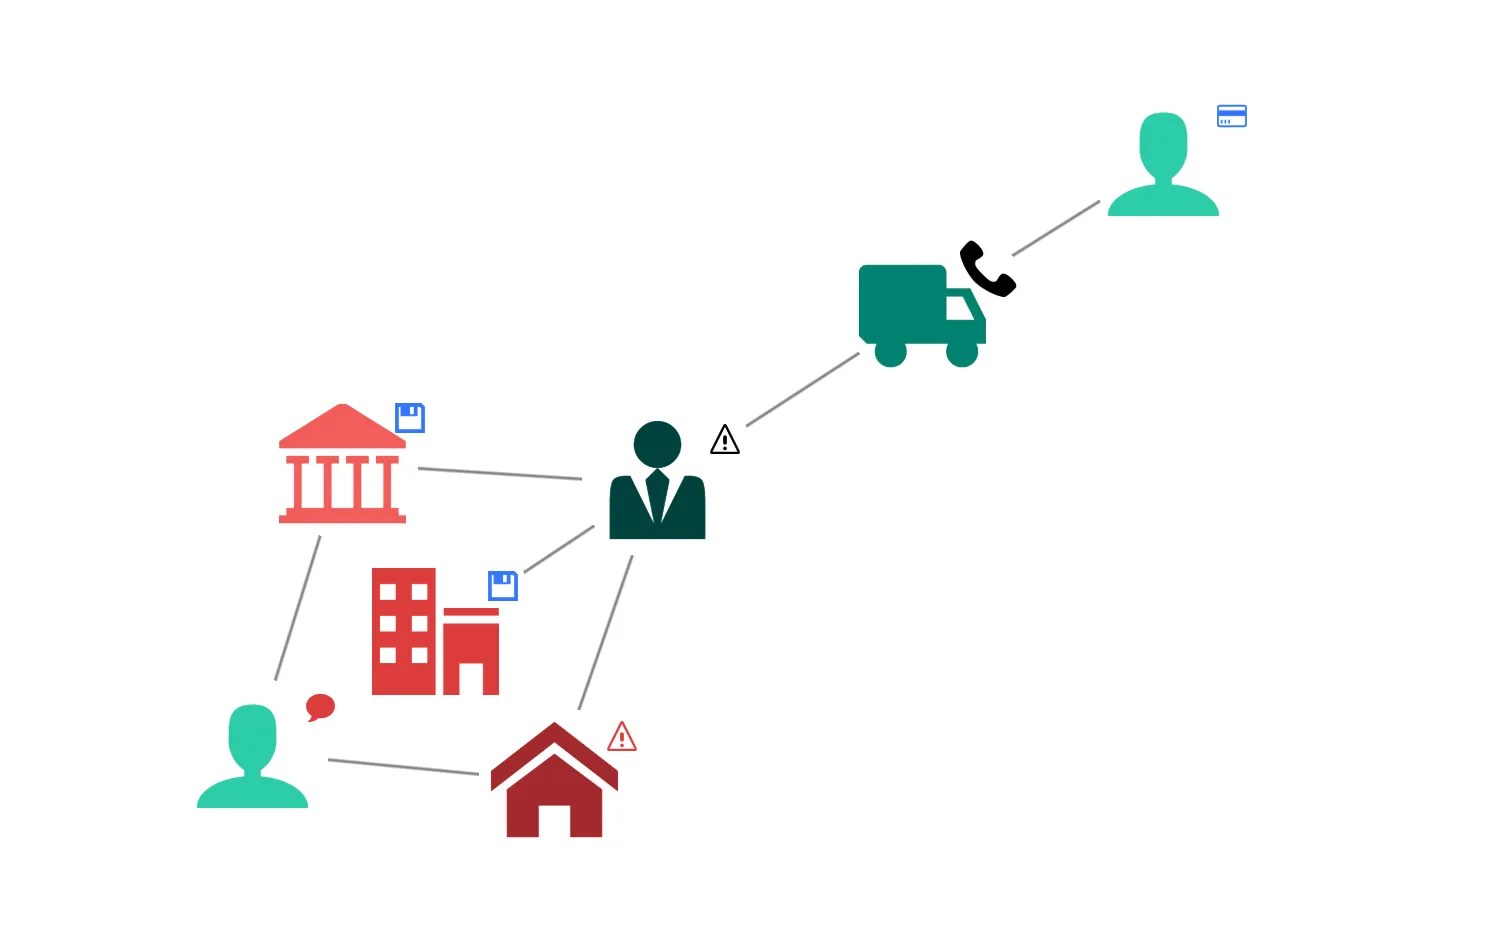
IcoMoon
Use IcoMoon font icons on nodes and glyphs.
See example
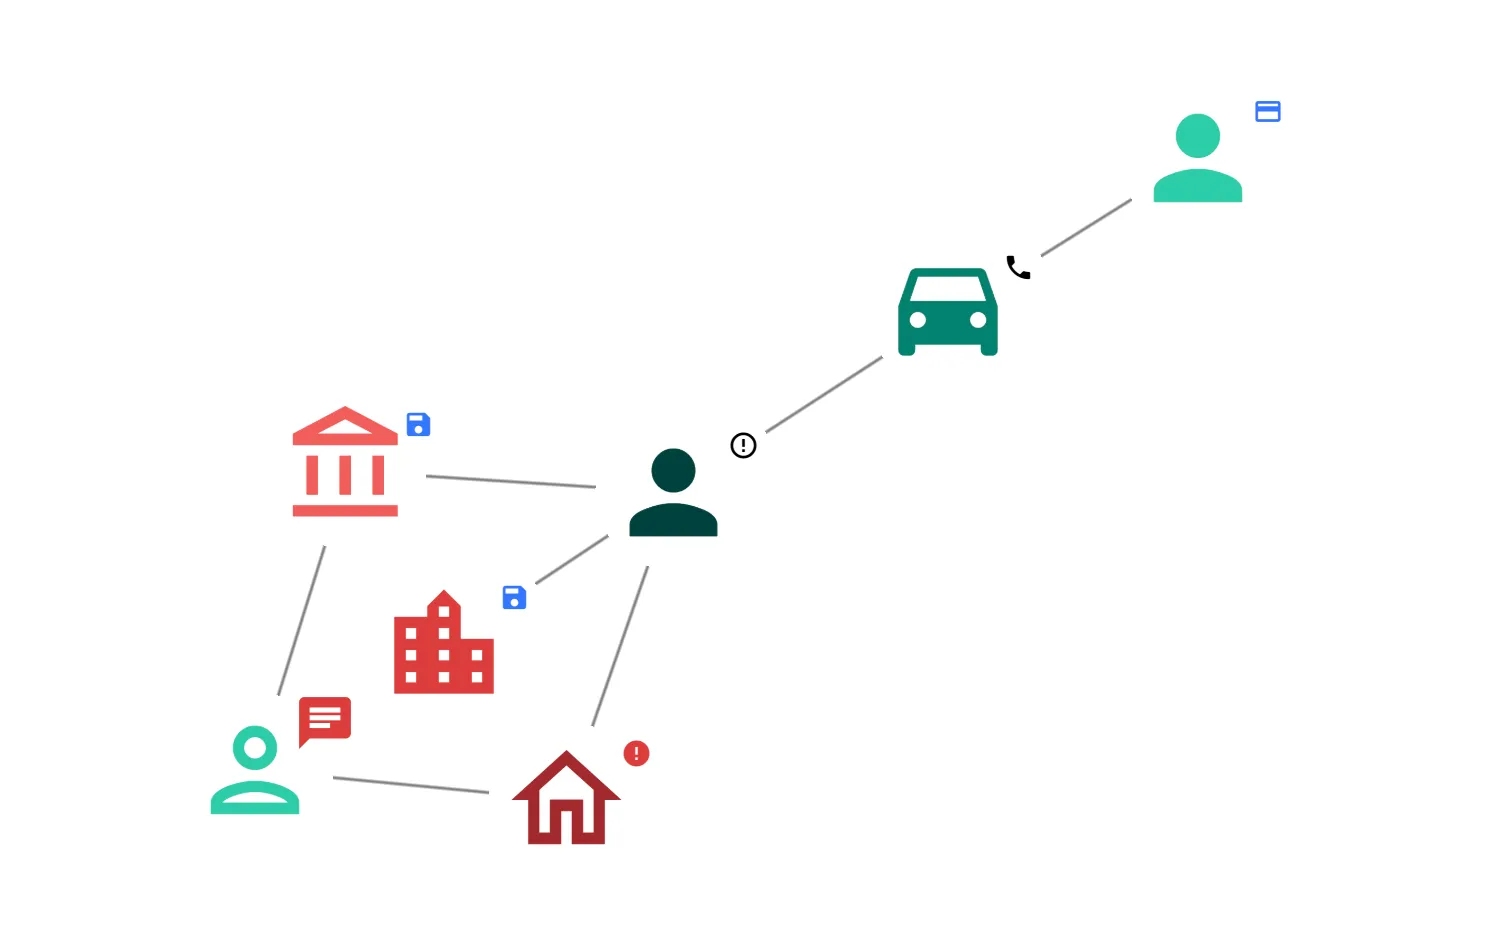
Material Icons
Use Material Icons font icons on nodes and glyphs.
See example
Interaction
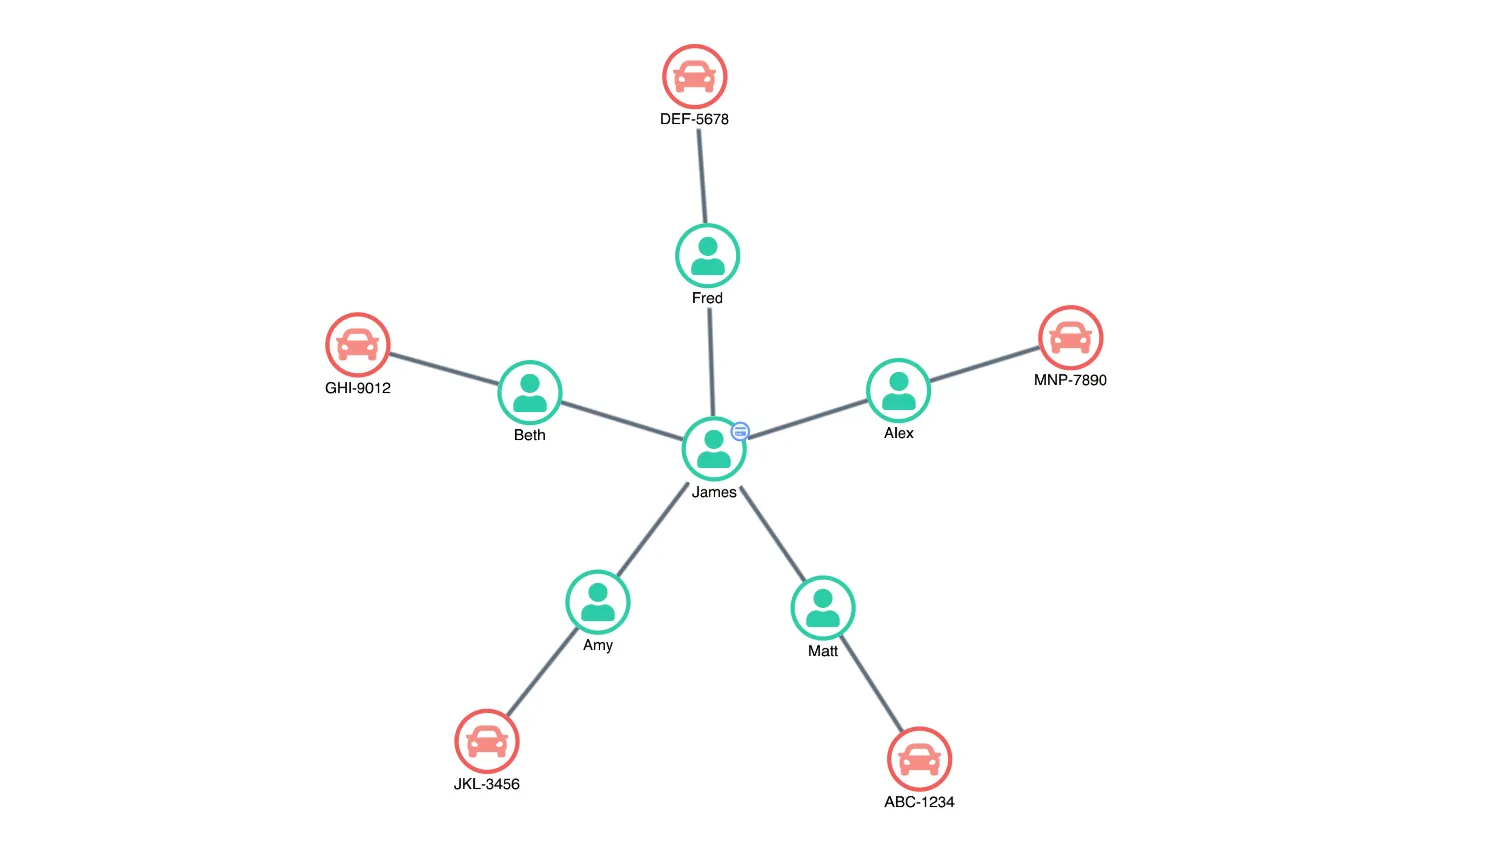
Interaction Styling
Add temporary interaction styling to hovered or clicked chart items.
See example
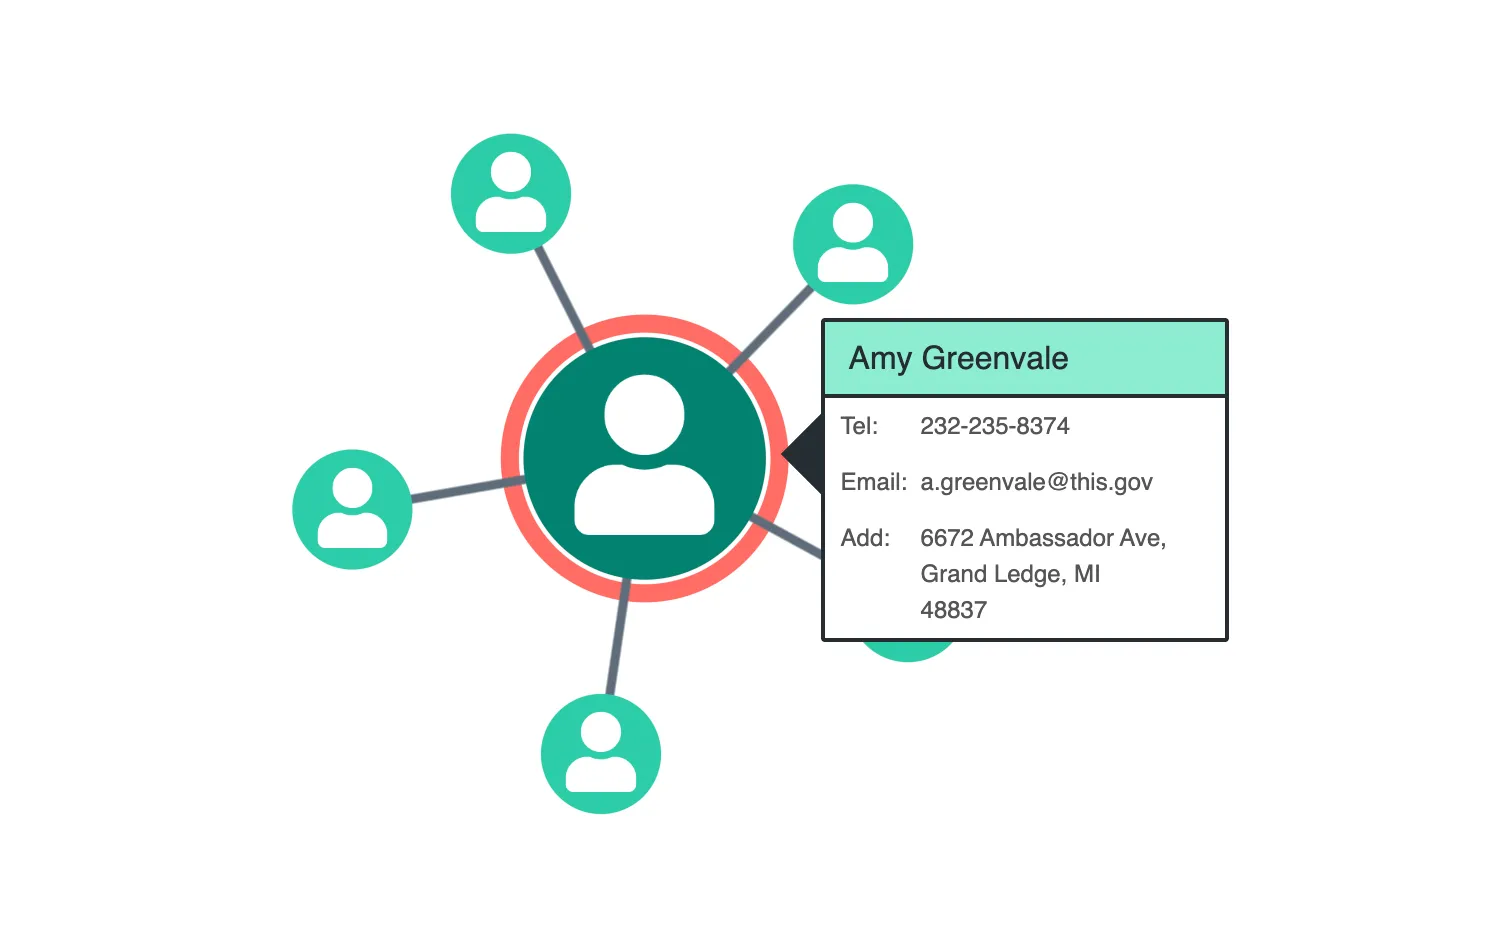
HTML Overlays
Create custom HTML overlays for the chart.
See example
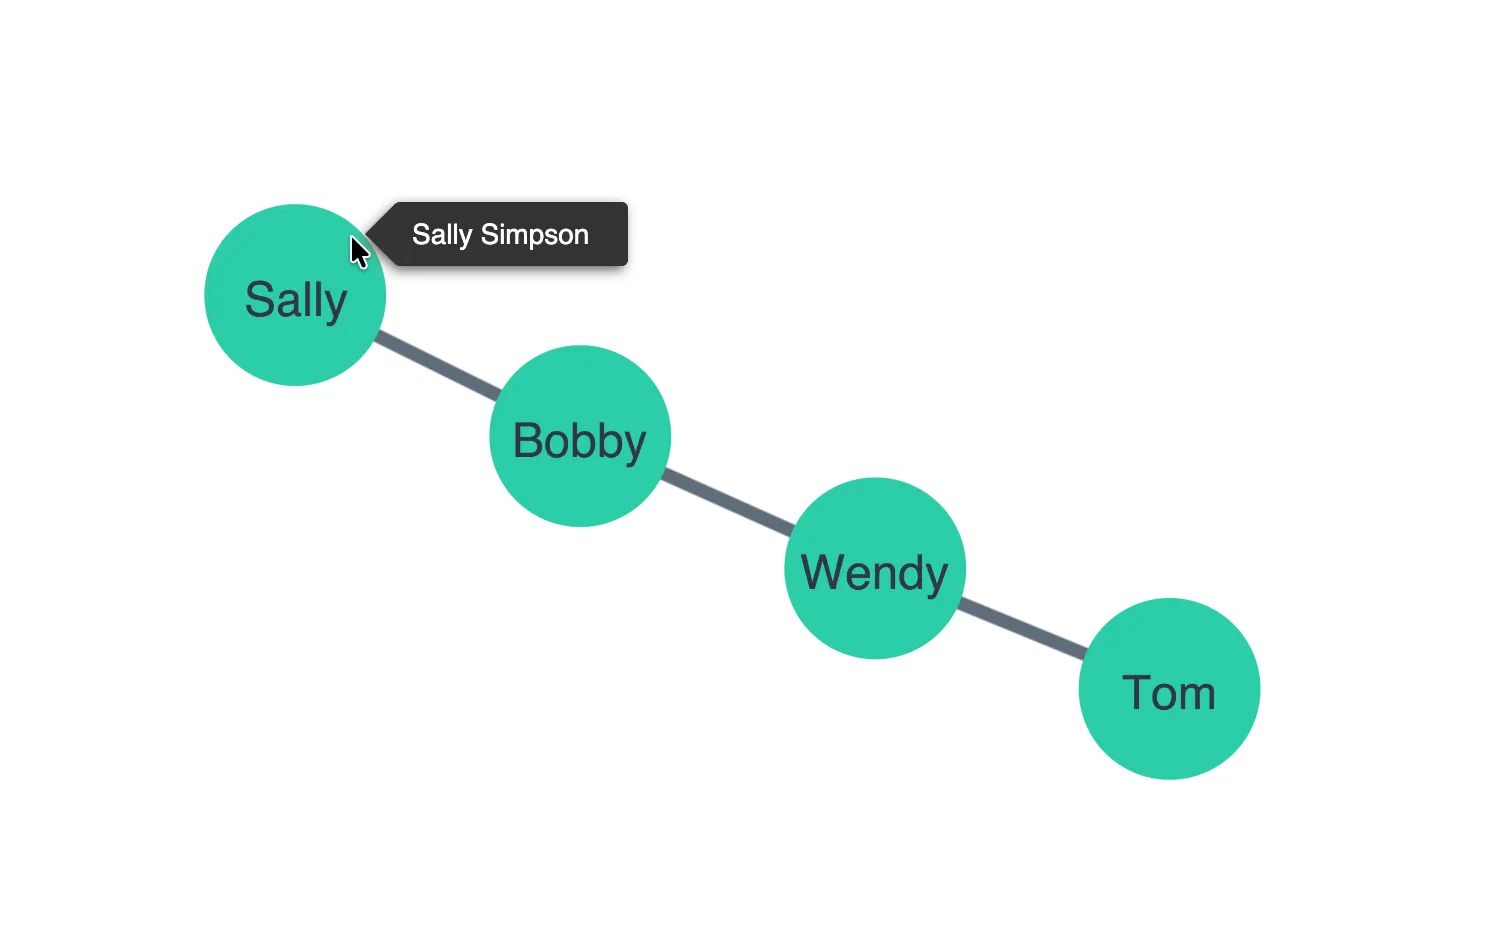
Tooltips
Add more context to items using simple JSX tooltips.
See example
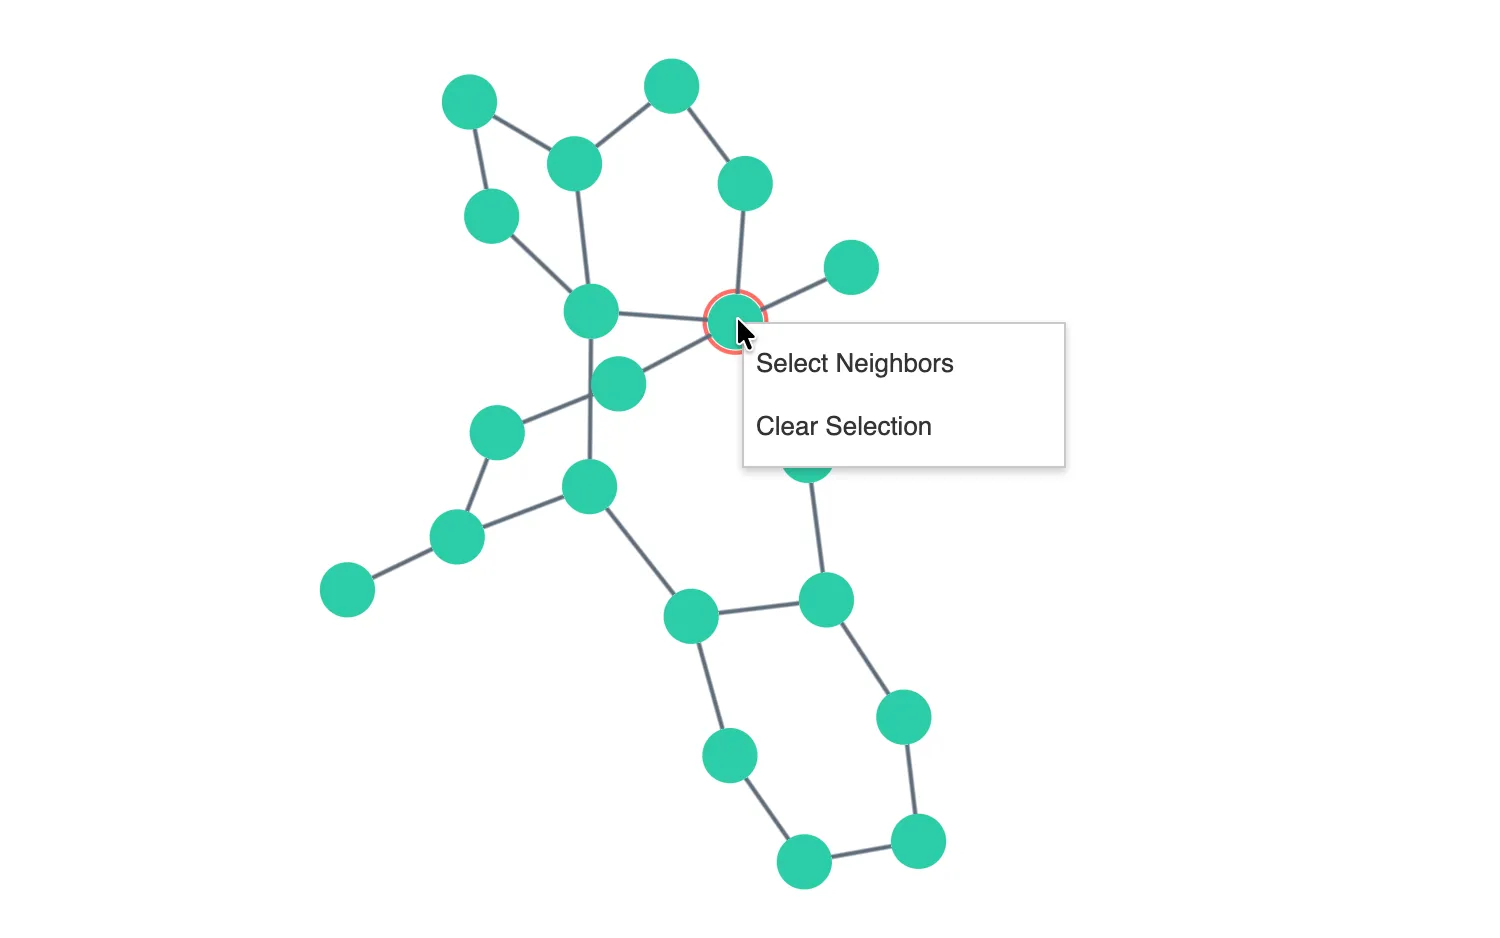
Context Menu
Add a context menu with item-specific options.
See example
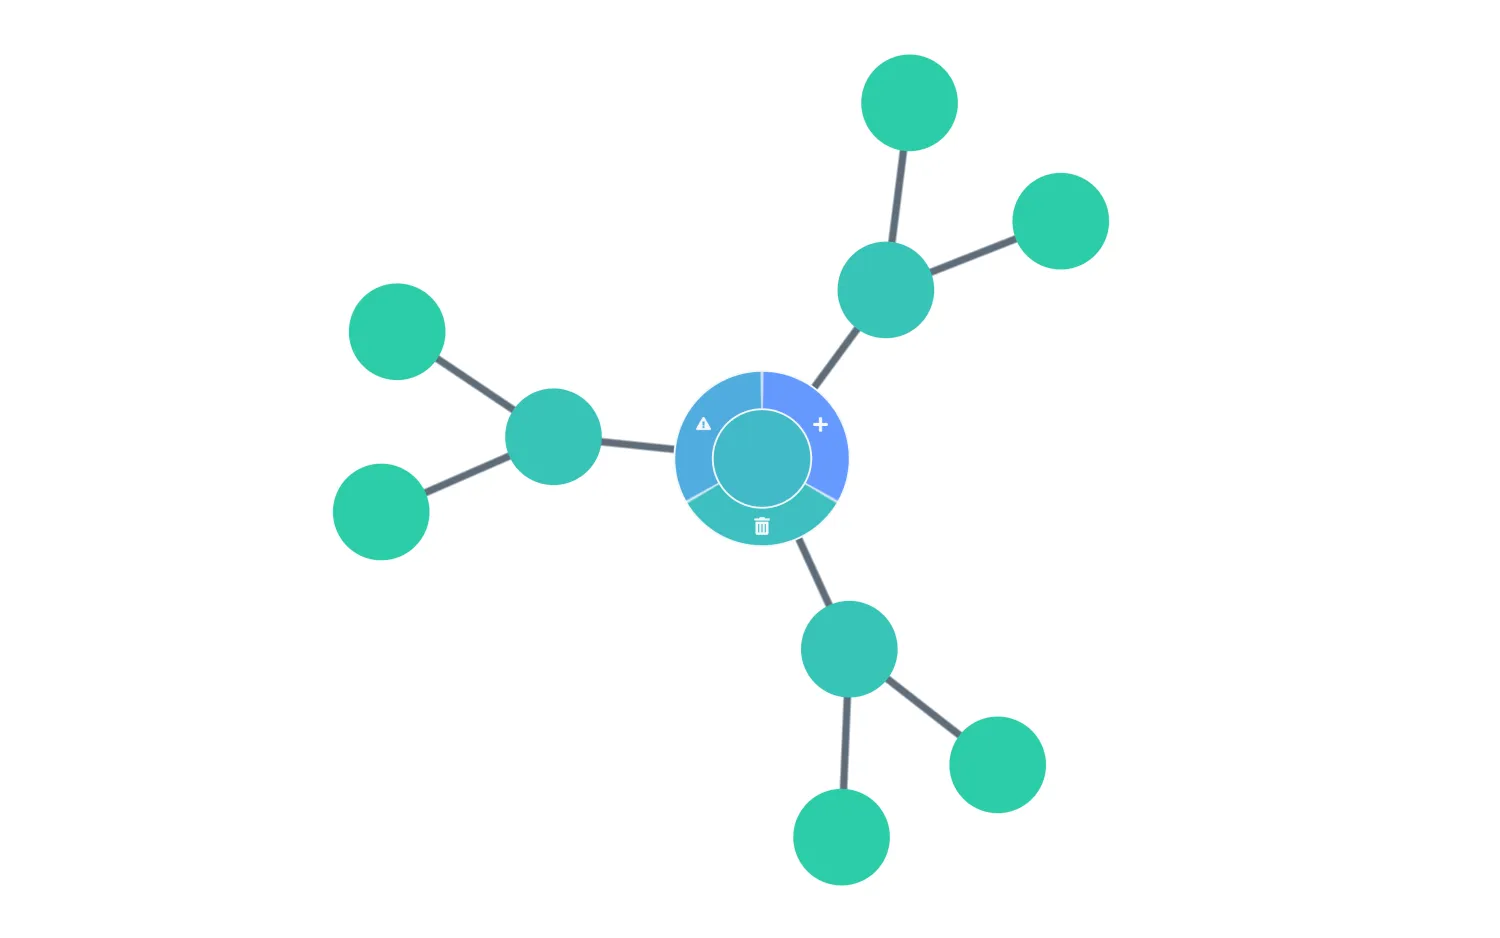
Donut Menu
Use donuts and their segments as interactive controls.
See example
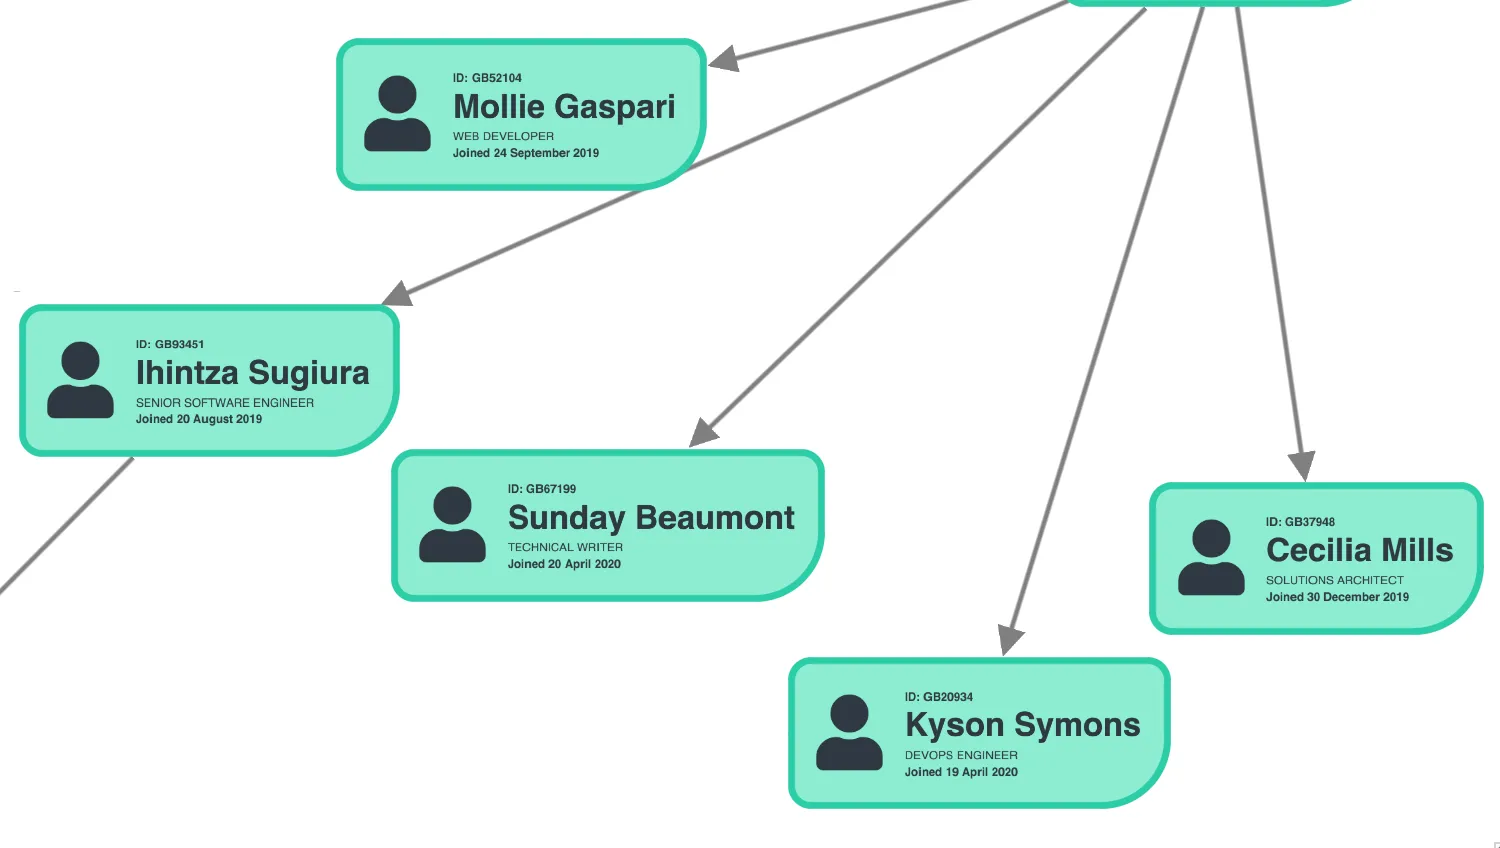
Detail on Zoom
Reveal more detail as you zoom in on the badge nodes.
See example
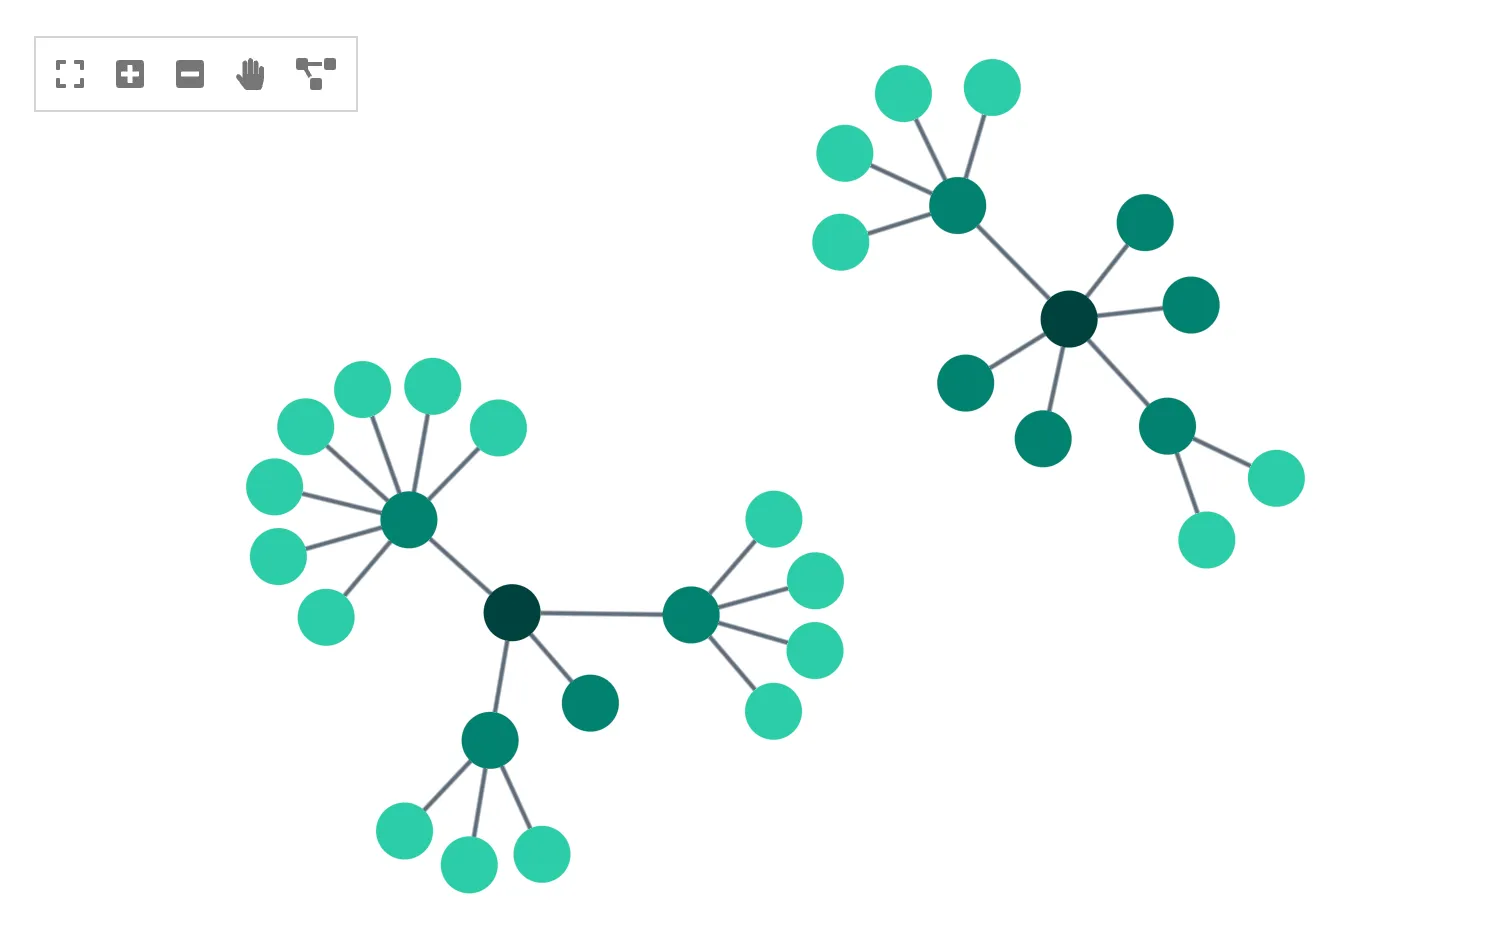
Toolbar
Create a fully custom toolbar for your chart.
See example
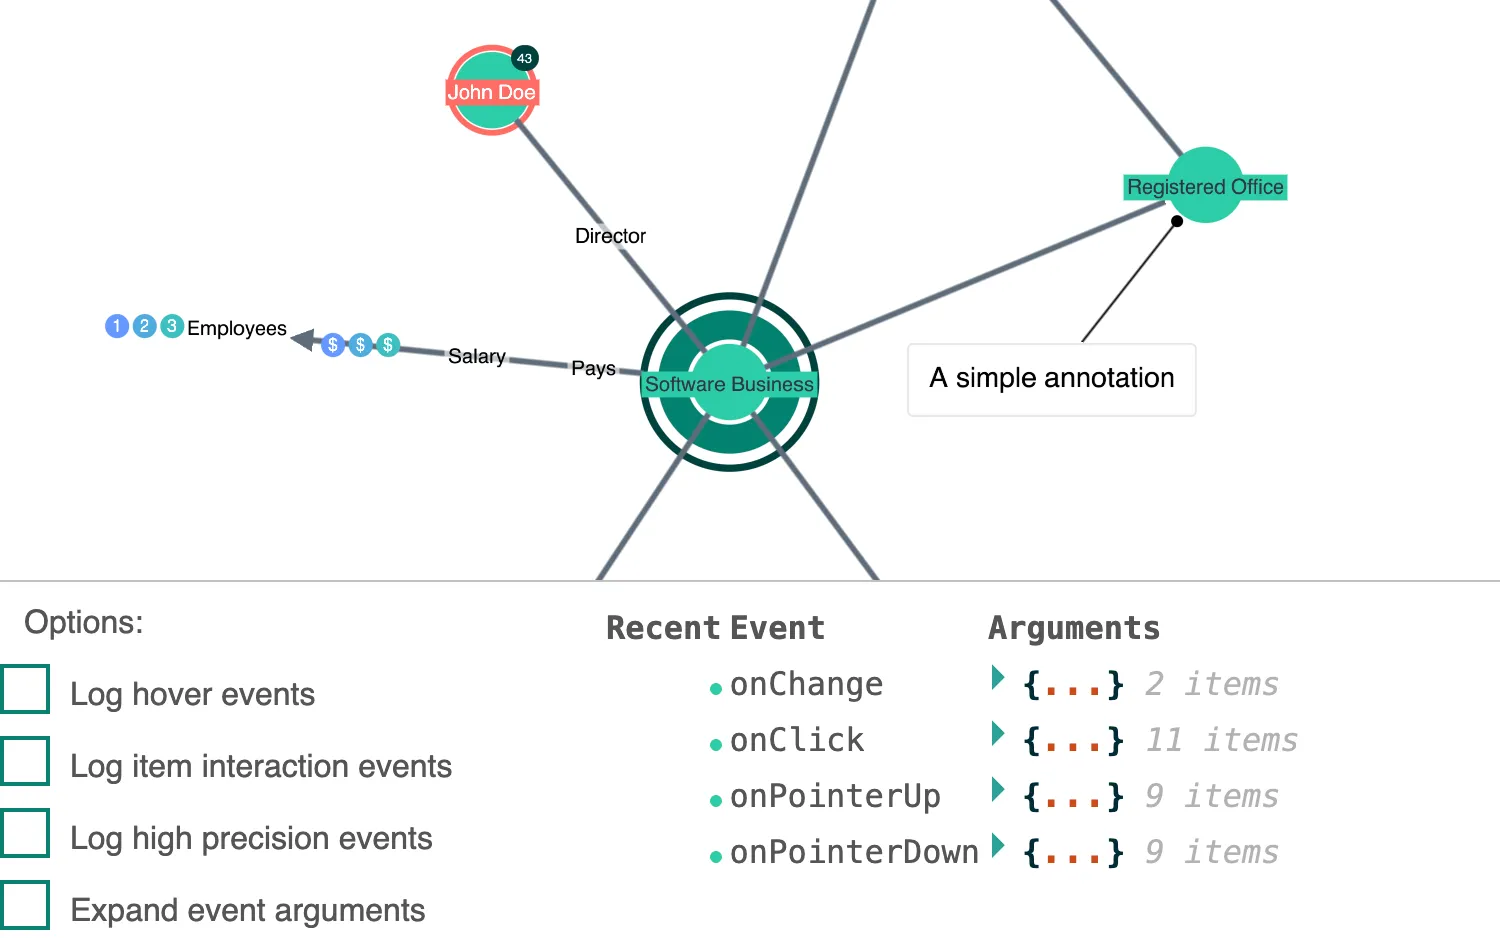
Events
Explore mouse, keyboard and touch events by interacting with chart.
See example
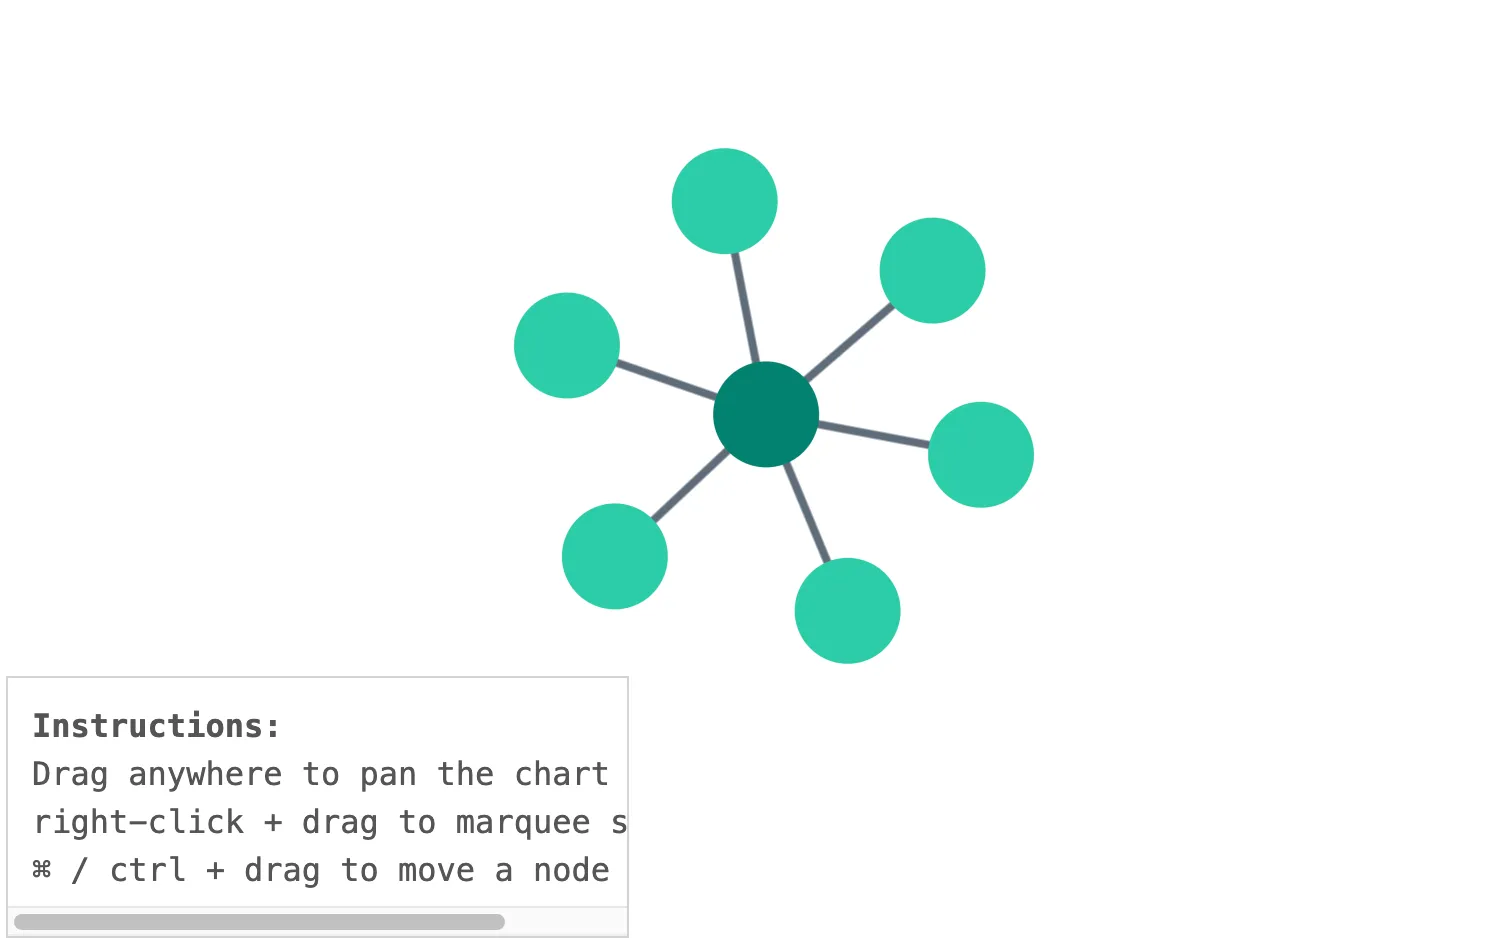
Drag Events
Explore drag events and their customization options.
See example
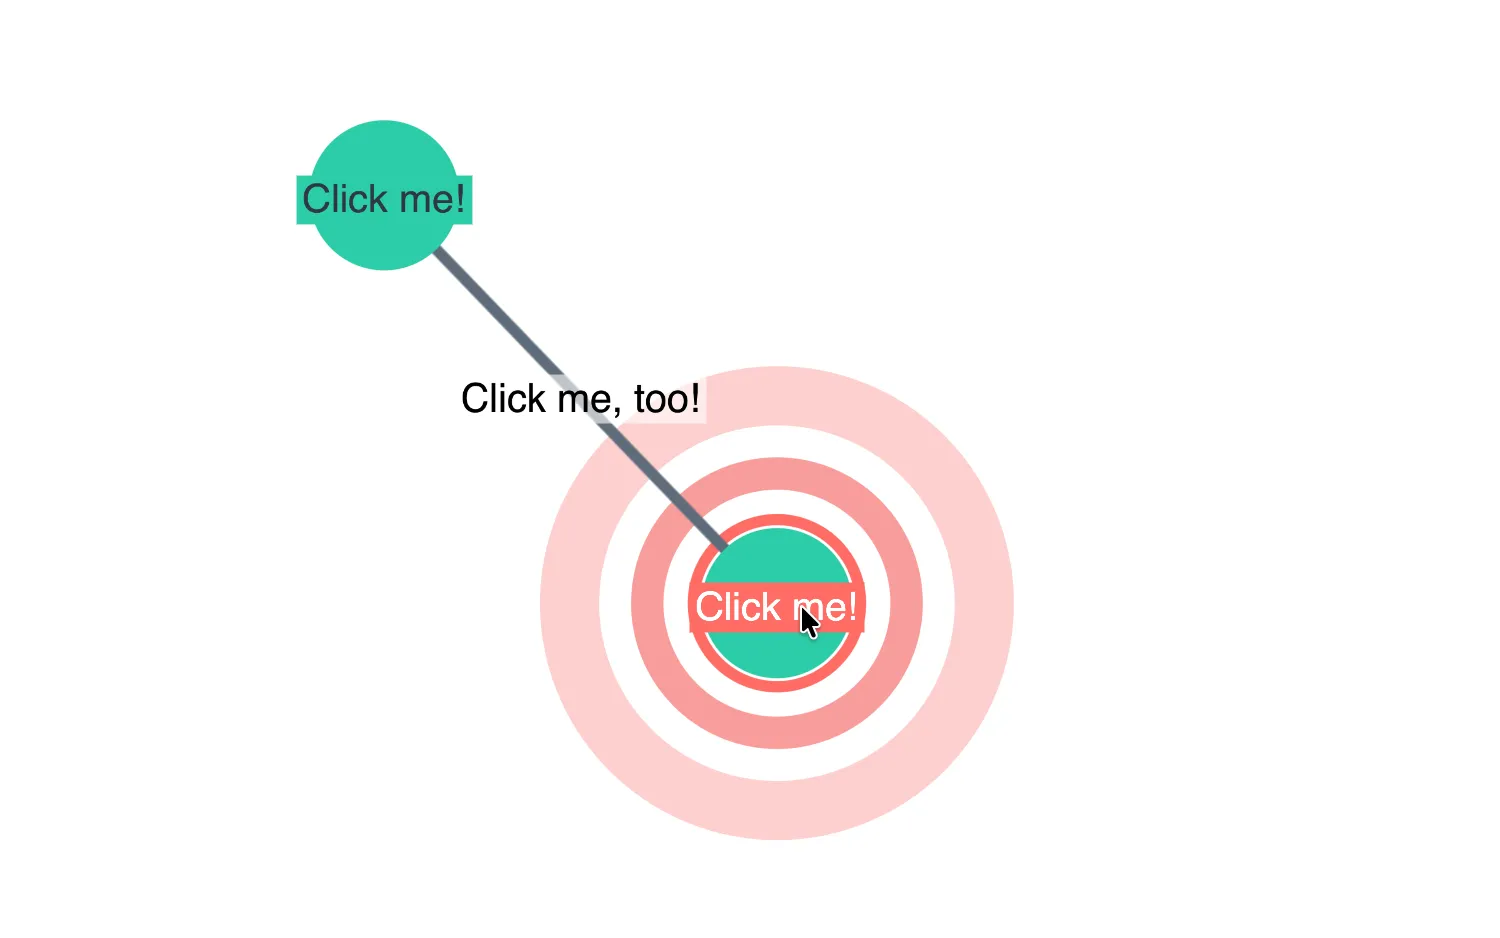
Ping
Ping chart items to make them stand out in the chart.
See example
Layouts
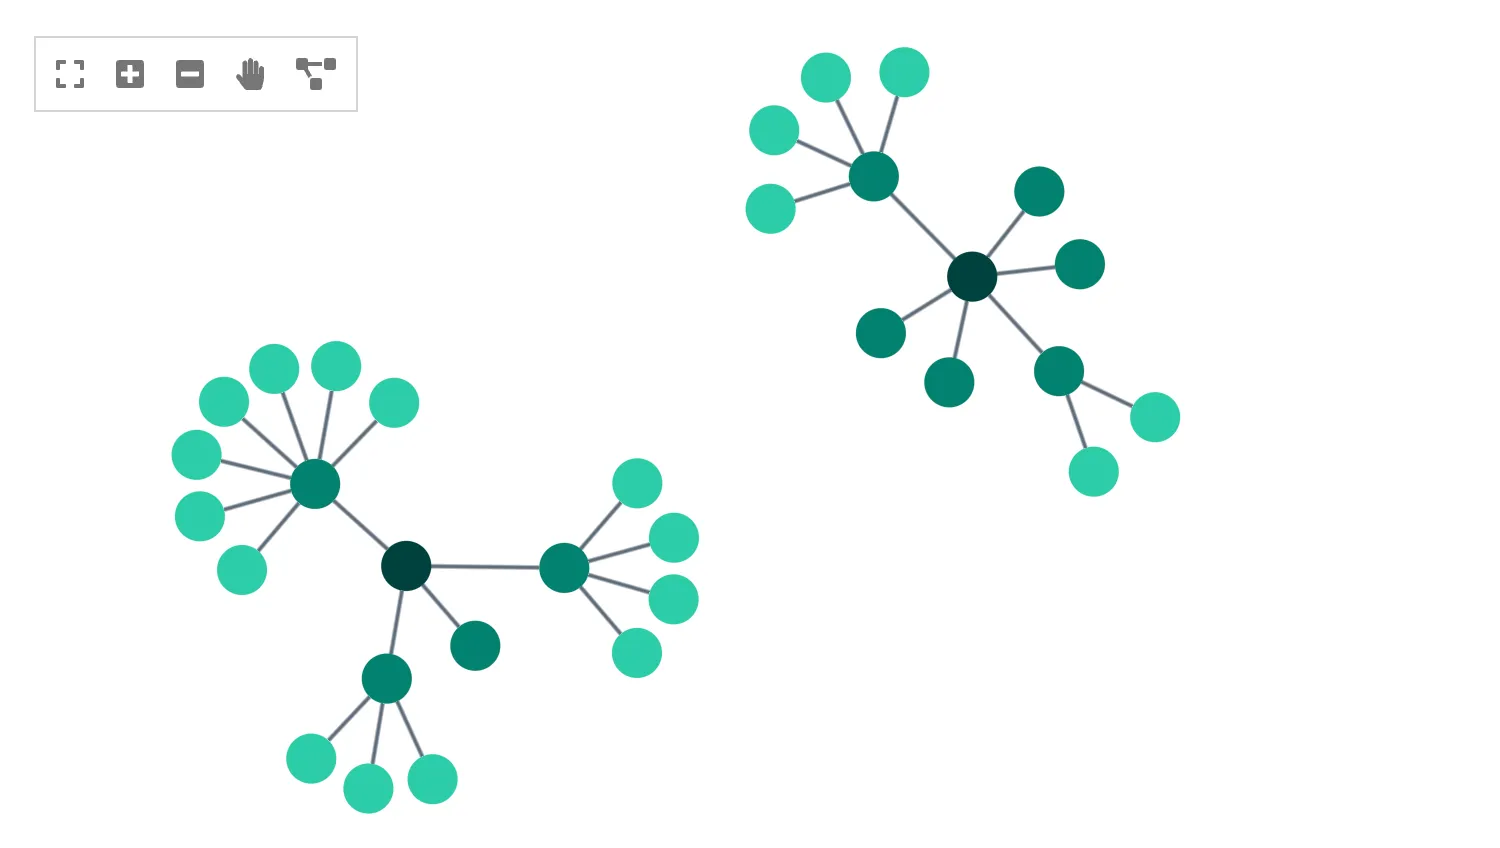
Layouts
Explore how different layouts visualize chart data.
See example
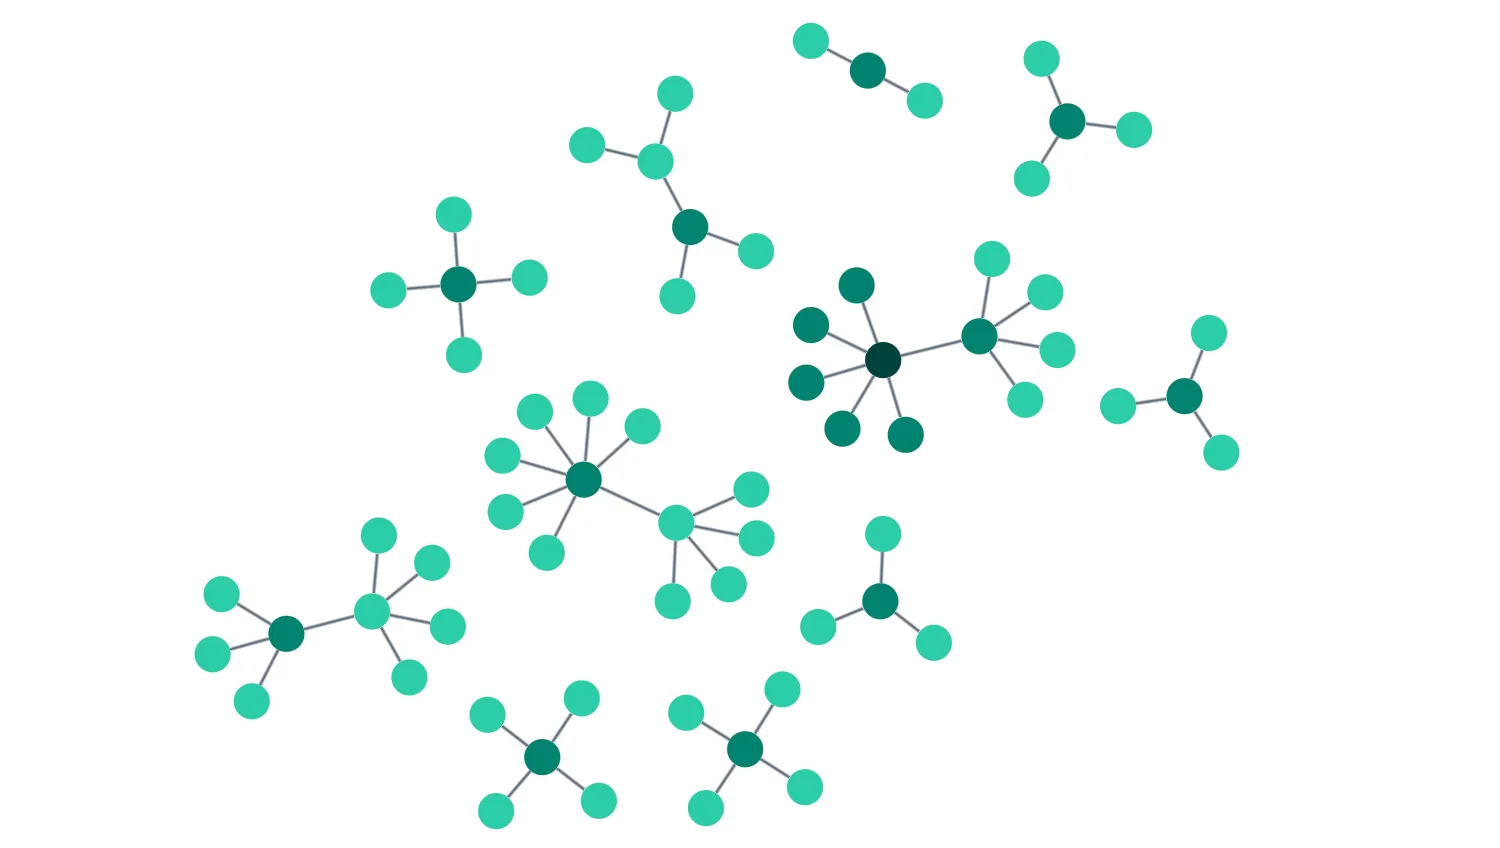
Adaptive Layouts
Add more data to chart to reveal new connections.
See example
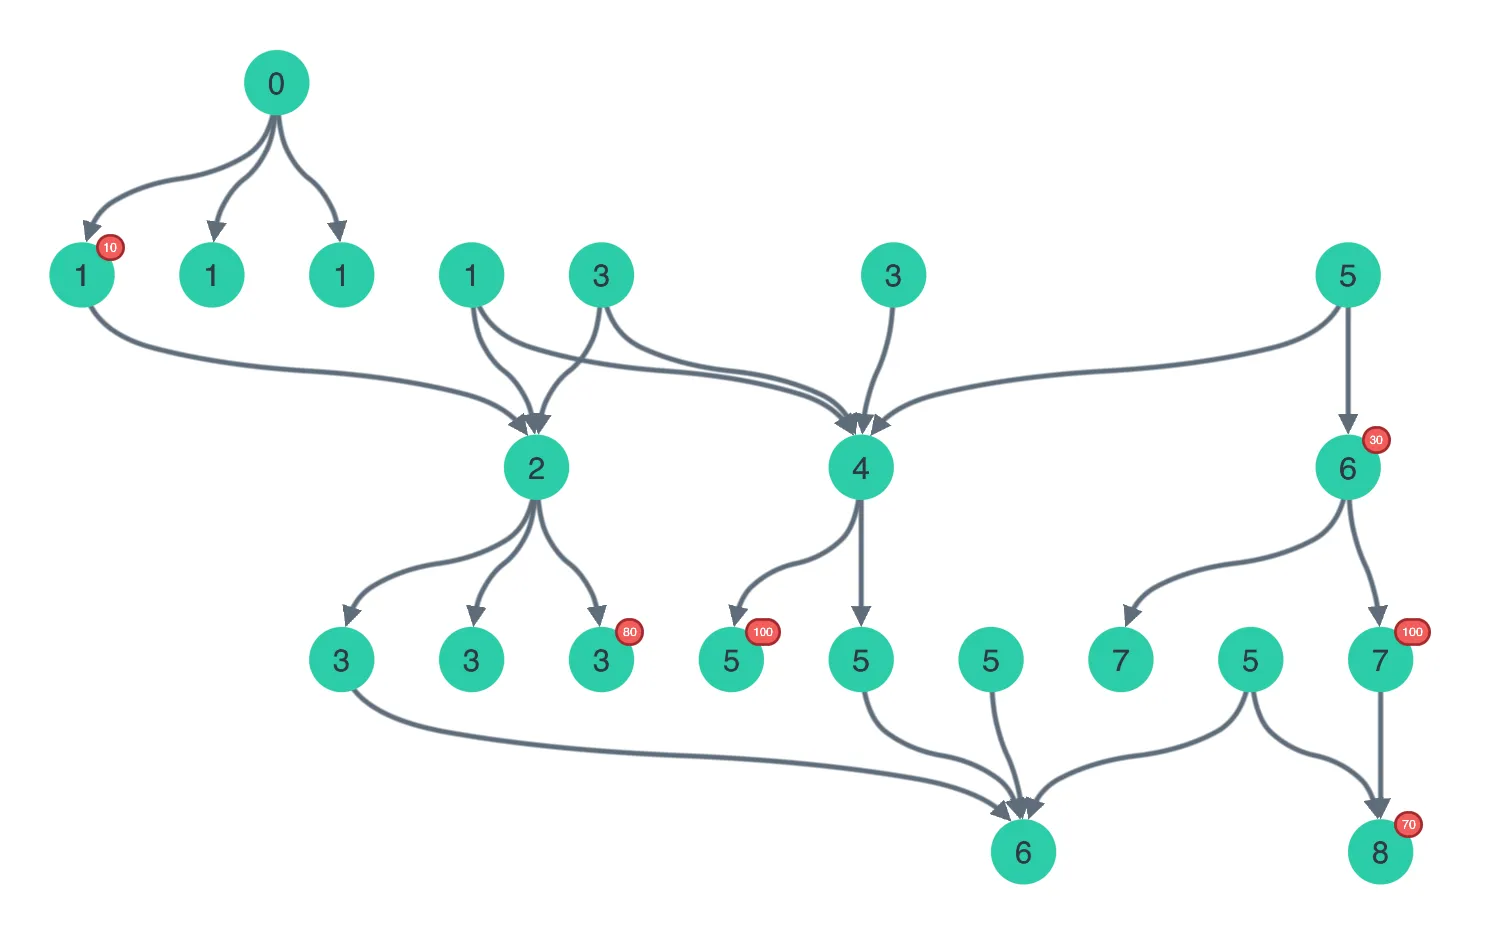
Hierarchies
Visualize data spanning multiple levels.
See example
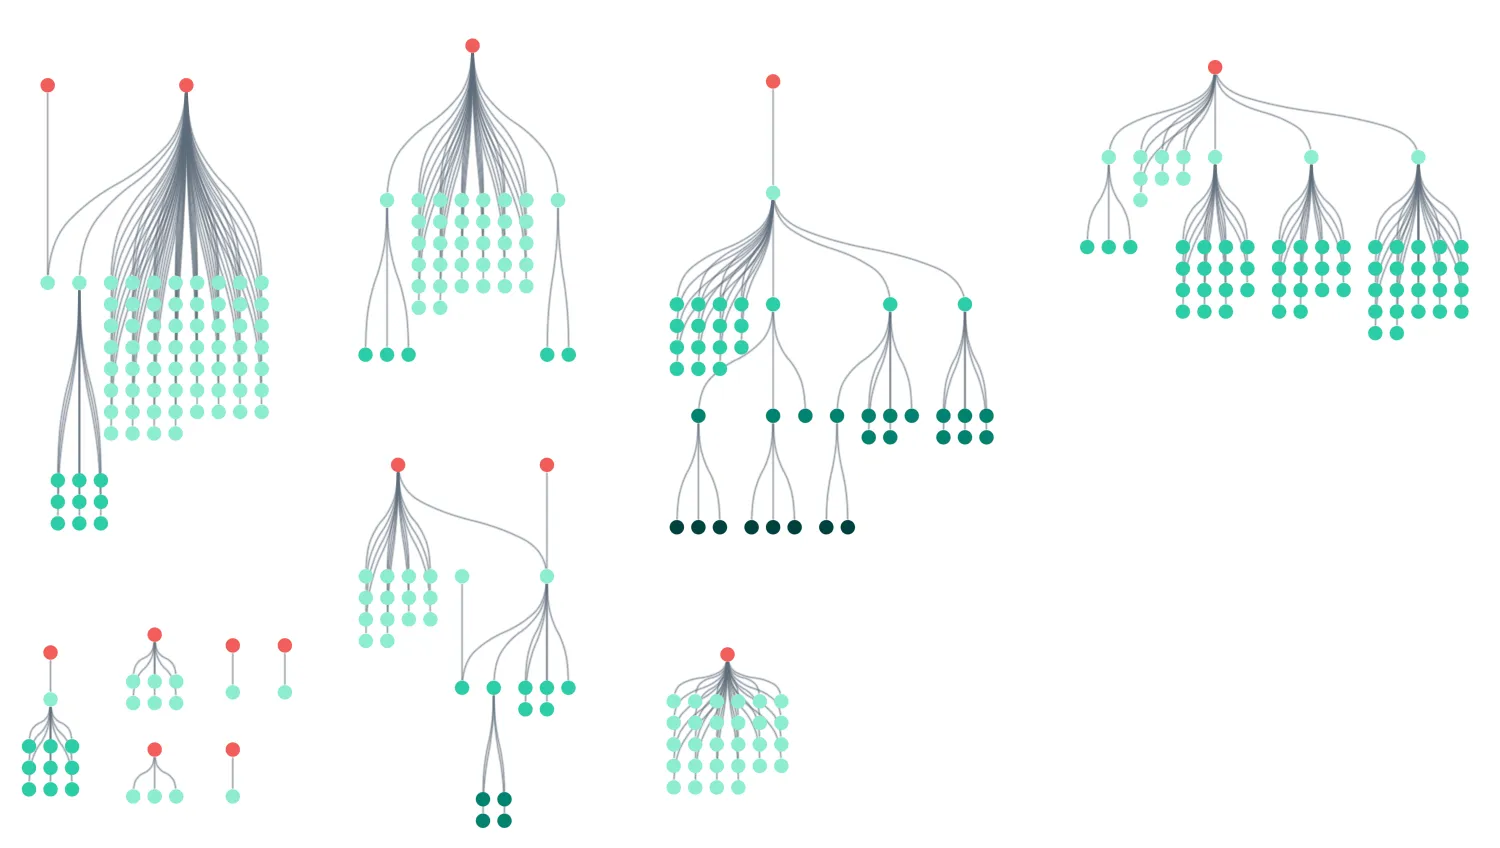
Navigating Large Hierarchies
Arrange large sequences of data into grids to get a better view.
See example
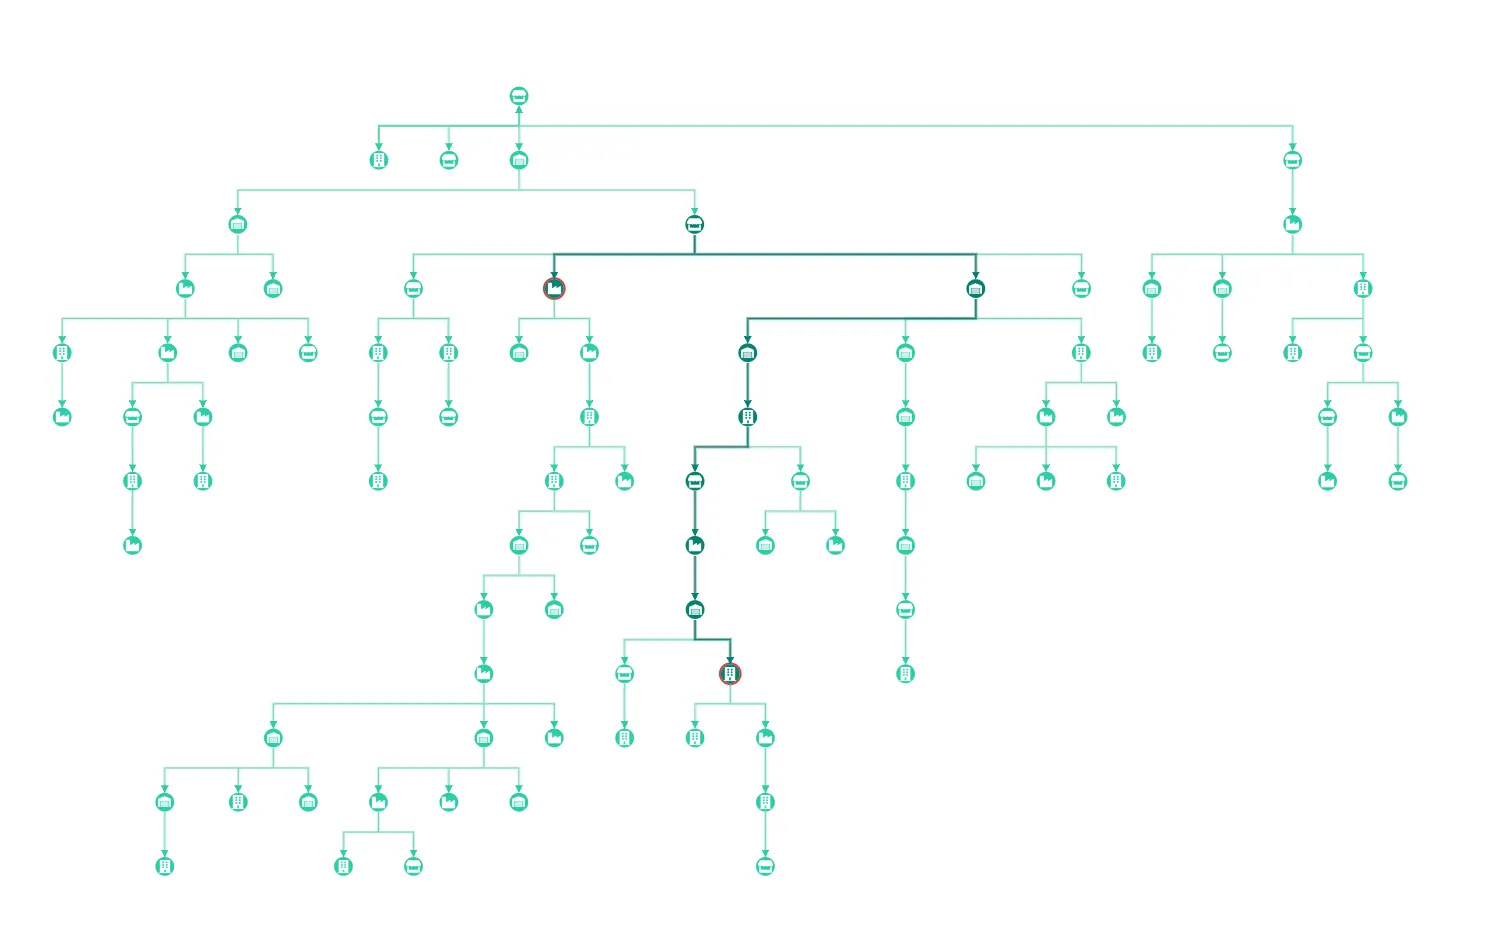
Angled Links
Visualize hierarchical data with angled links.
See example
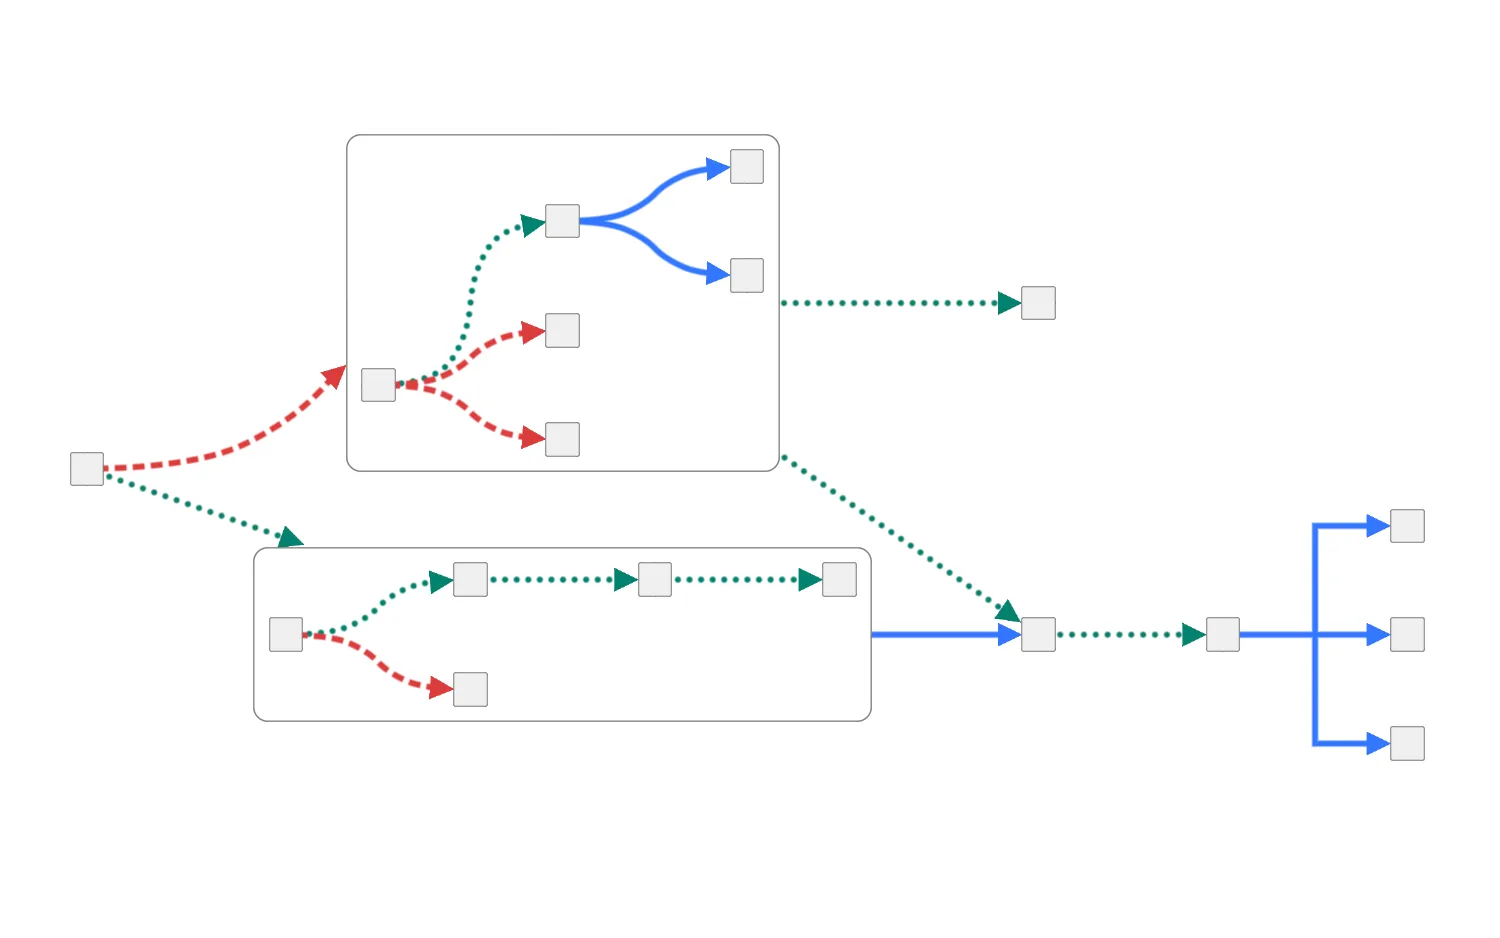
Mixed Link Shapes
Use multiple link shapes to show different relationships.
See example
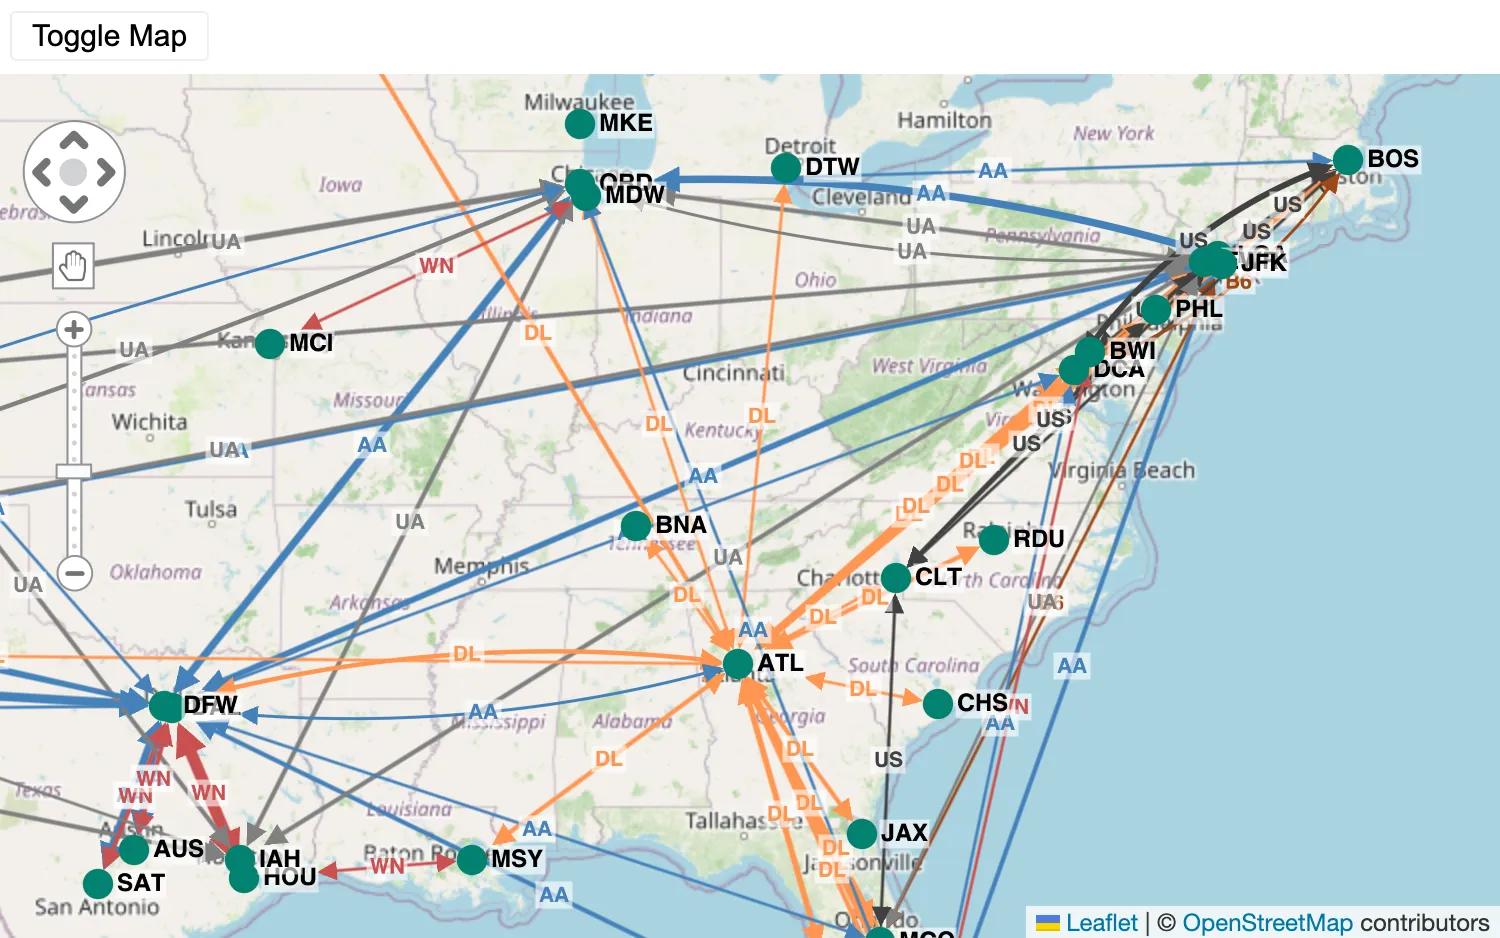
Positioning Nodes with Coordinates
Use coordinates to position nodes over a Leaflet map.
See example
Graph Analysis
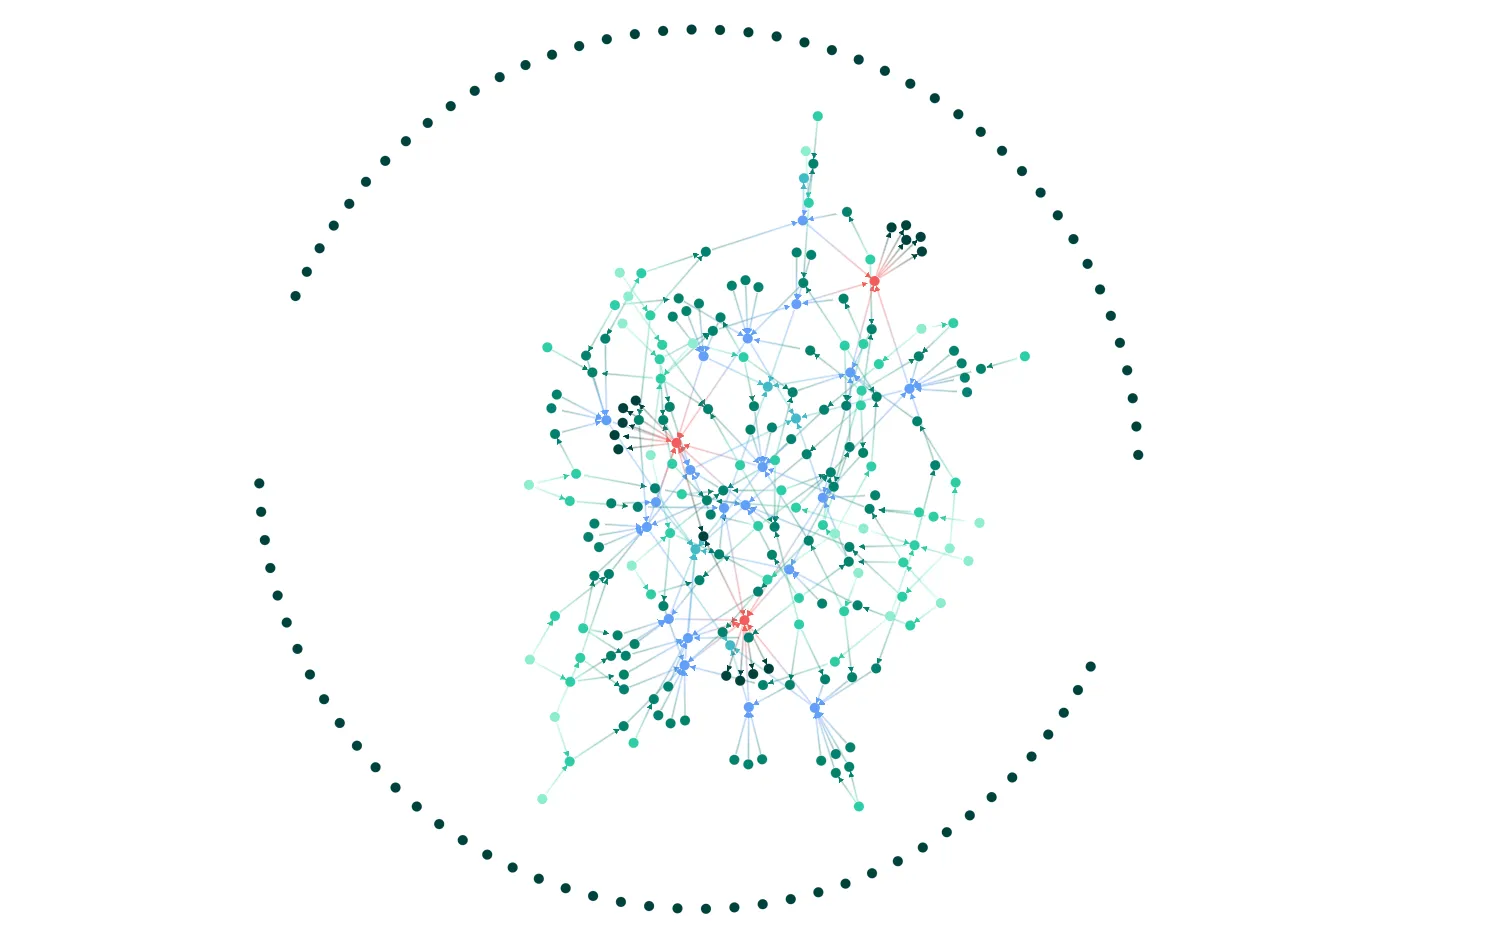
Impact Analysis
Reveal the dependencies and significance of nodes.
See example
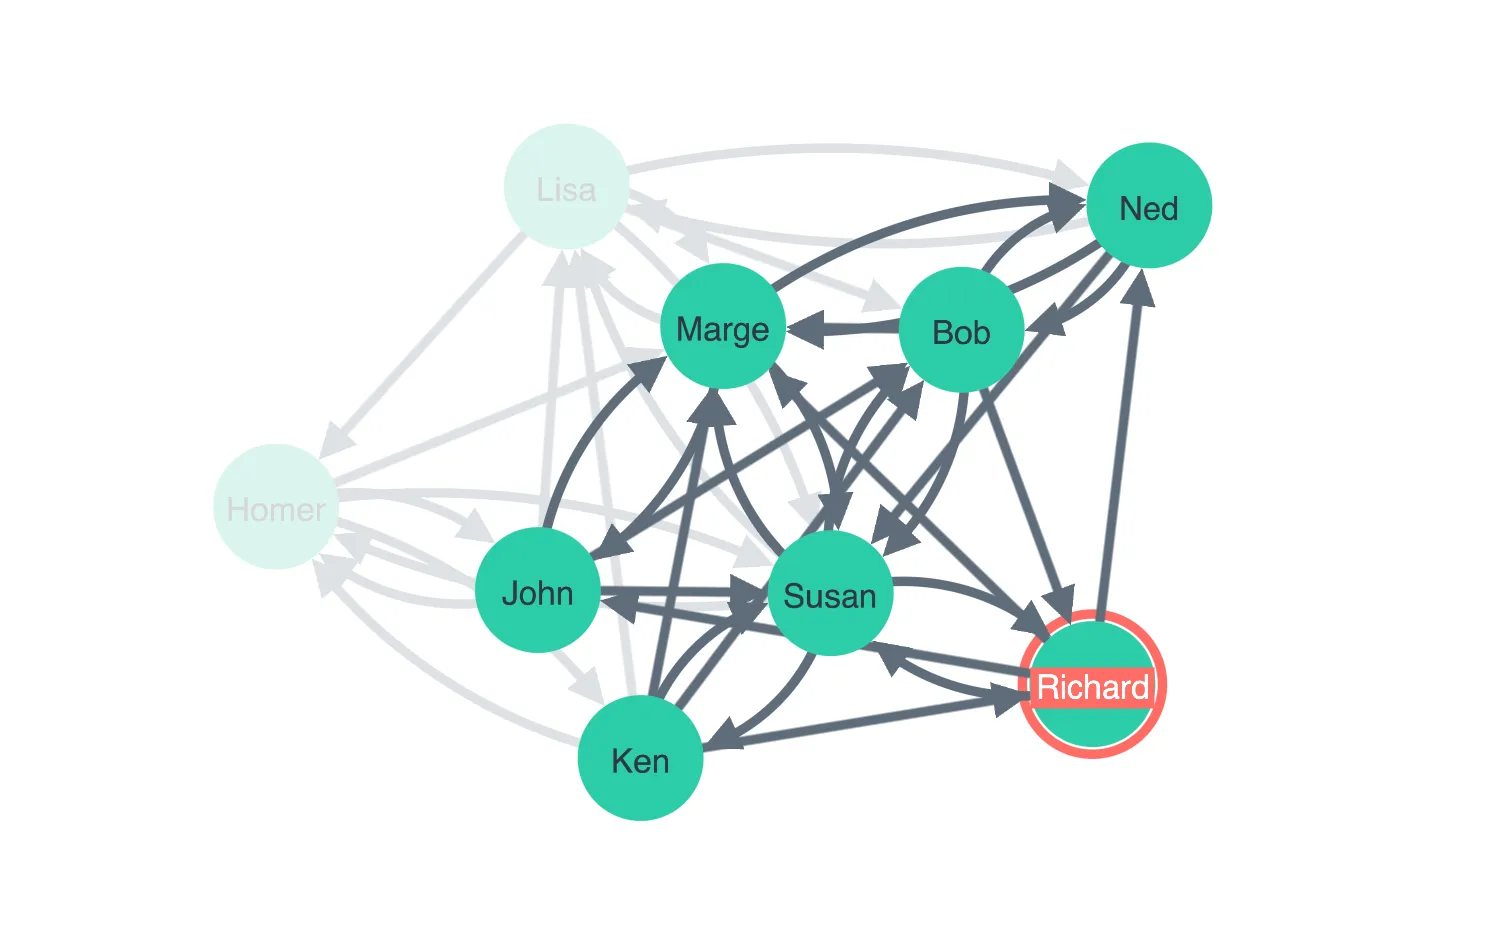
Neighbors
Foreground related neighbors by fading the rest of items.
See example
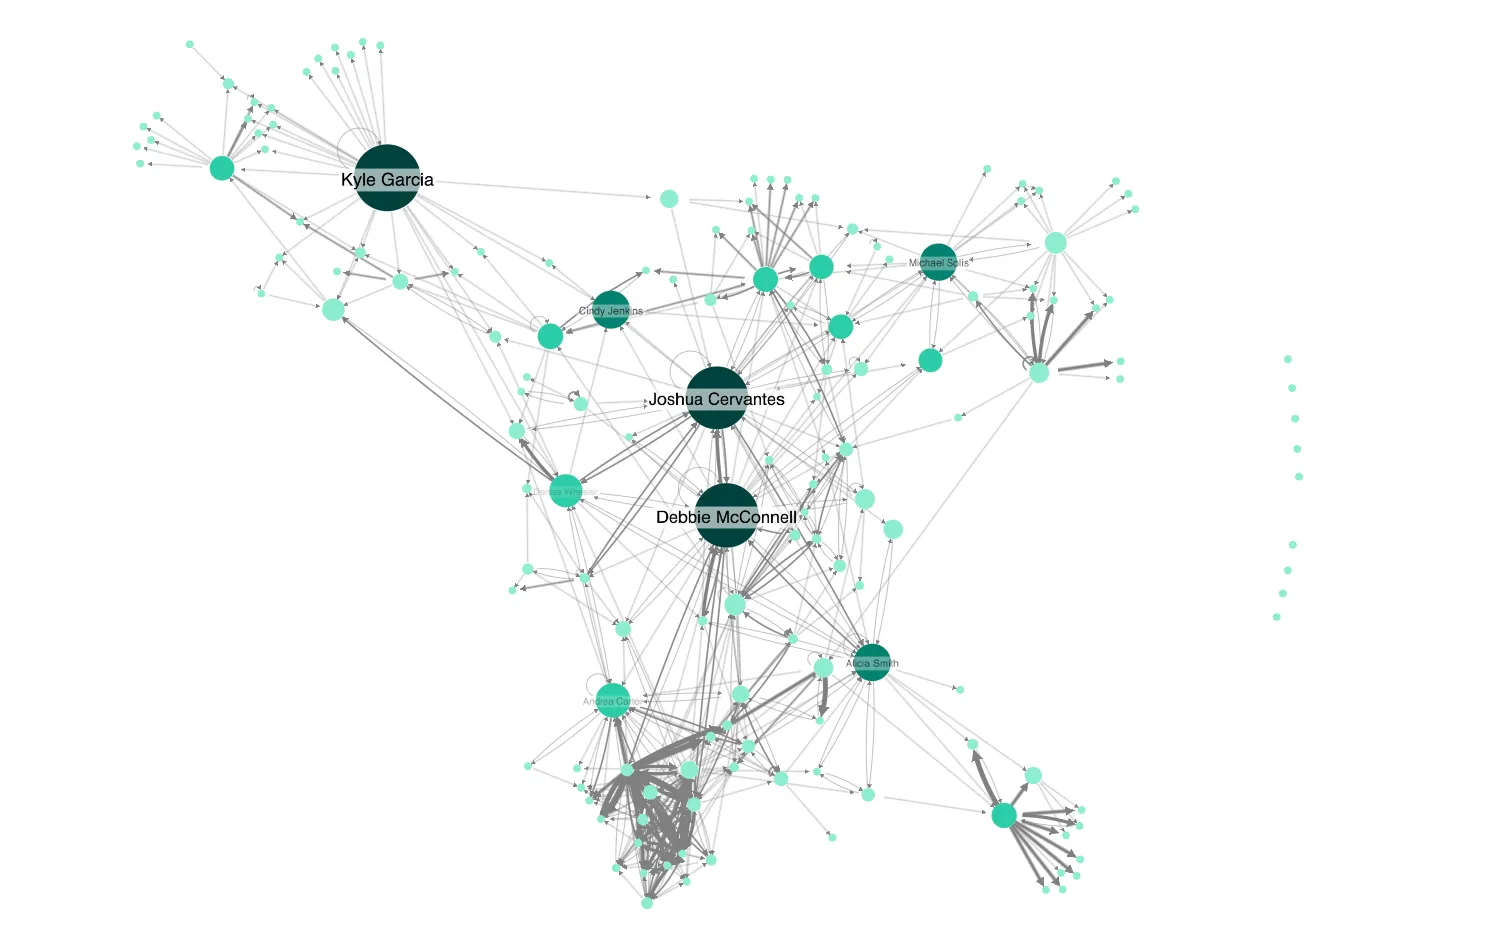
Social Network Analysis
Explore chart connections using different centrality measures.
See example
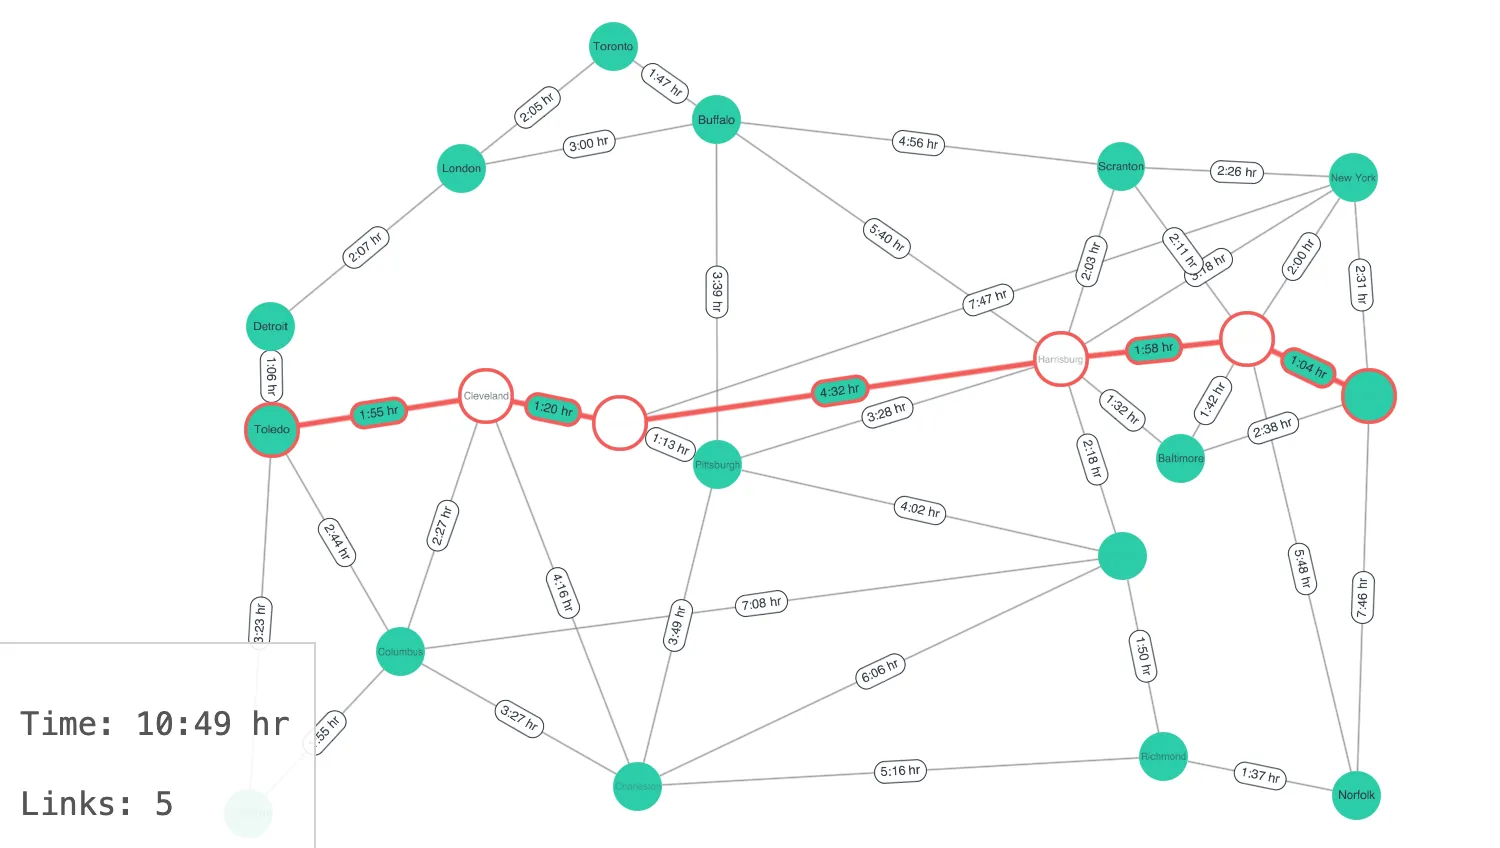
Path Finding
Find shortest paths between any two items in the chart.
See example
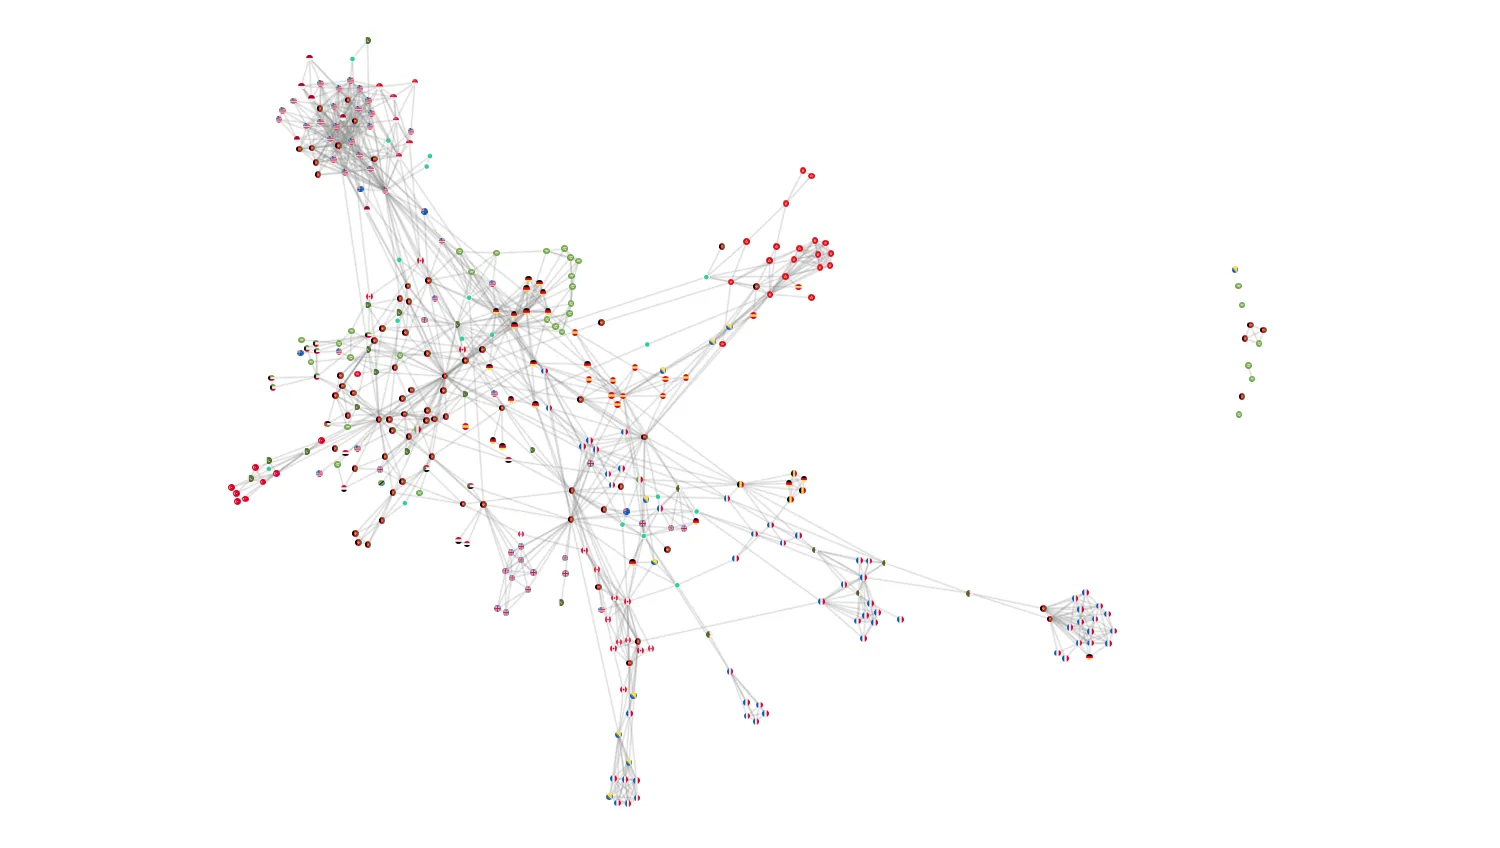
kCores
Explore the kCore scores of nodes in the chart.
See example
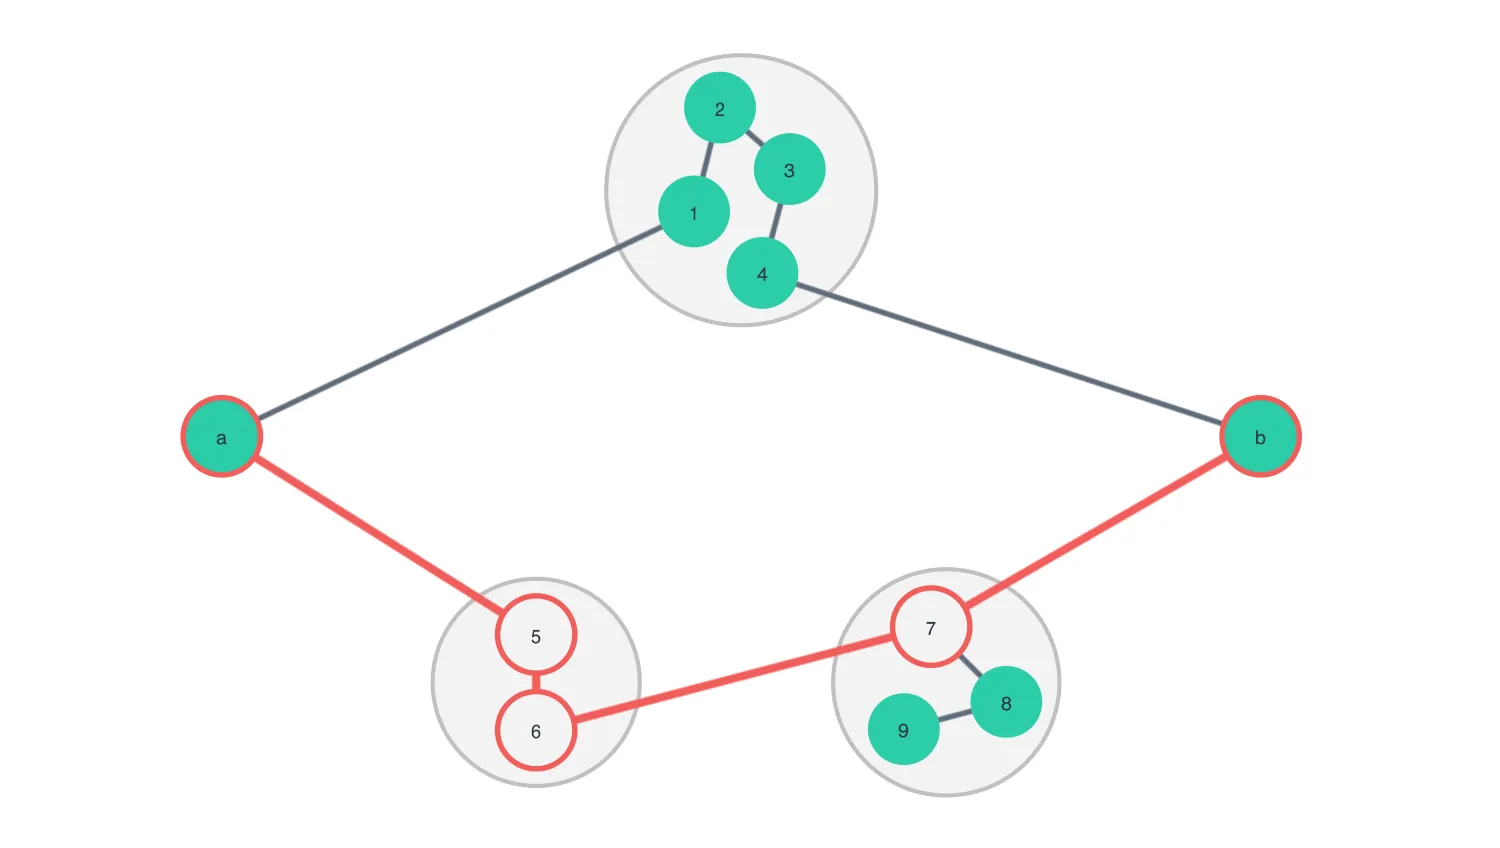
Combo Path Finding
Find shortest paths between items inside combos.
See example
Combine Nodes
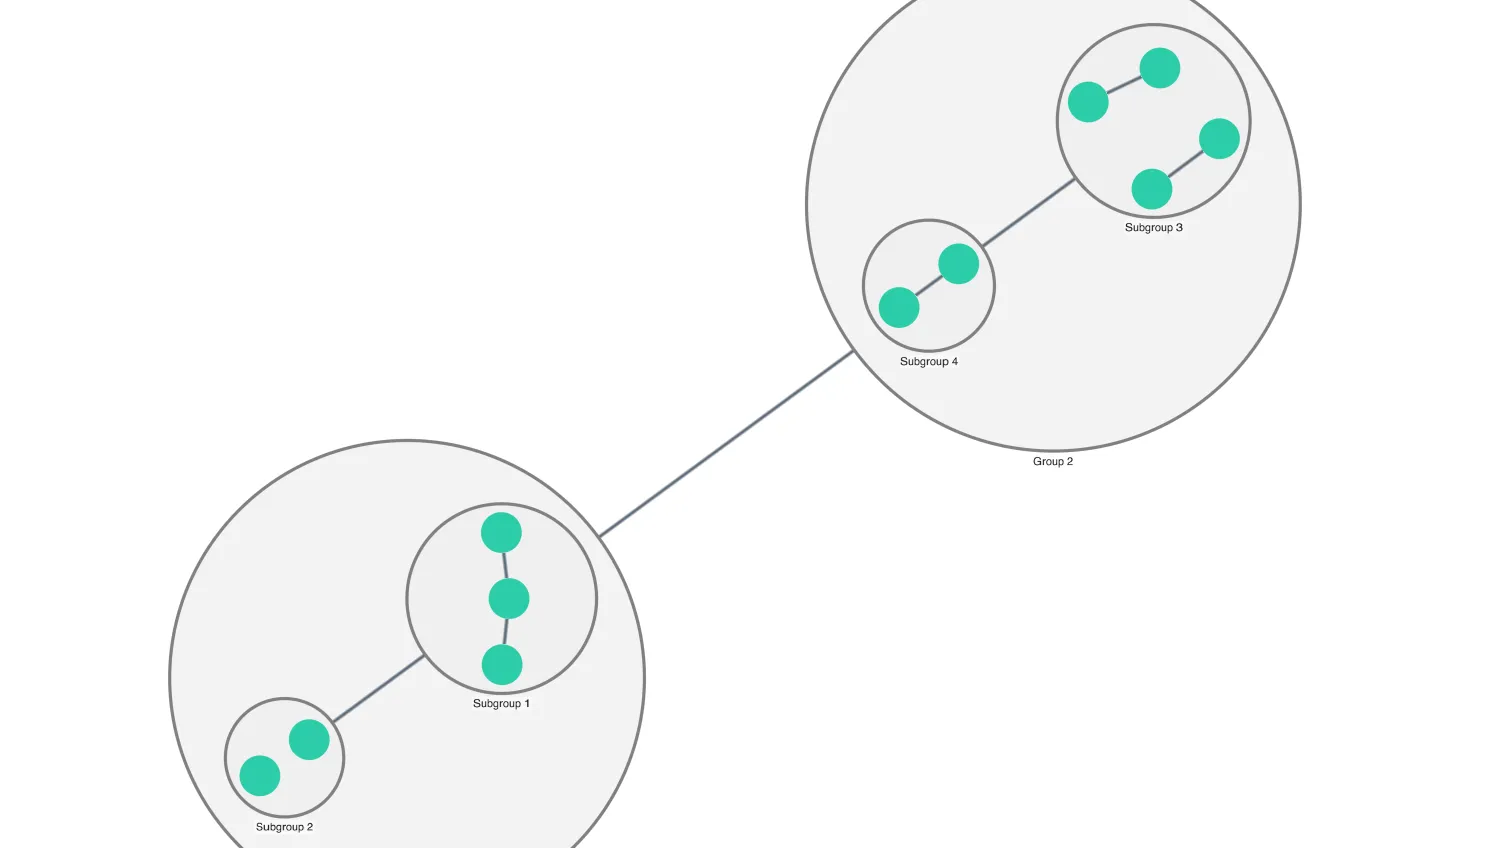
Basic Combos
Combine related nodes to simplify networks.
See example
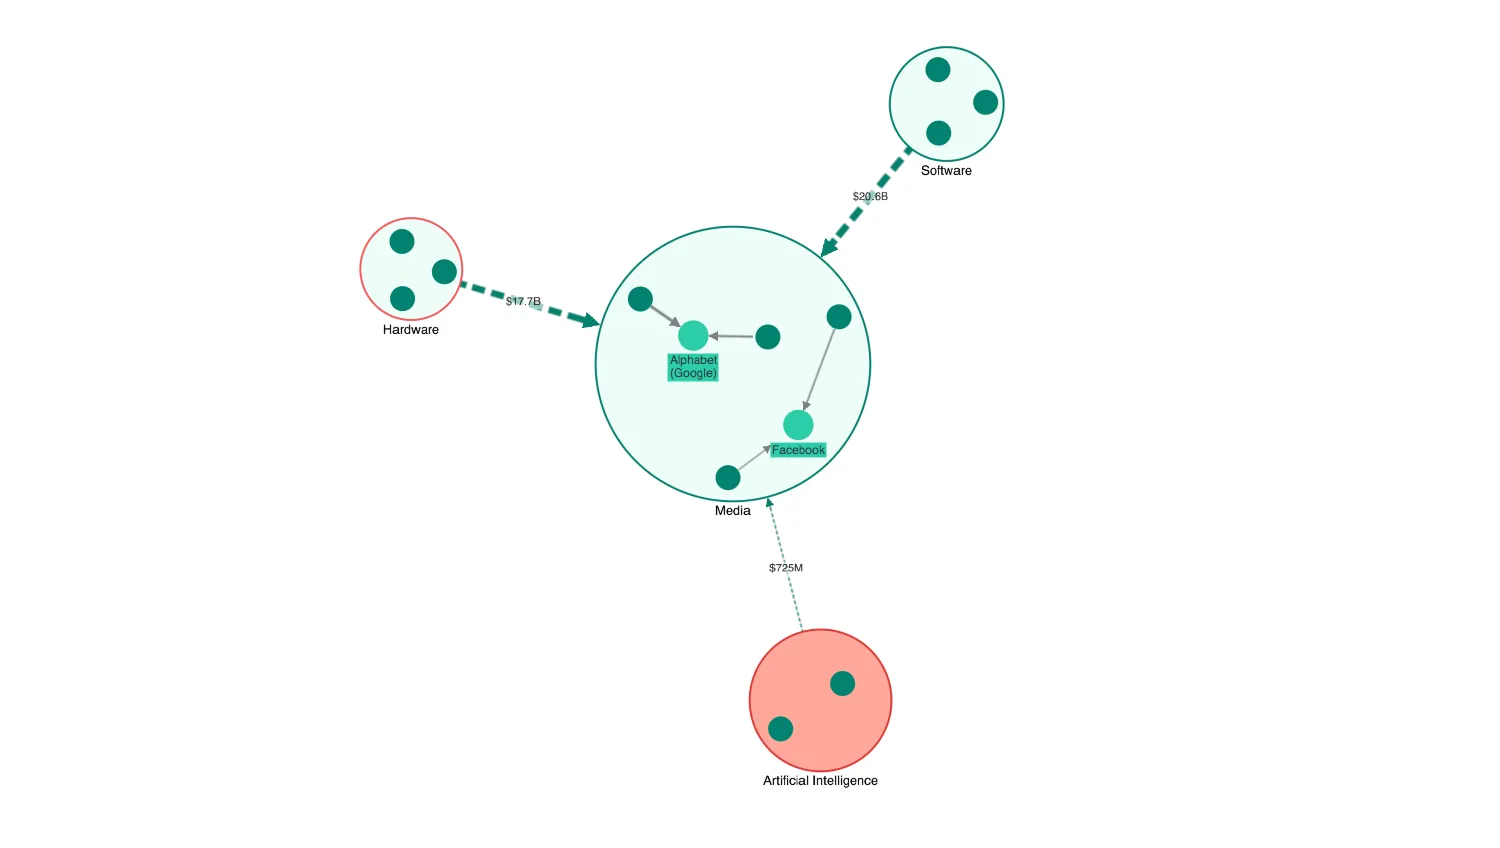
Styling Combos
Style combo nodes and combo links.
See example
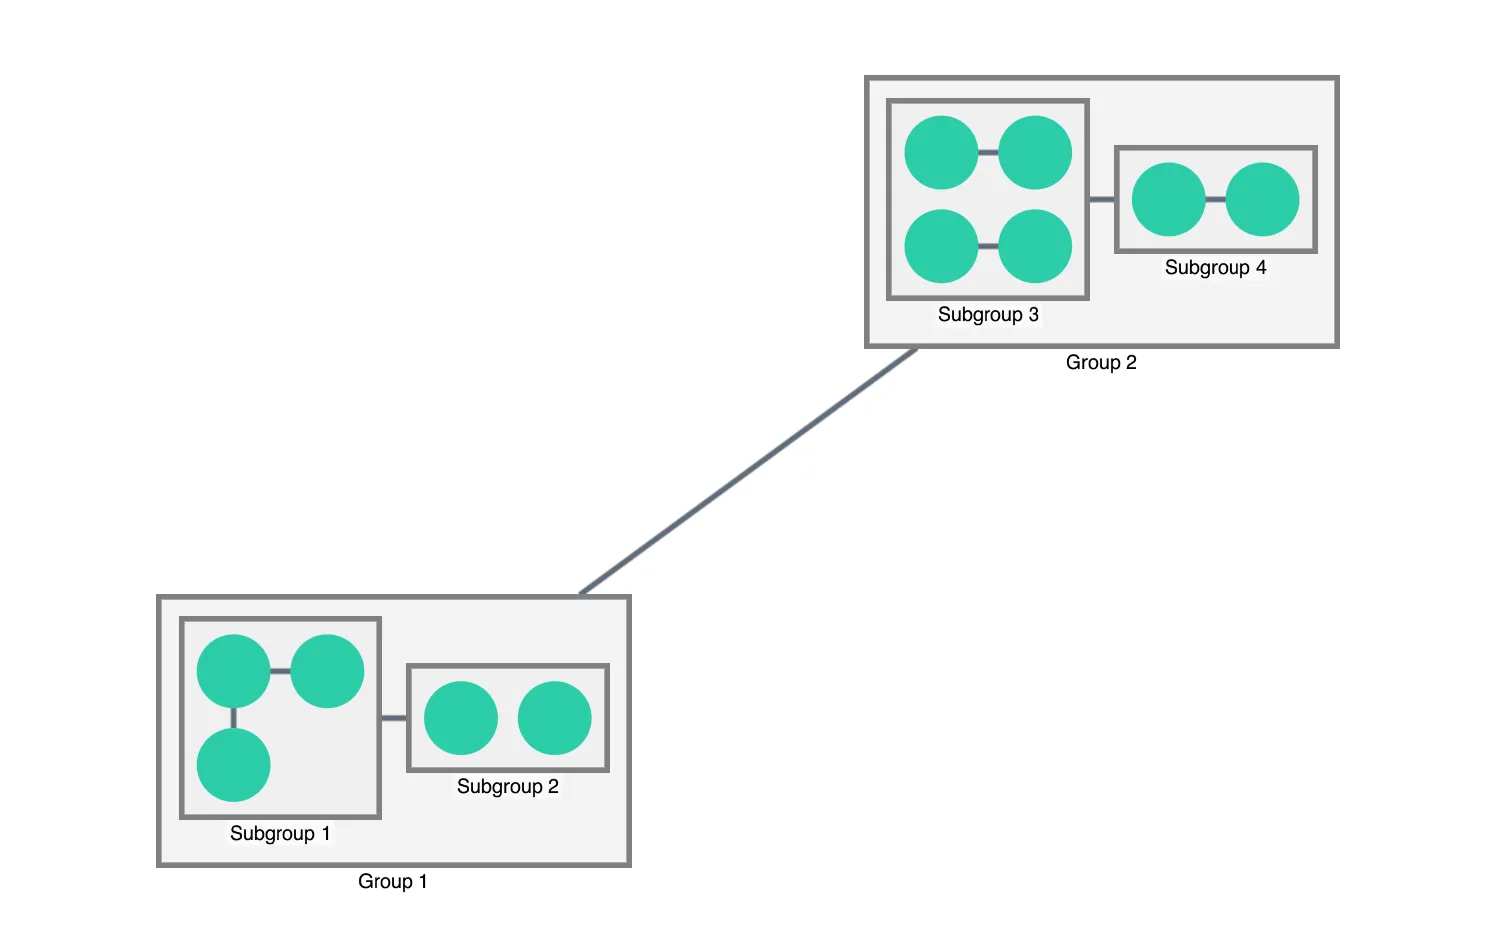
Rectangular Combos
Create space-efficient rectangular combos with grid arrangements.
See example
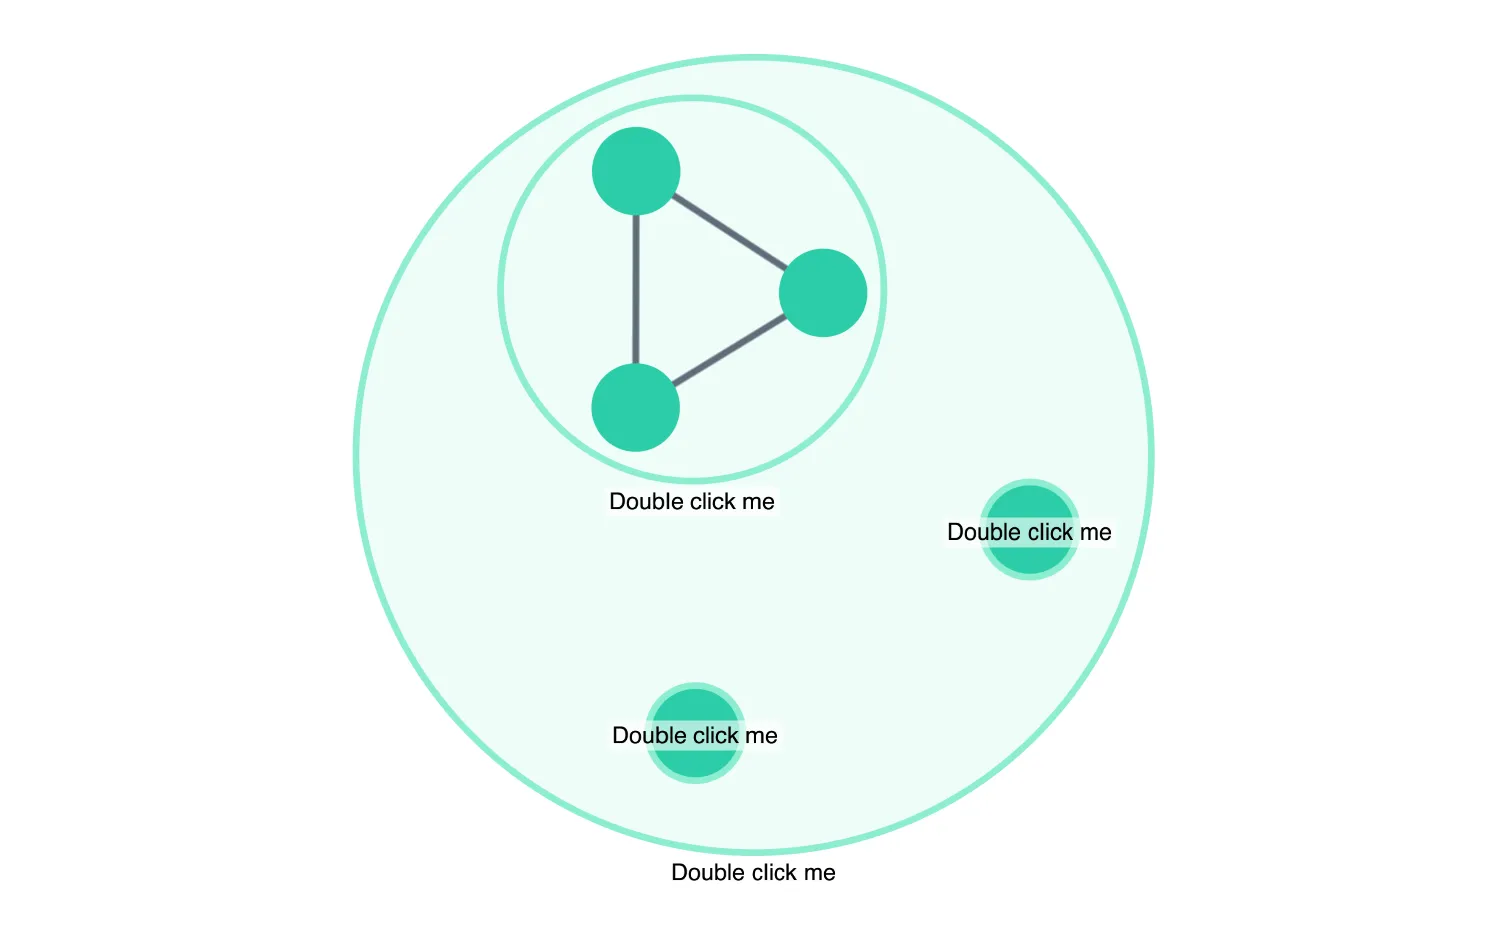
Open and Close Combos
Explore open and closed combos.
See example
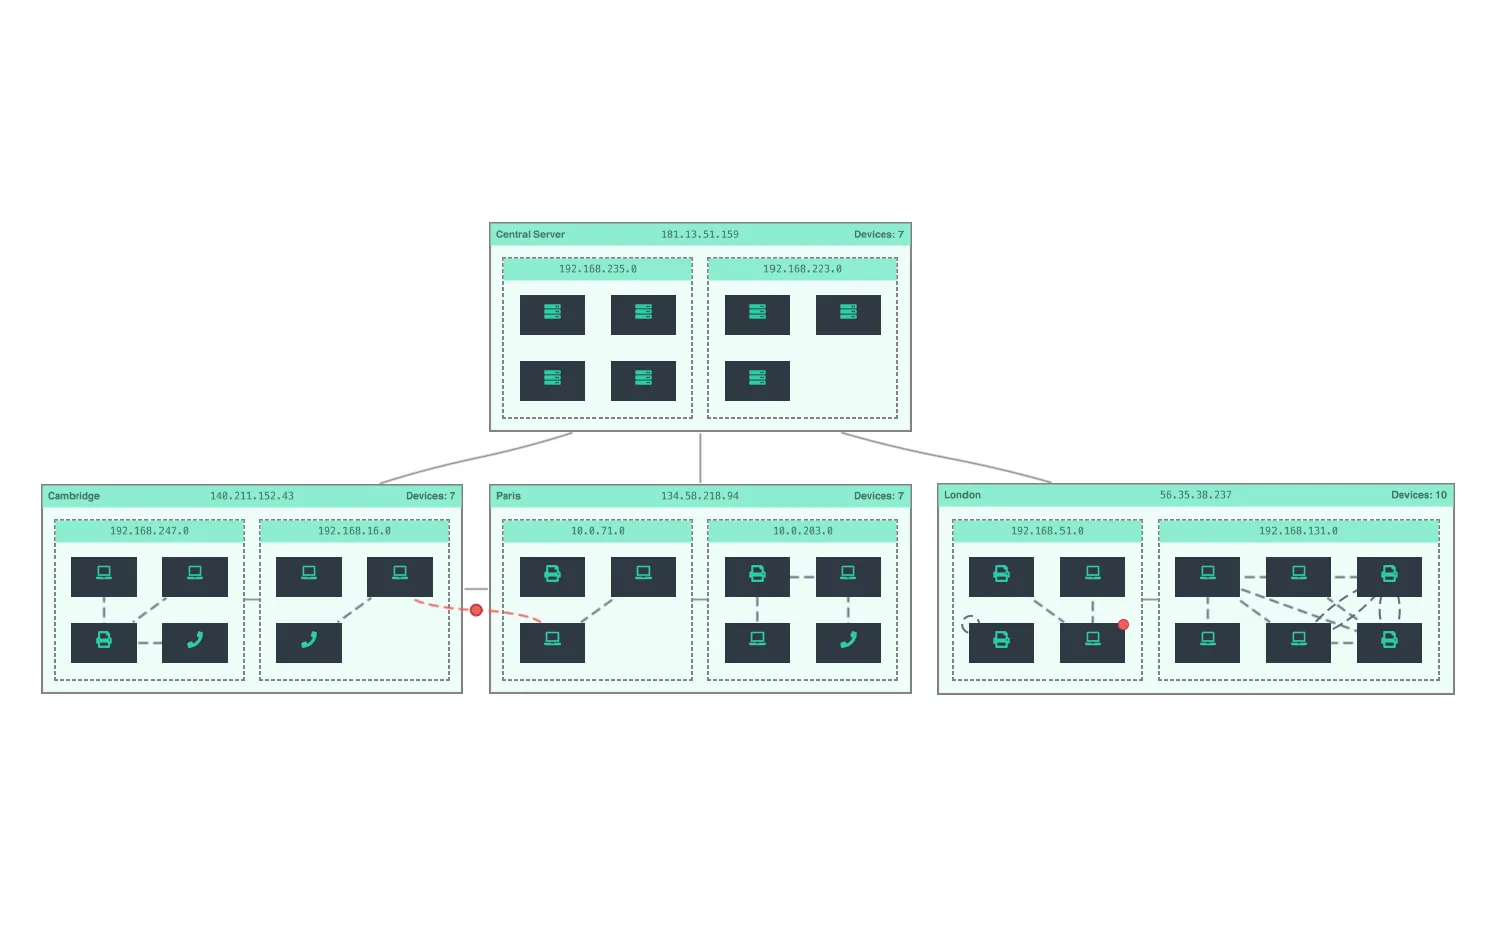
Combo Tightness
Control the space between items inside combo arrangements.
See example
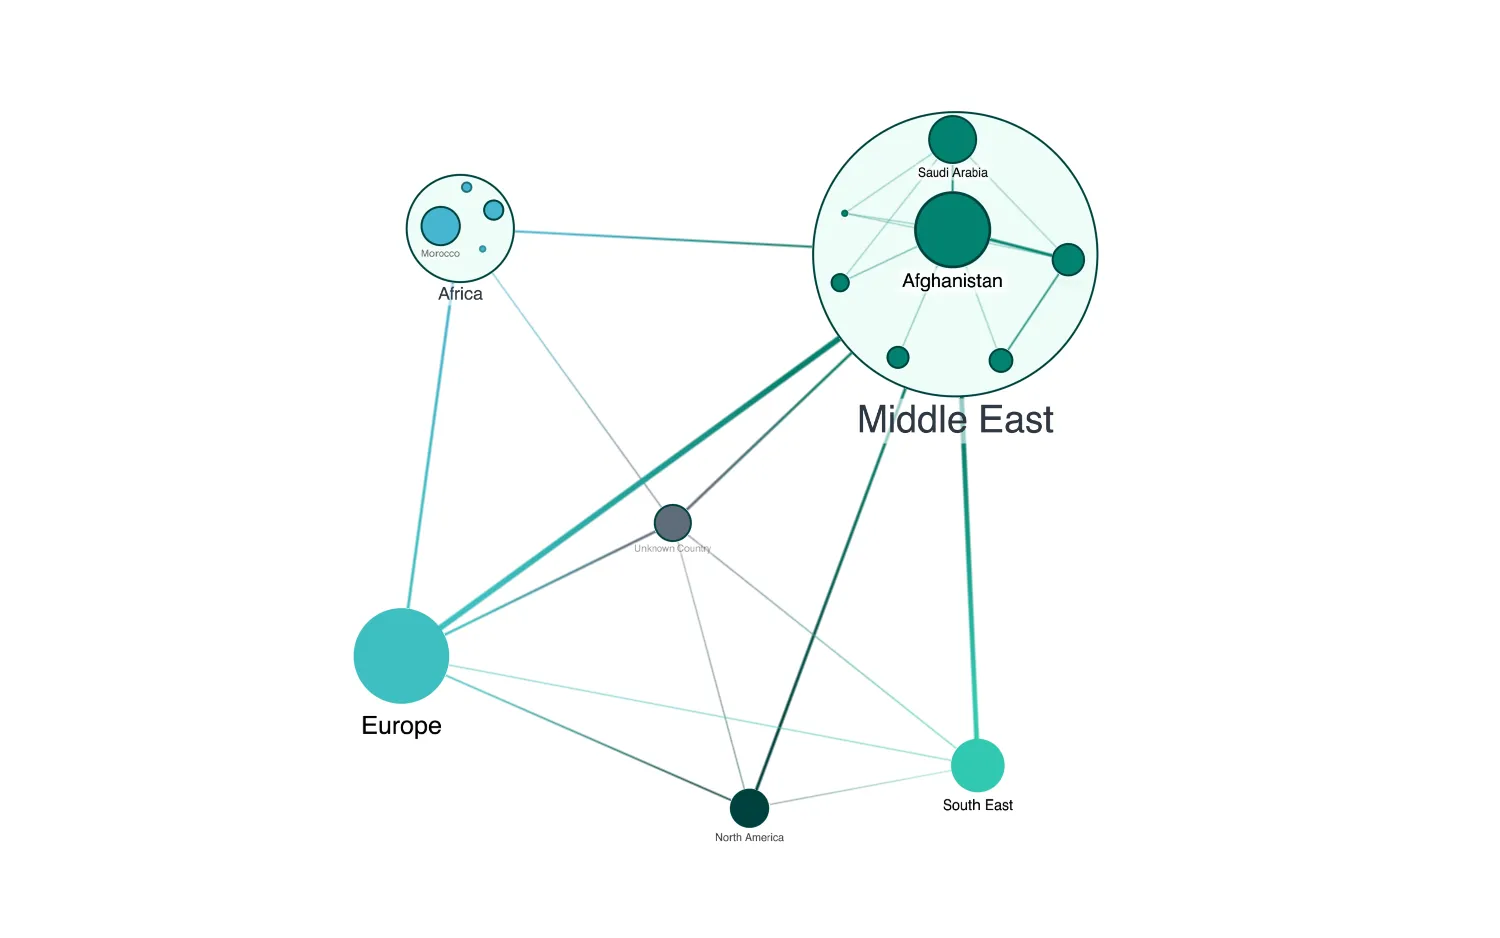
Dynamic Combos
Combine nodes by various criteria into multiple levels.
See example
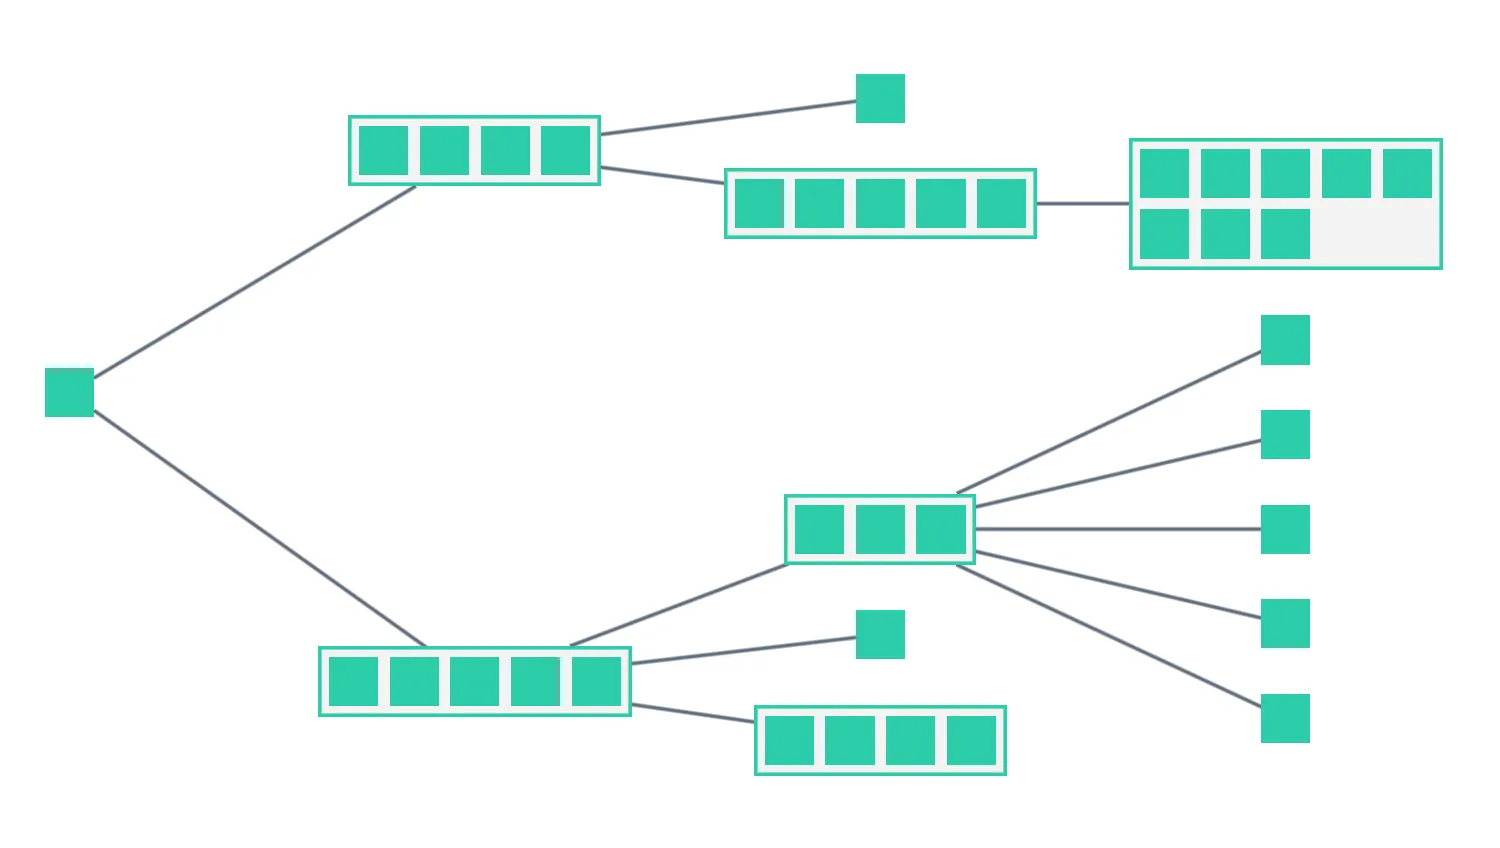
Grid Arrange
Explore the grid arrangement inside open combos.
See example
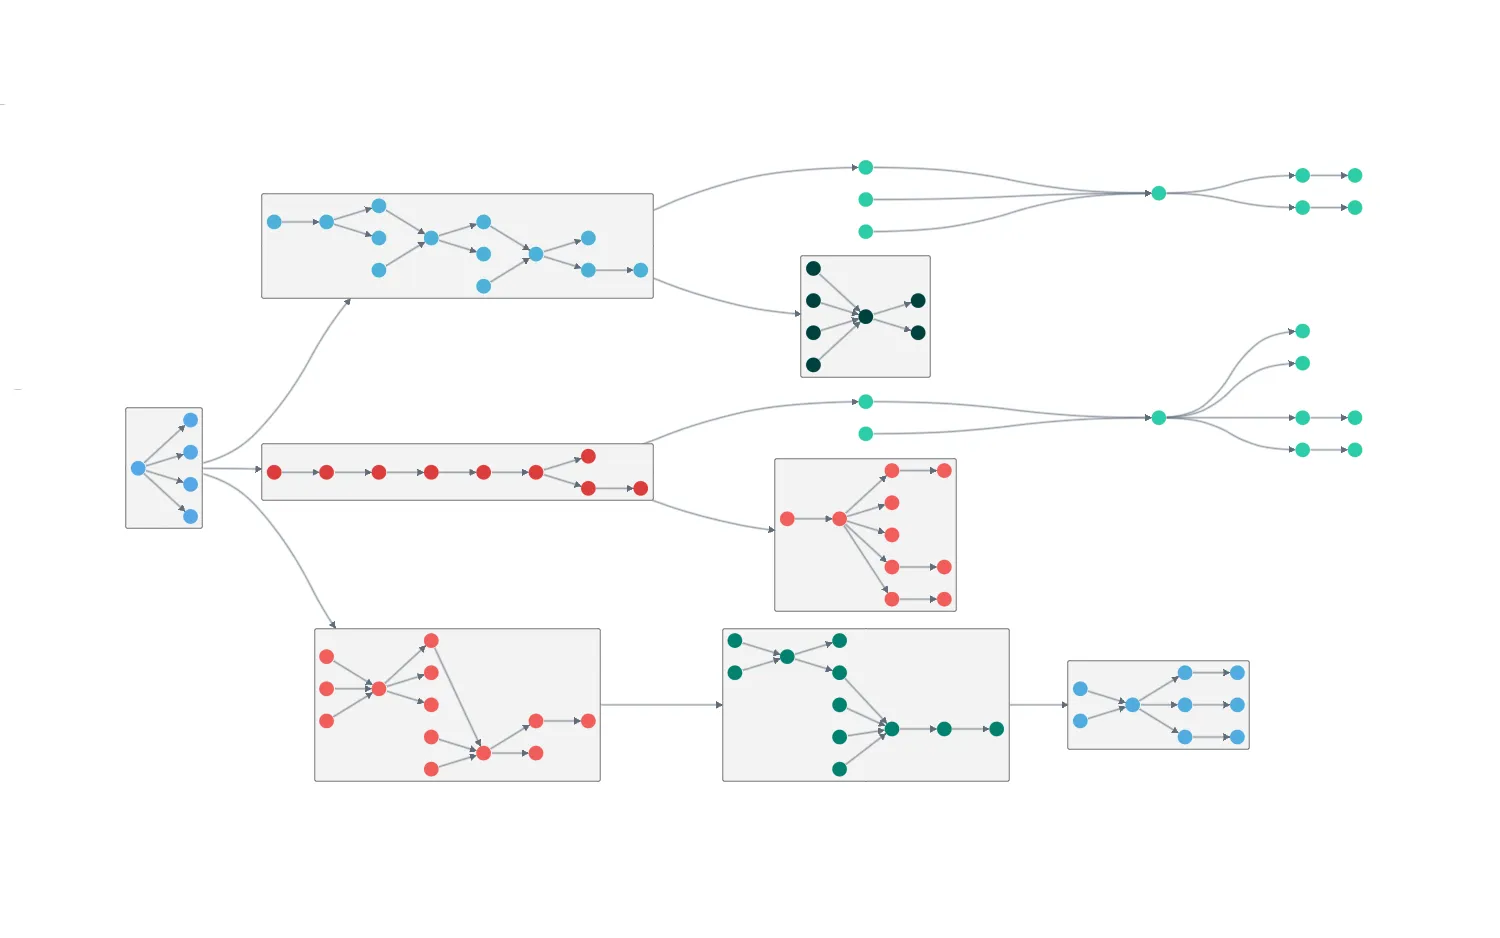
Sequential Arrange
Visualize relationships between levels of data inside combos.
See example
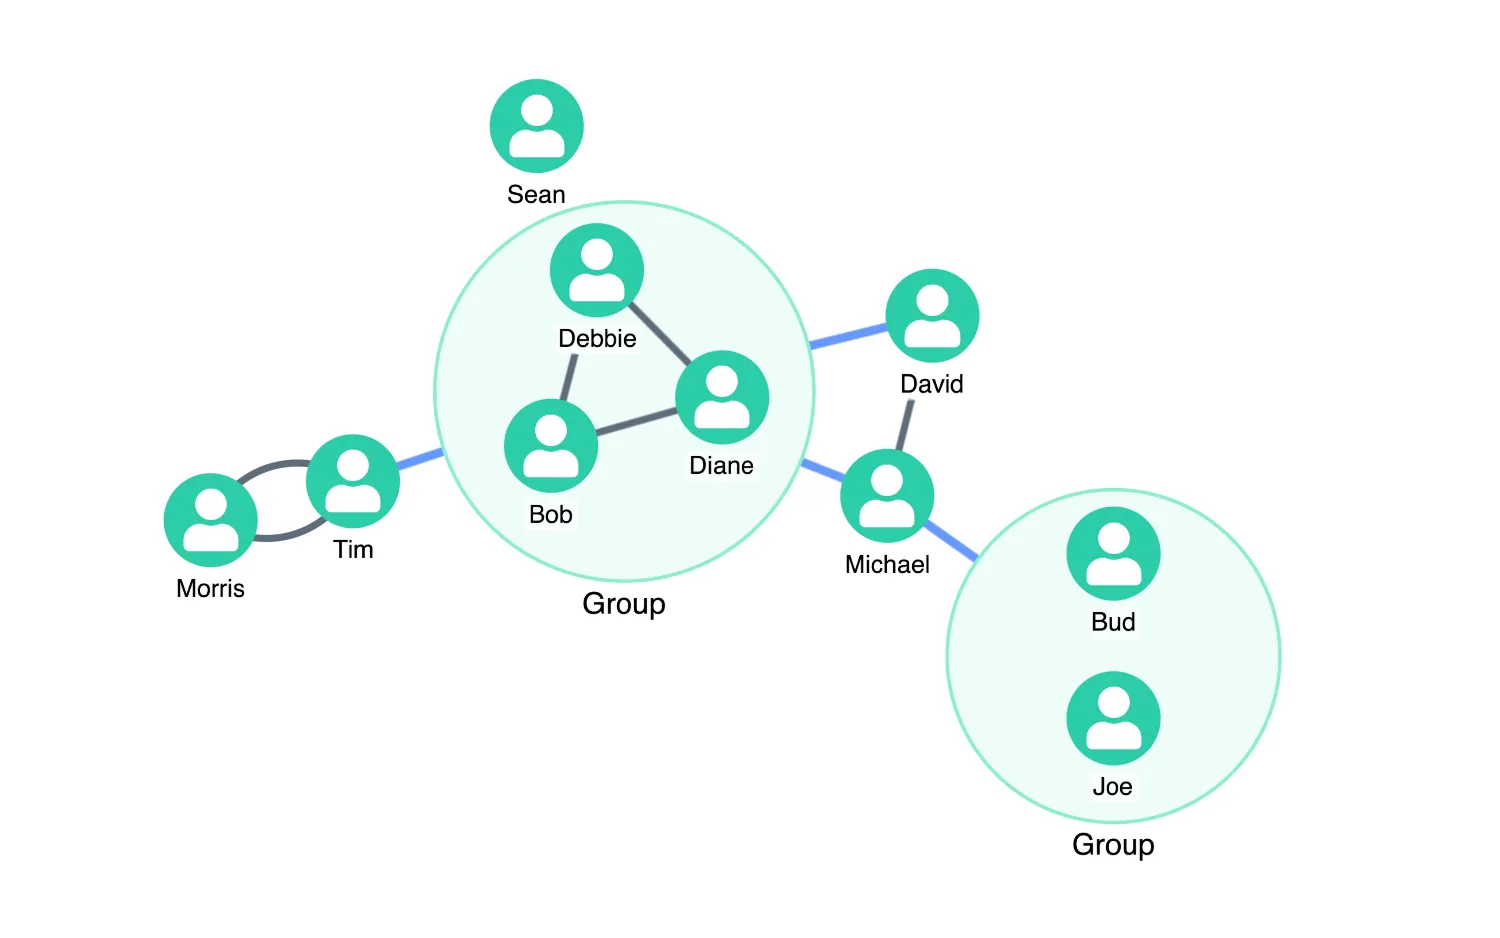
Manual Combos
Combine manually selected nodes into combos.
See example
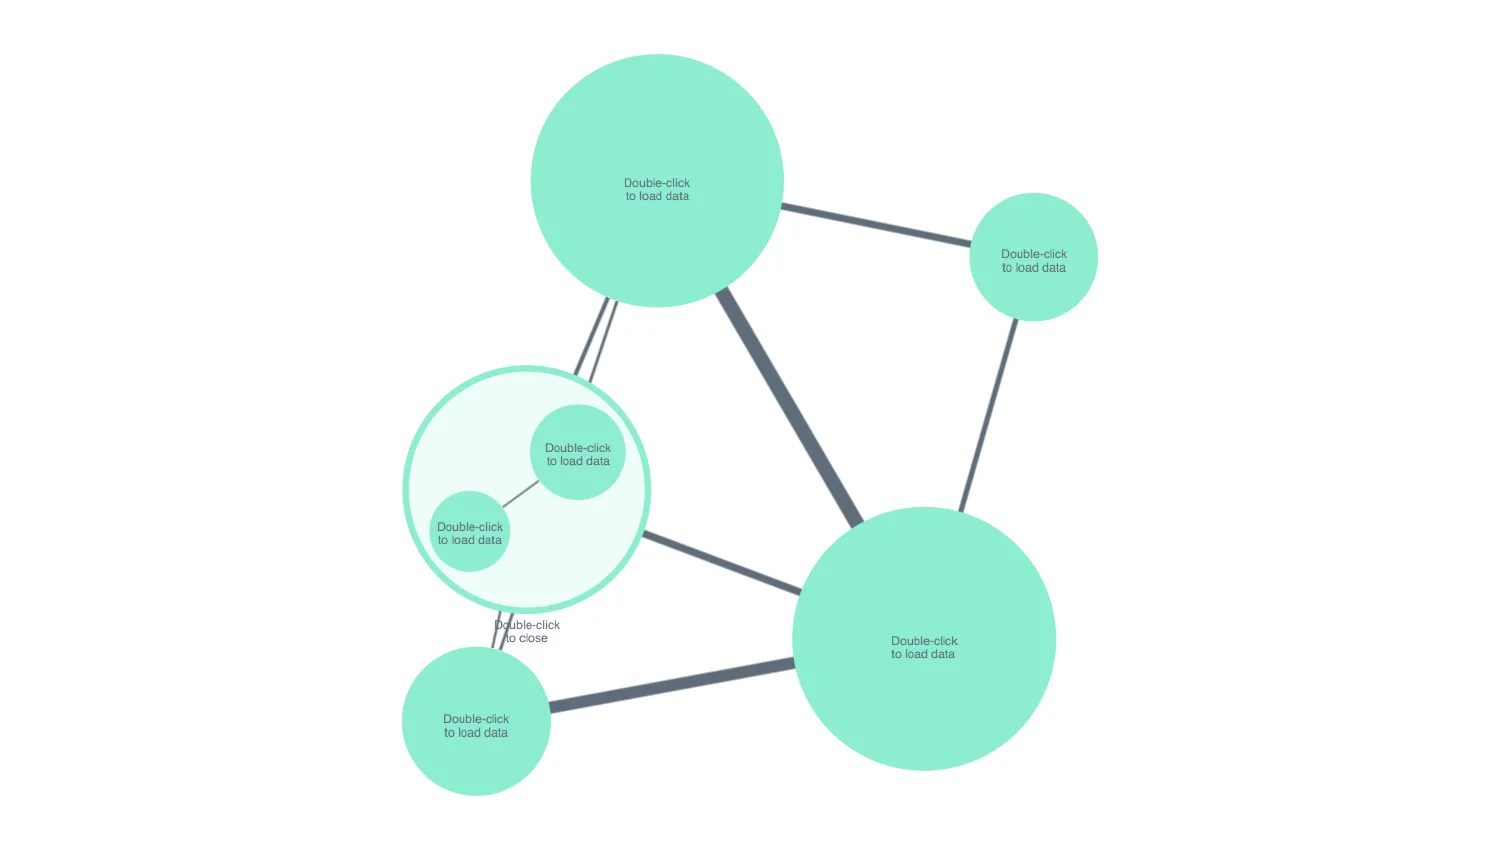
Lazy Loading
Load data for open combos on demand as they are opened.
See example
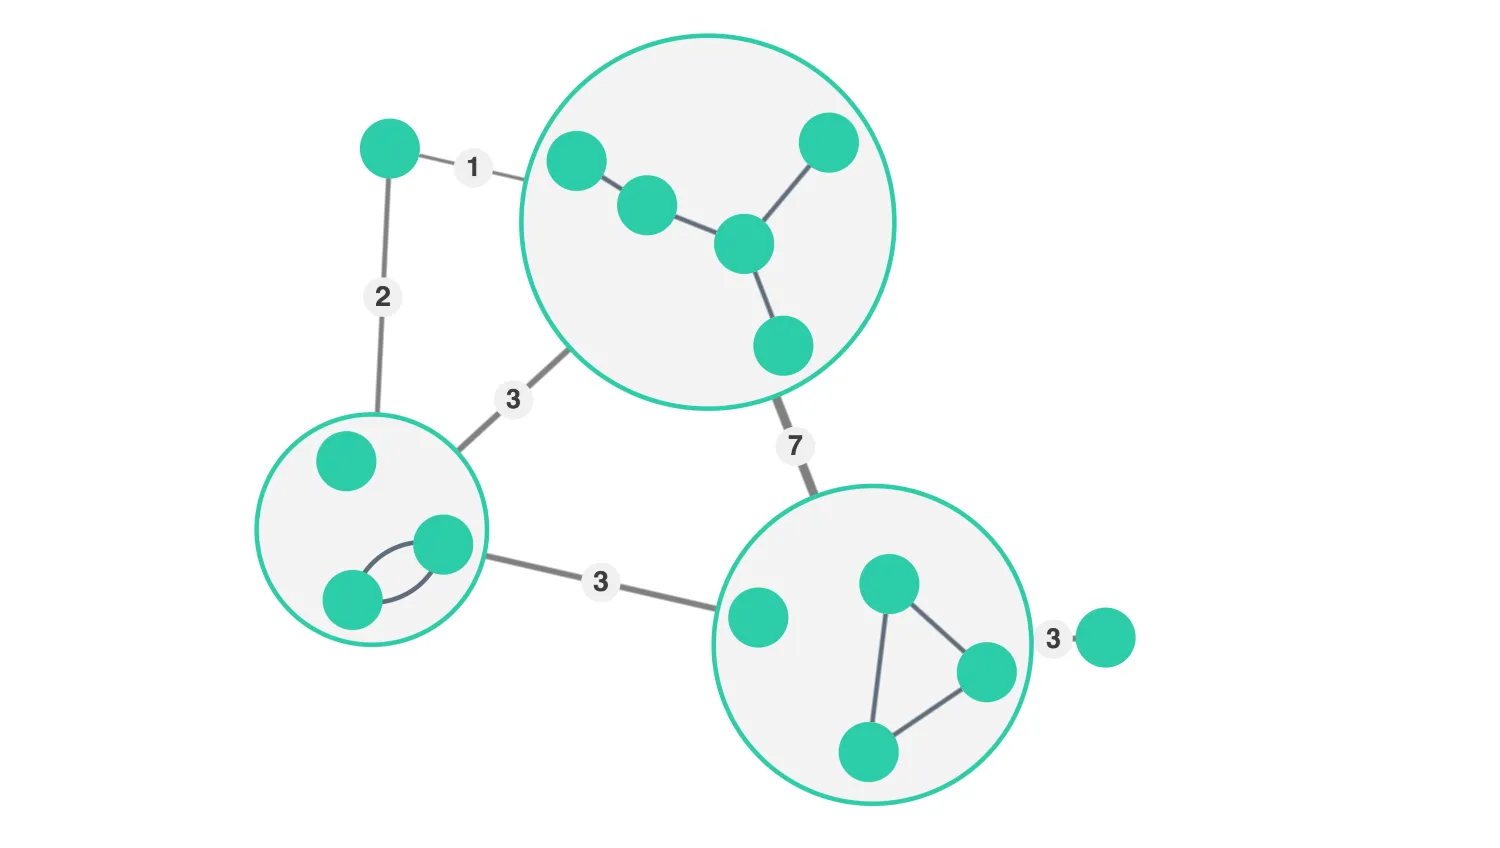
Summary Links and Selection Behavior
Explore summary and content links for combos.
See example
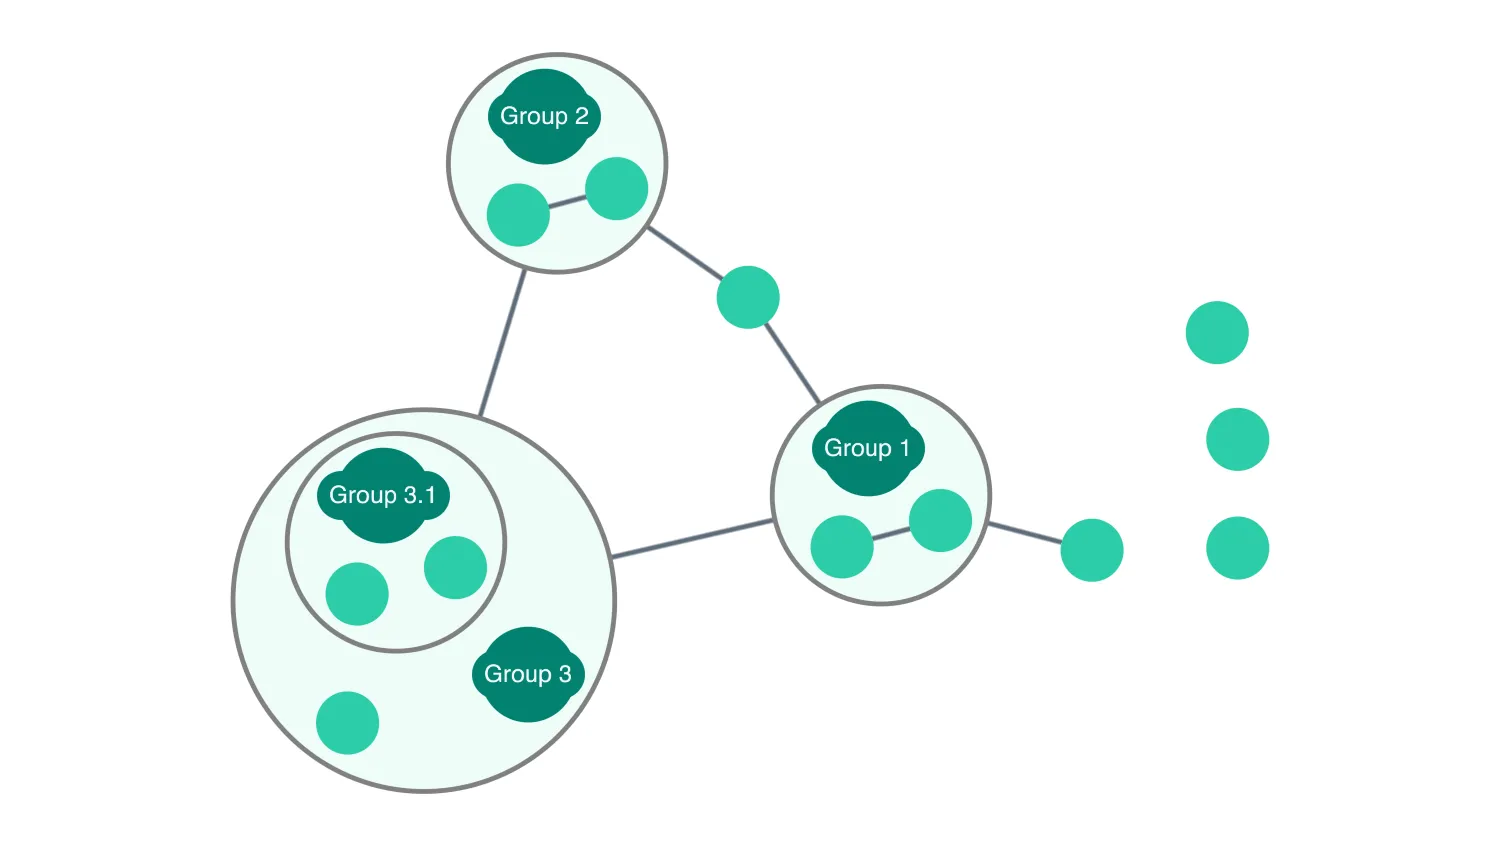
Drag and Drop
Drag and drop nodes in and out of combos.
See example
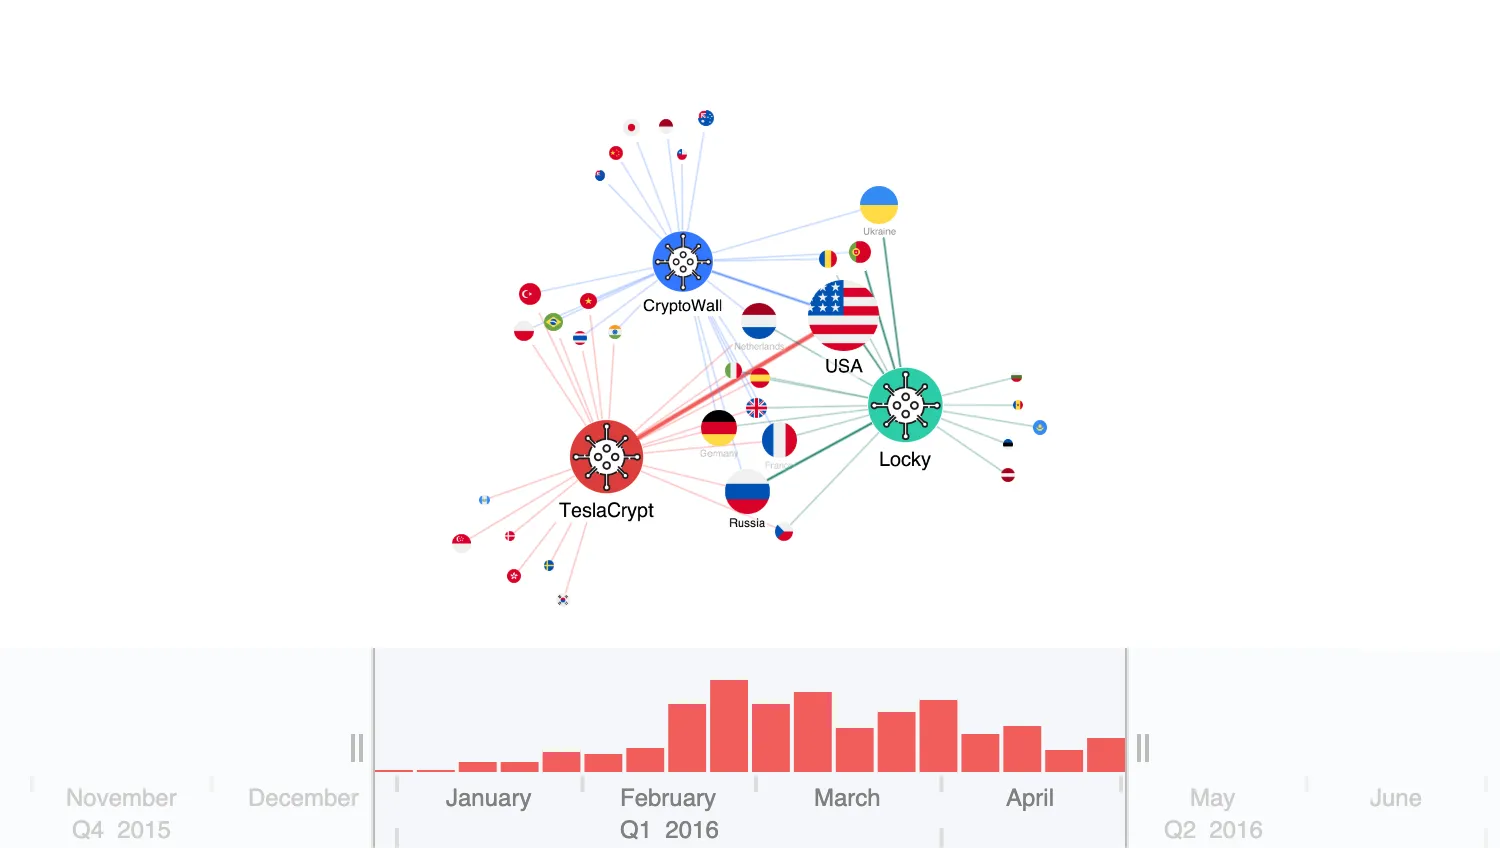
Combos and Time Bar
Scroll and pan the time bar to filter chart items by time.
See example
Annotations
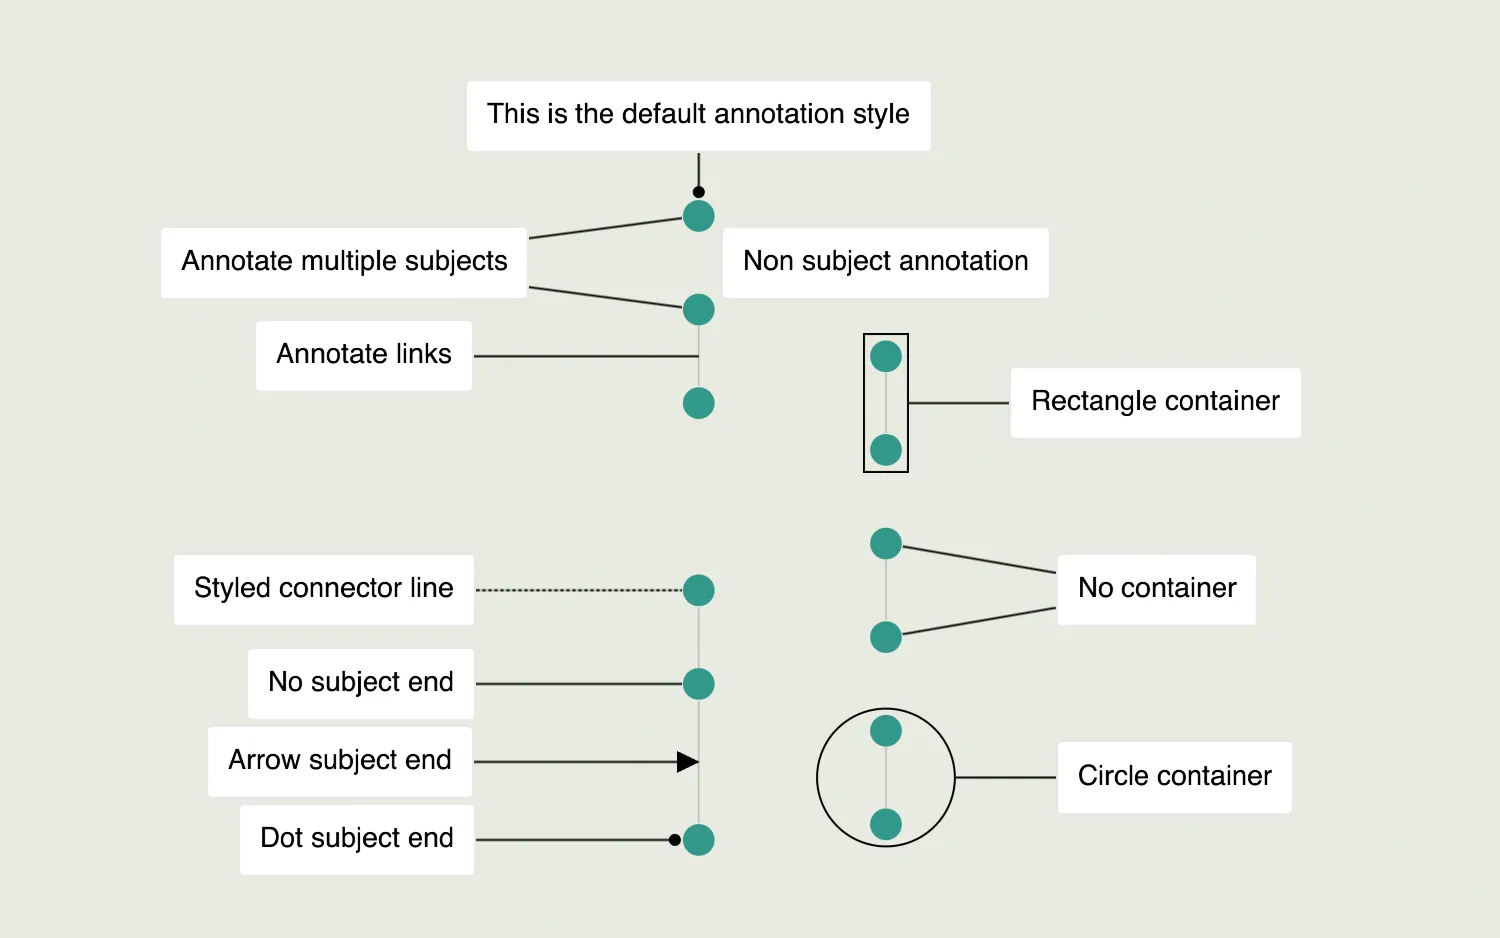
Annotations Basics
Understand the main concepts behind annotations.
See example
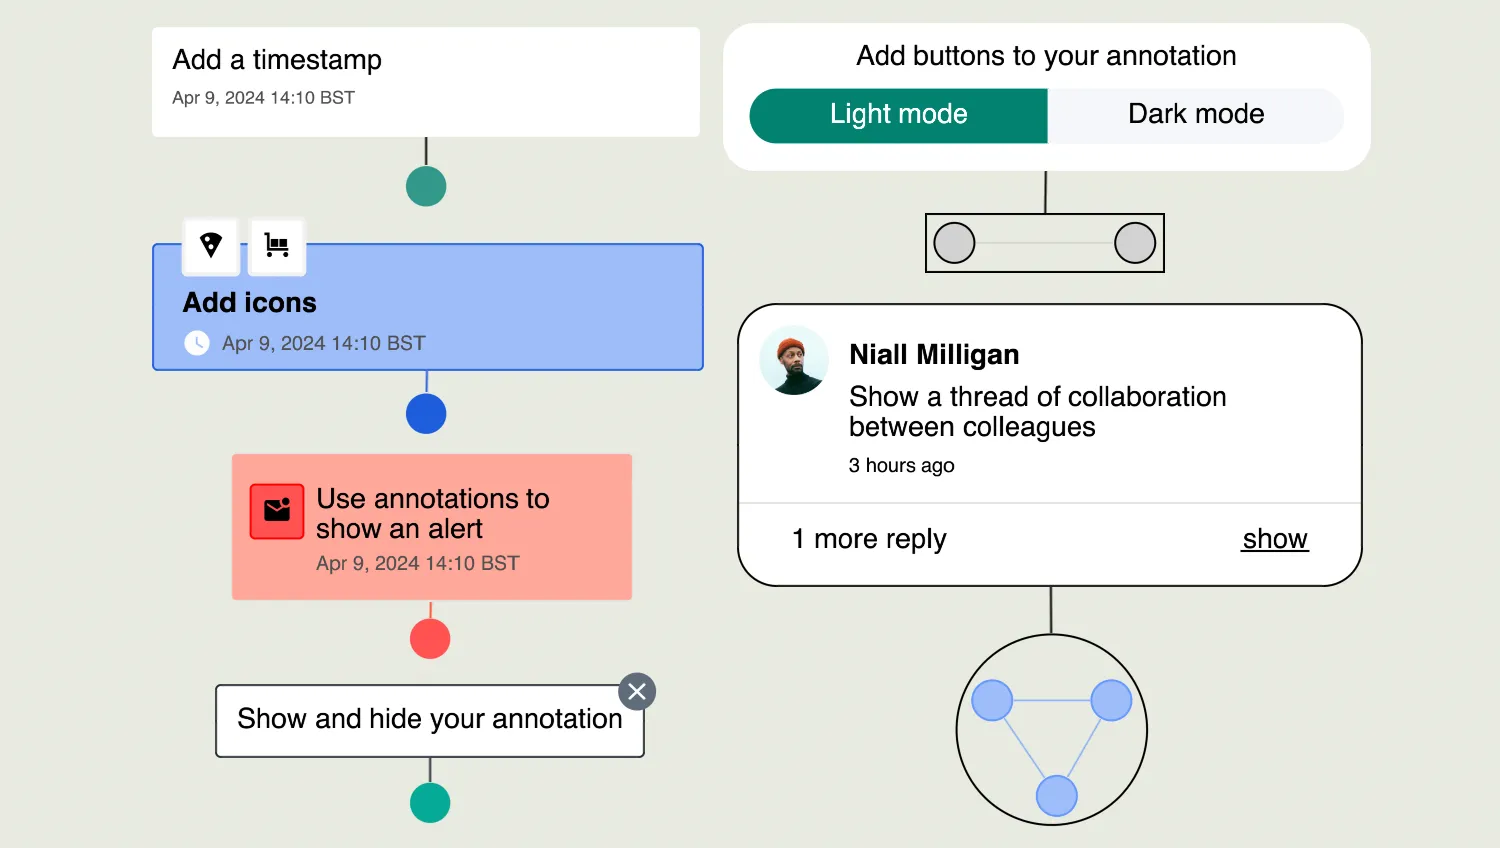
Advanced Annotation Gallery
Create annotations with labels, buttons and controls.
See example
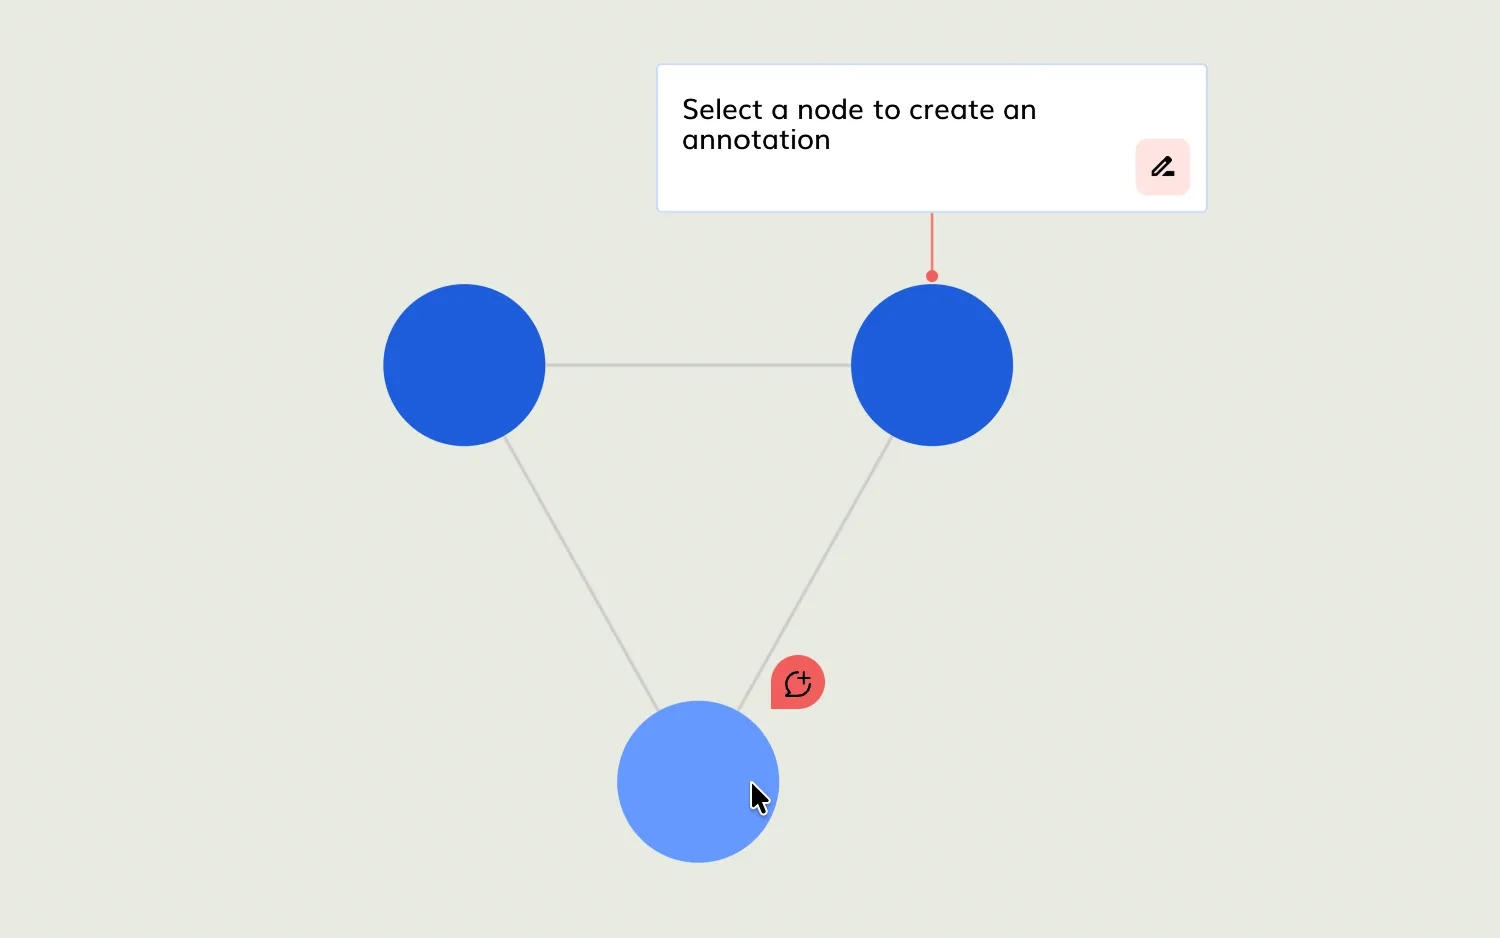
User-Created Annotations
Let chart users annotate nodes with interactive annotations.
See example
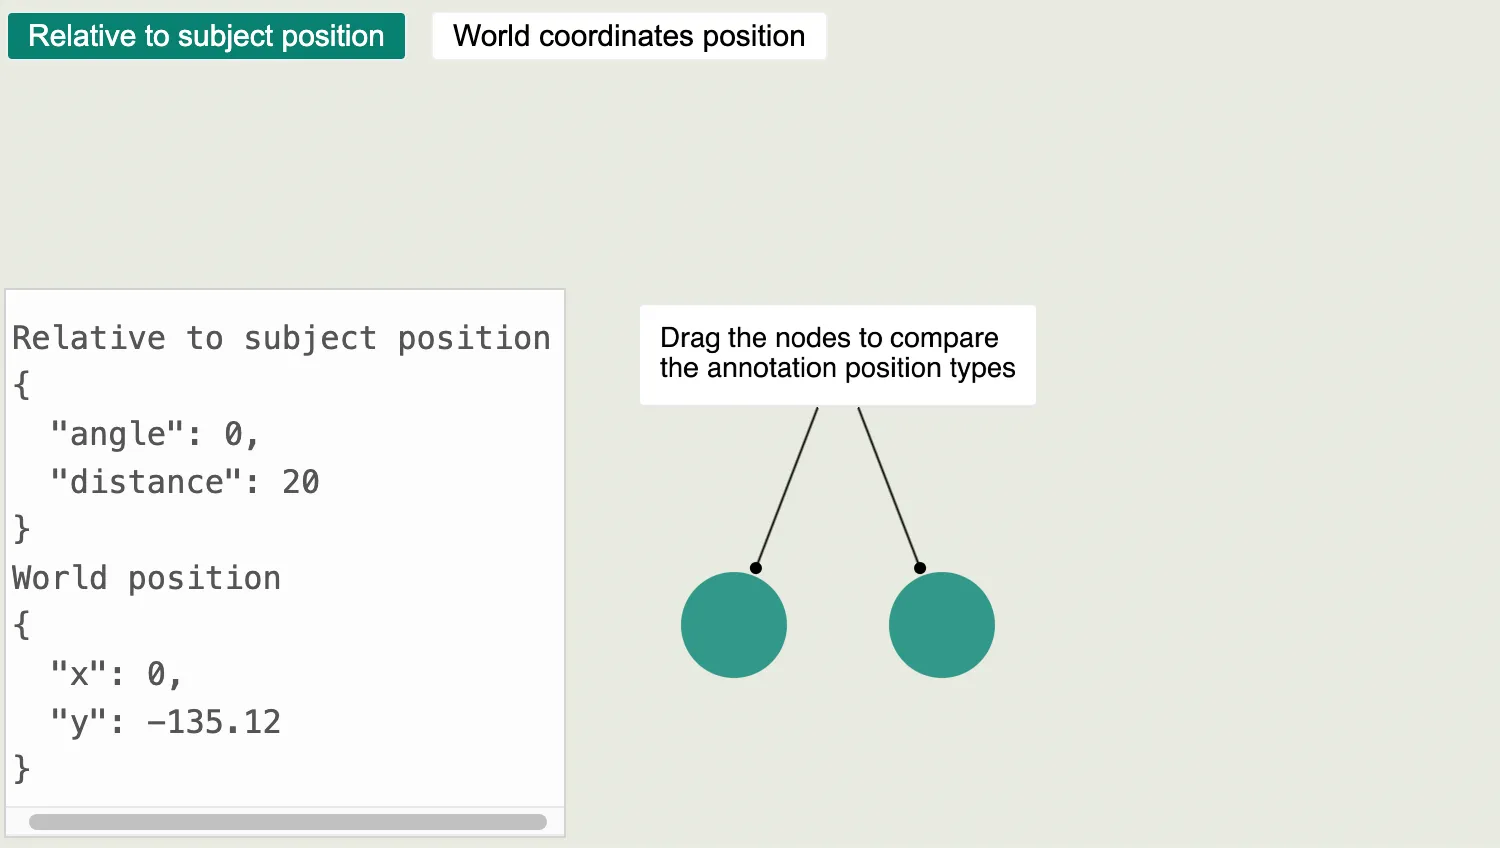
Annotations Positioning
Compare annotations positioned by subjects and world coordinates.
See example
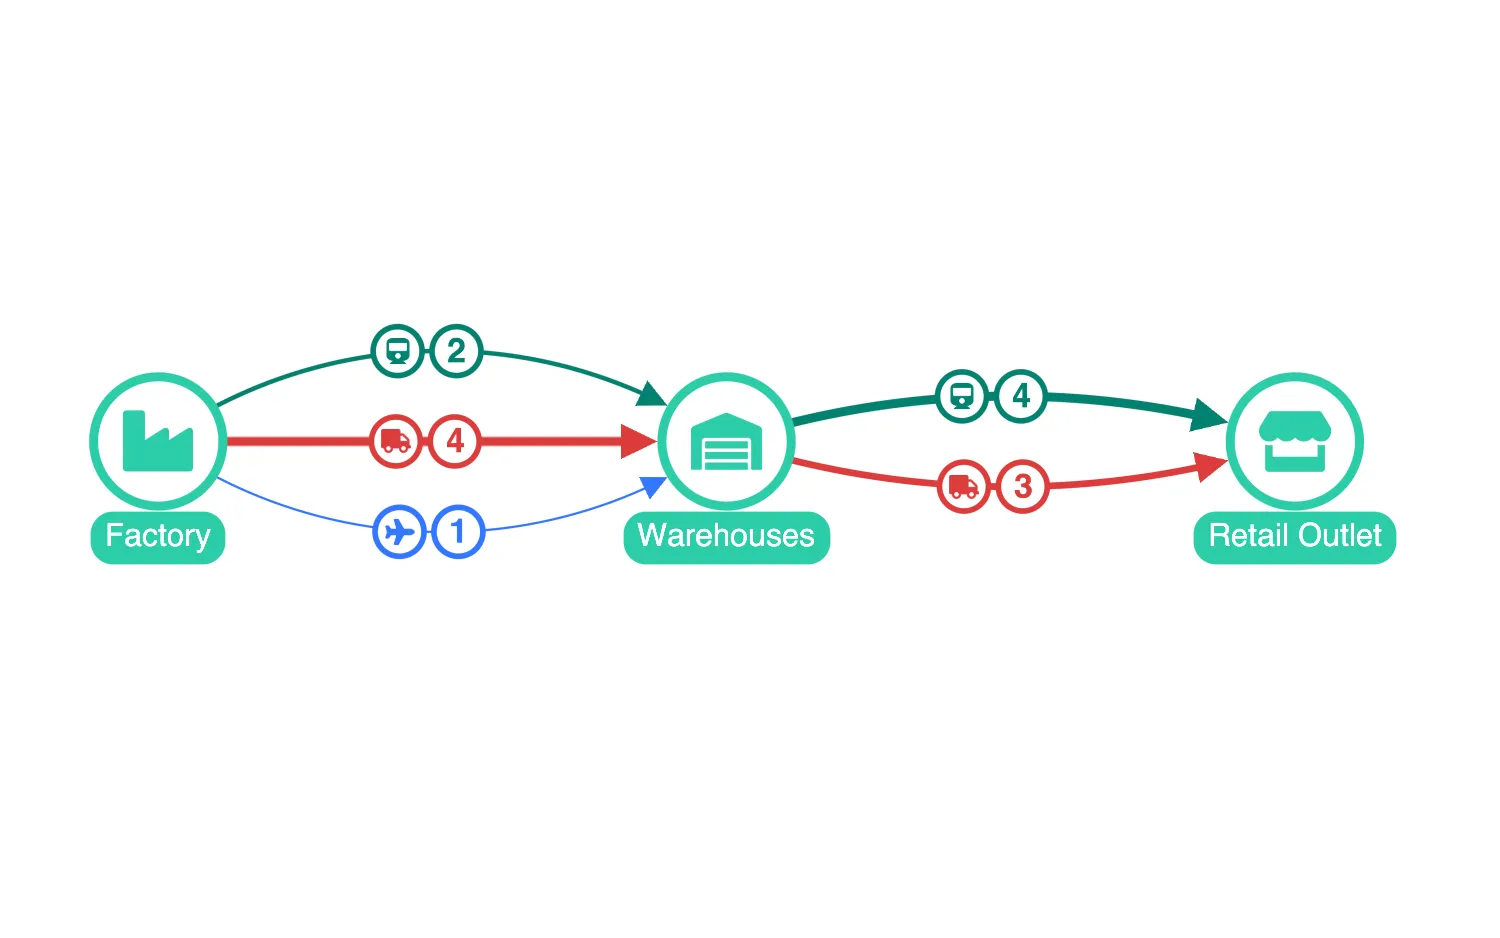
Aggregate Links
Export
Time Bar
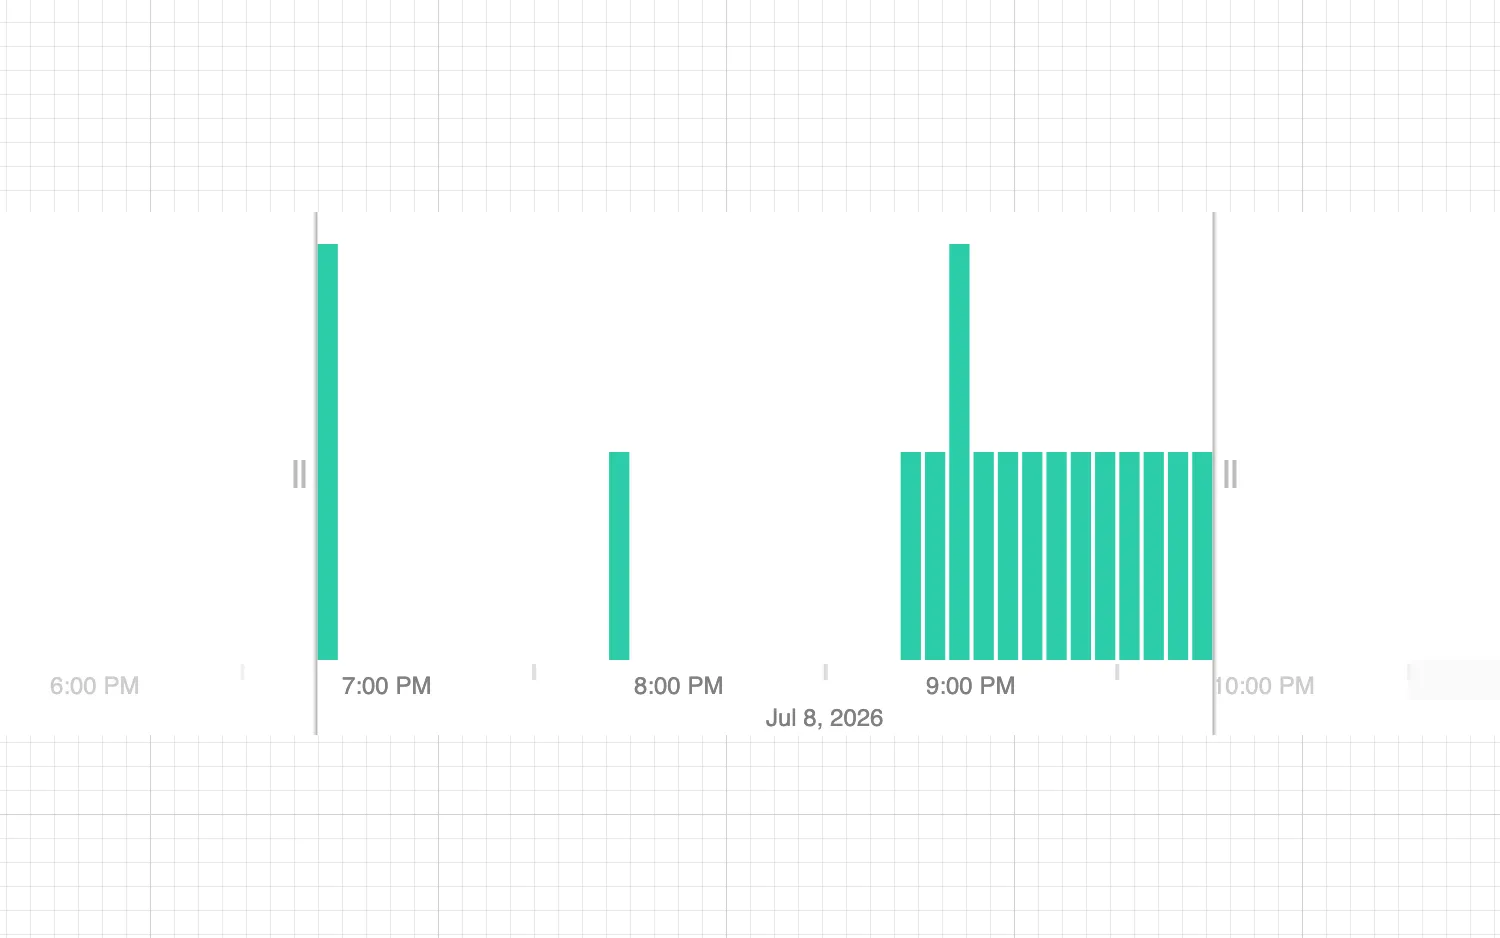
Data Format
Explore the JSON object data format for the time bar.
See example
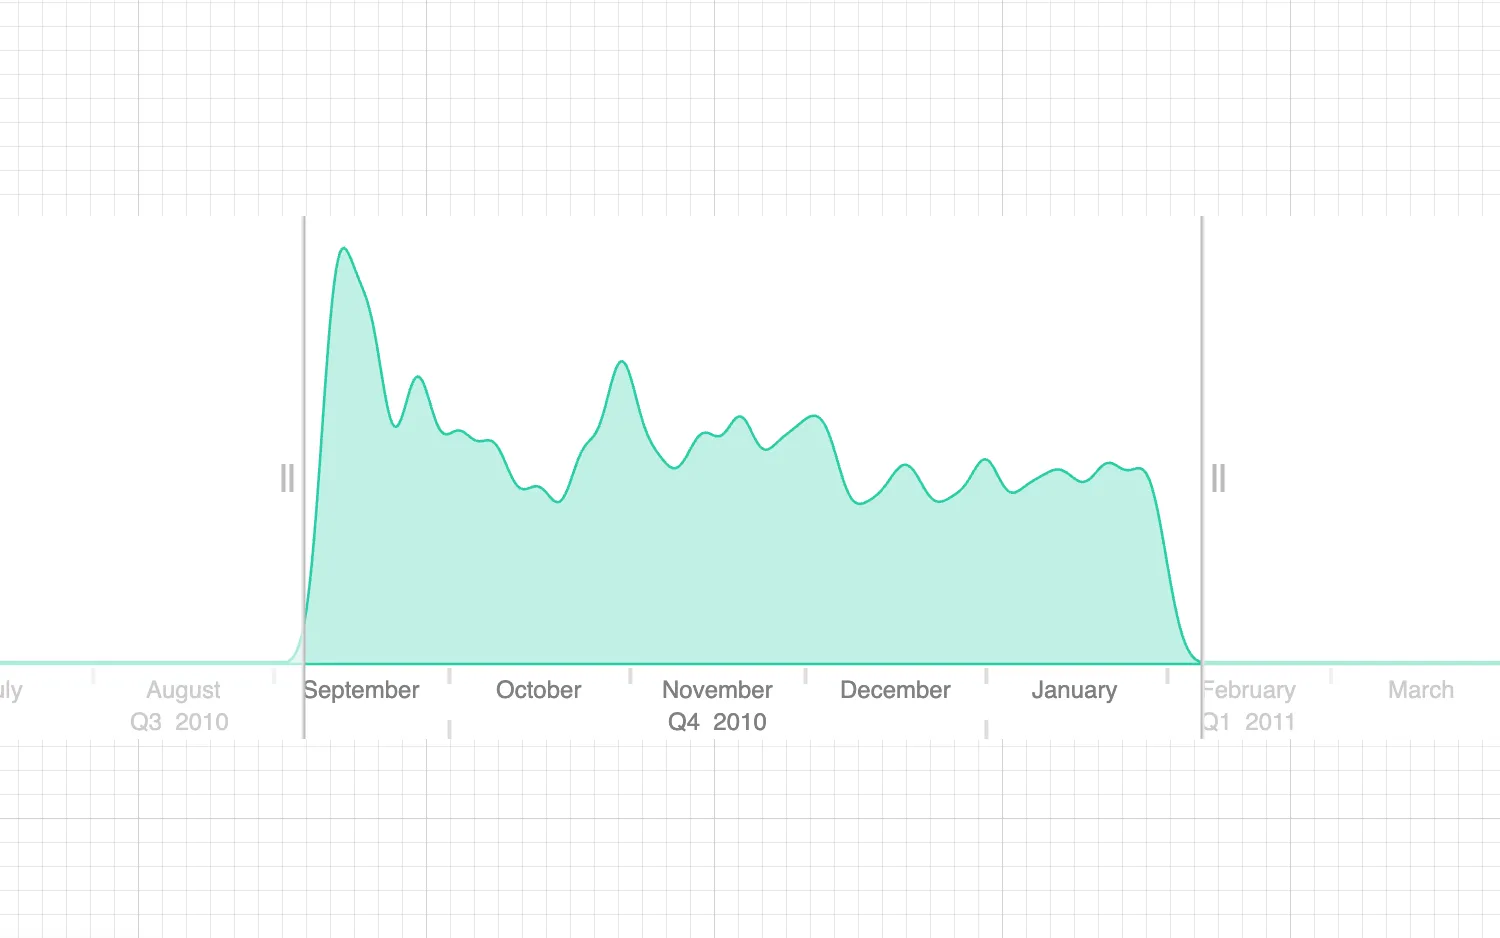
Smooth Mode
View the time bar as a smooth distribution of data over time.
See example
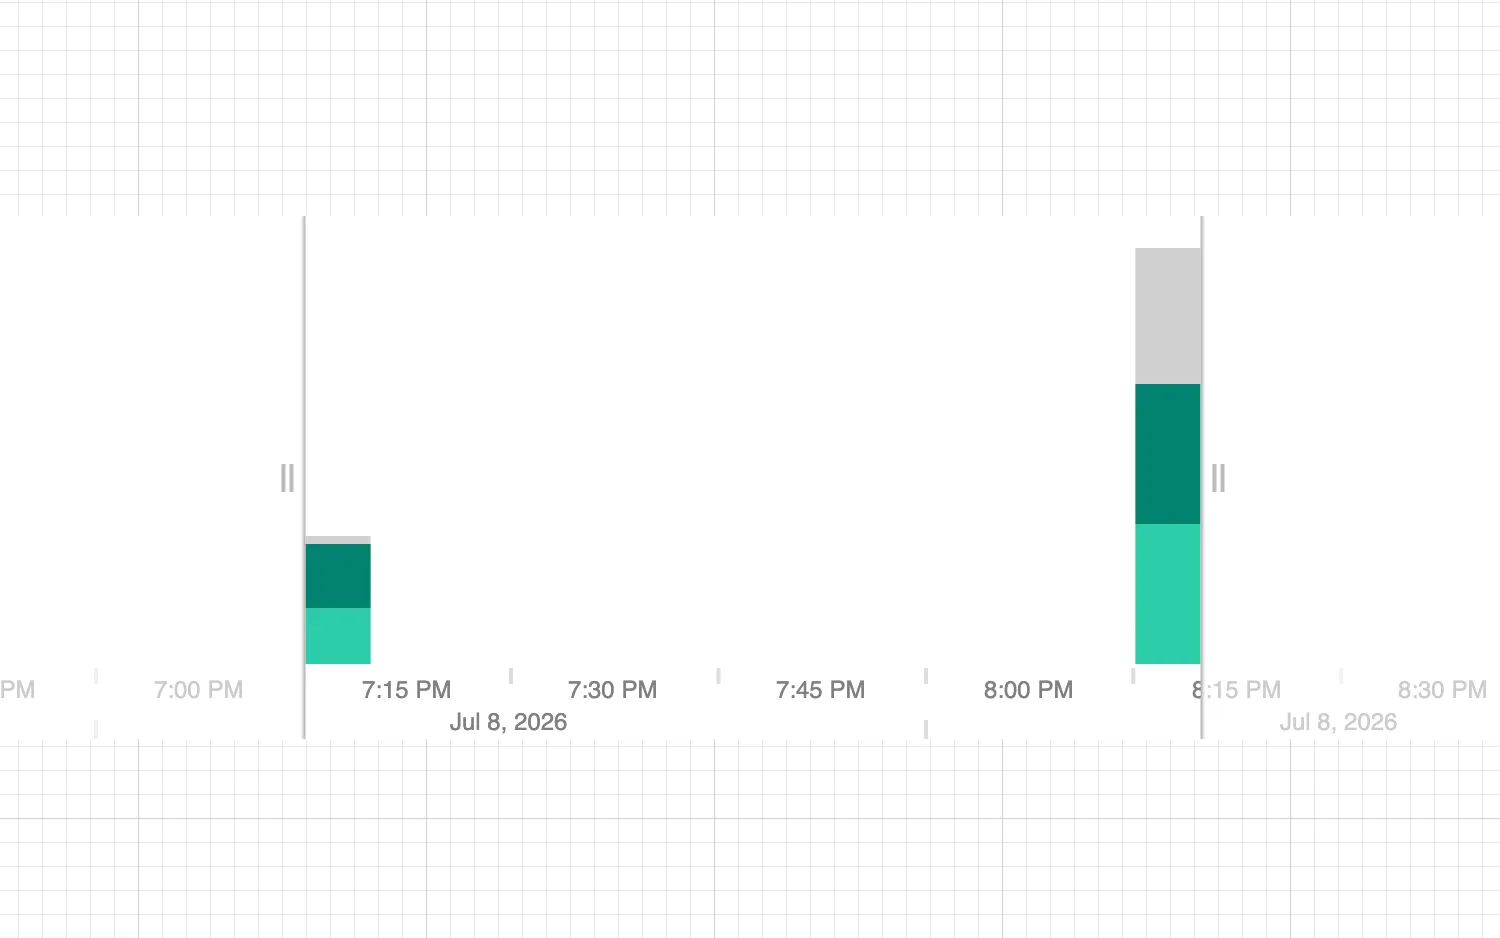
Stacked Bars
Split histogram stacks into multiple stacked groups.
See example
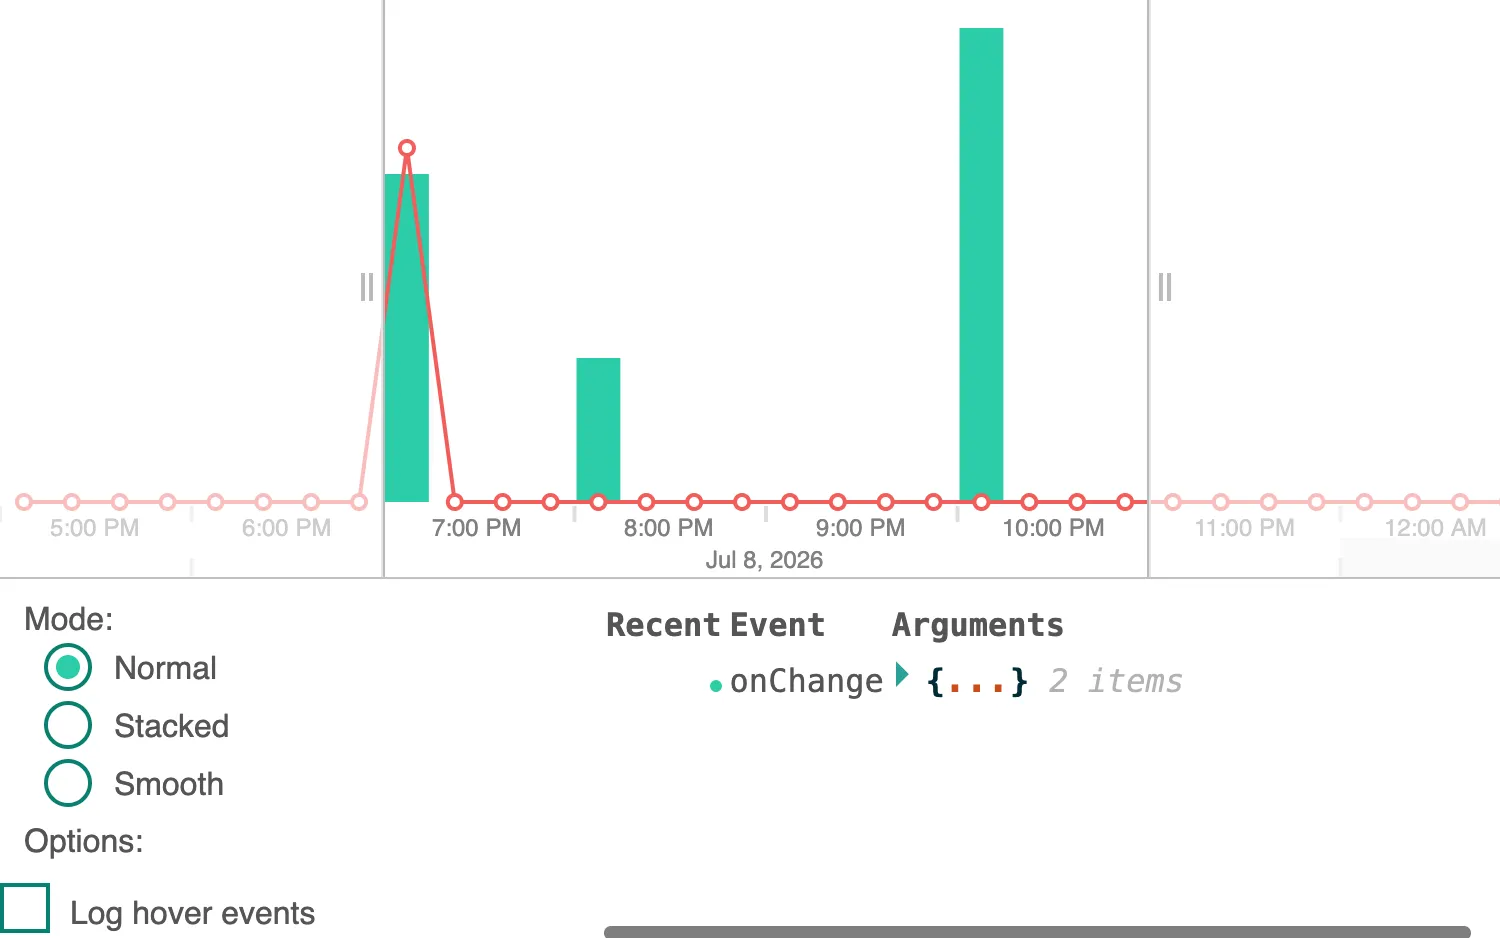
Events
Explore mouse, keyboard and touch events by interacting with time bar.
See example
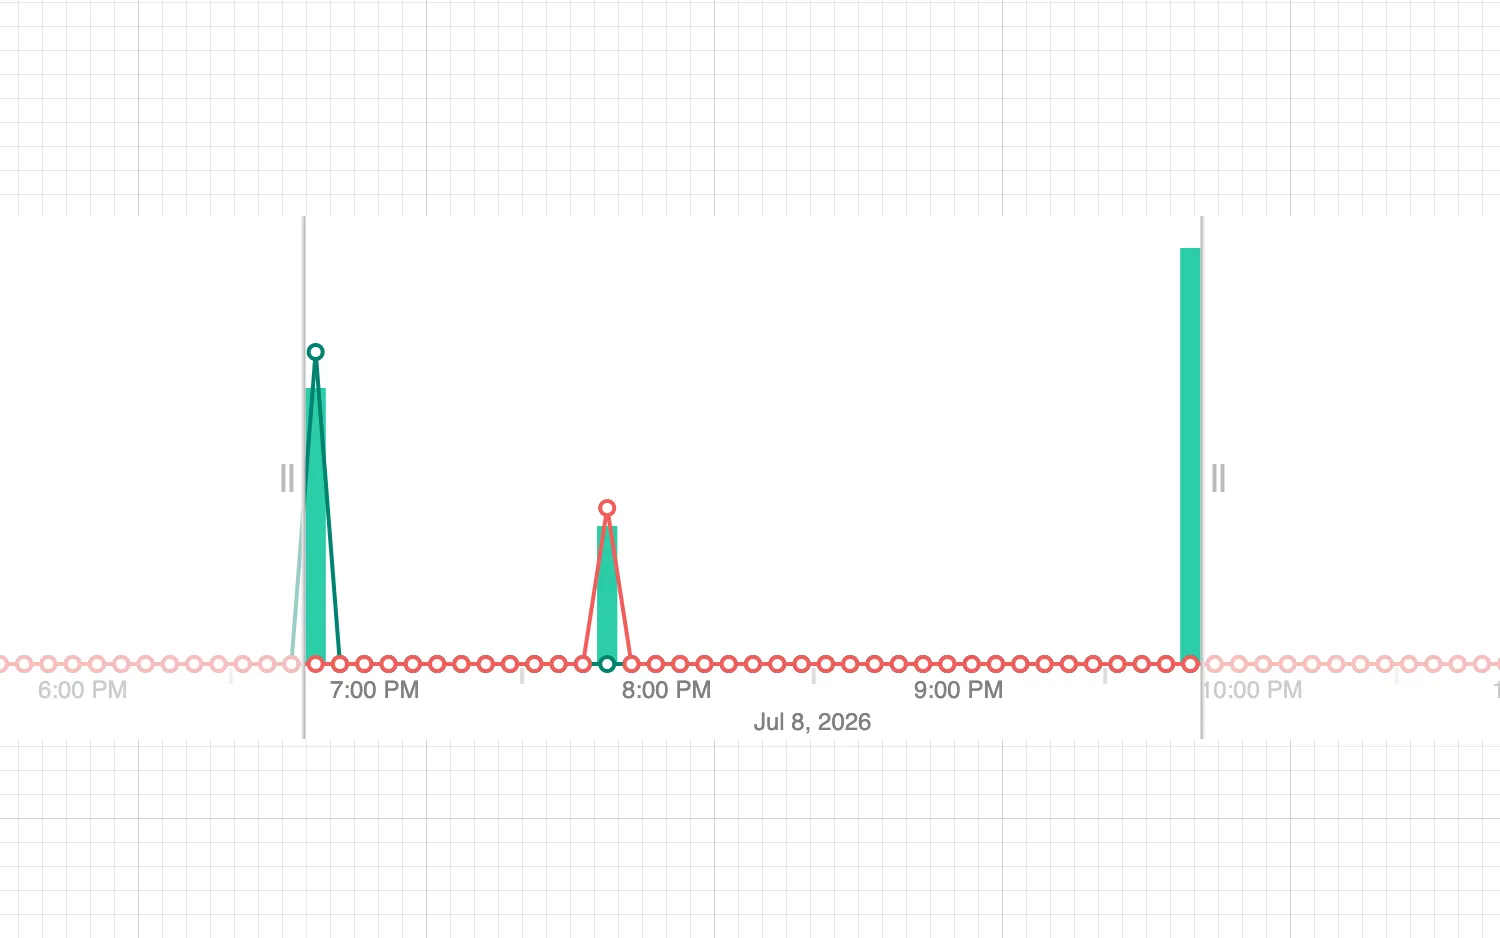
Selection
Show the trend of a subset of data with selection lines.
See example
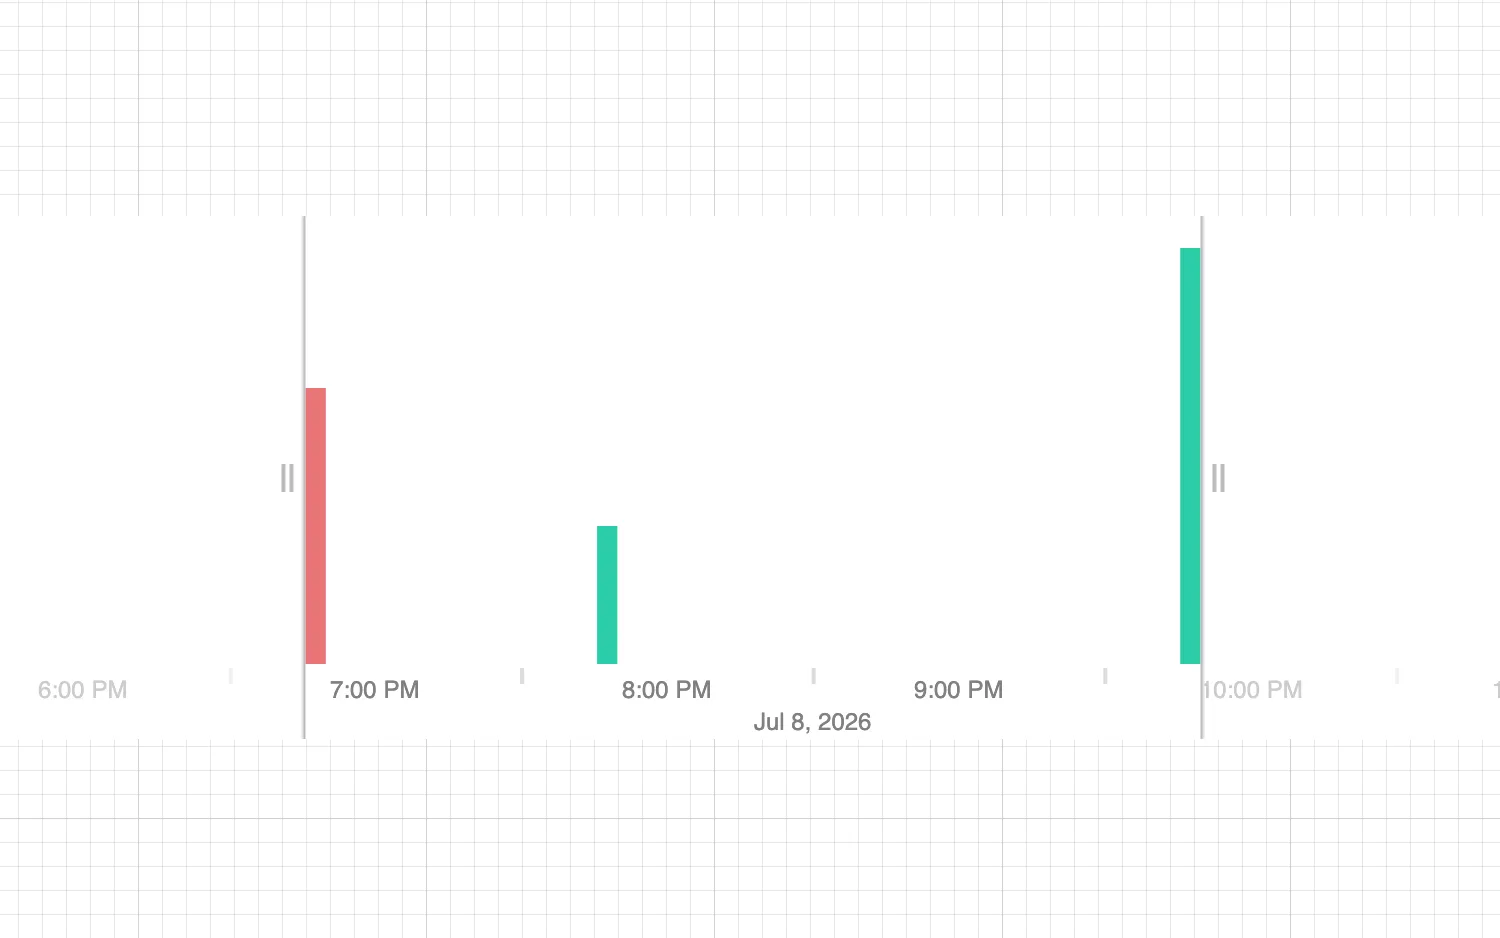
Highlight Key Times
Highlight important histogram stacks with a distinct style.
See example
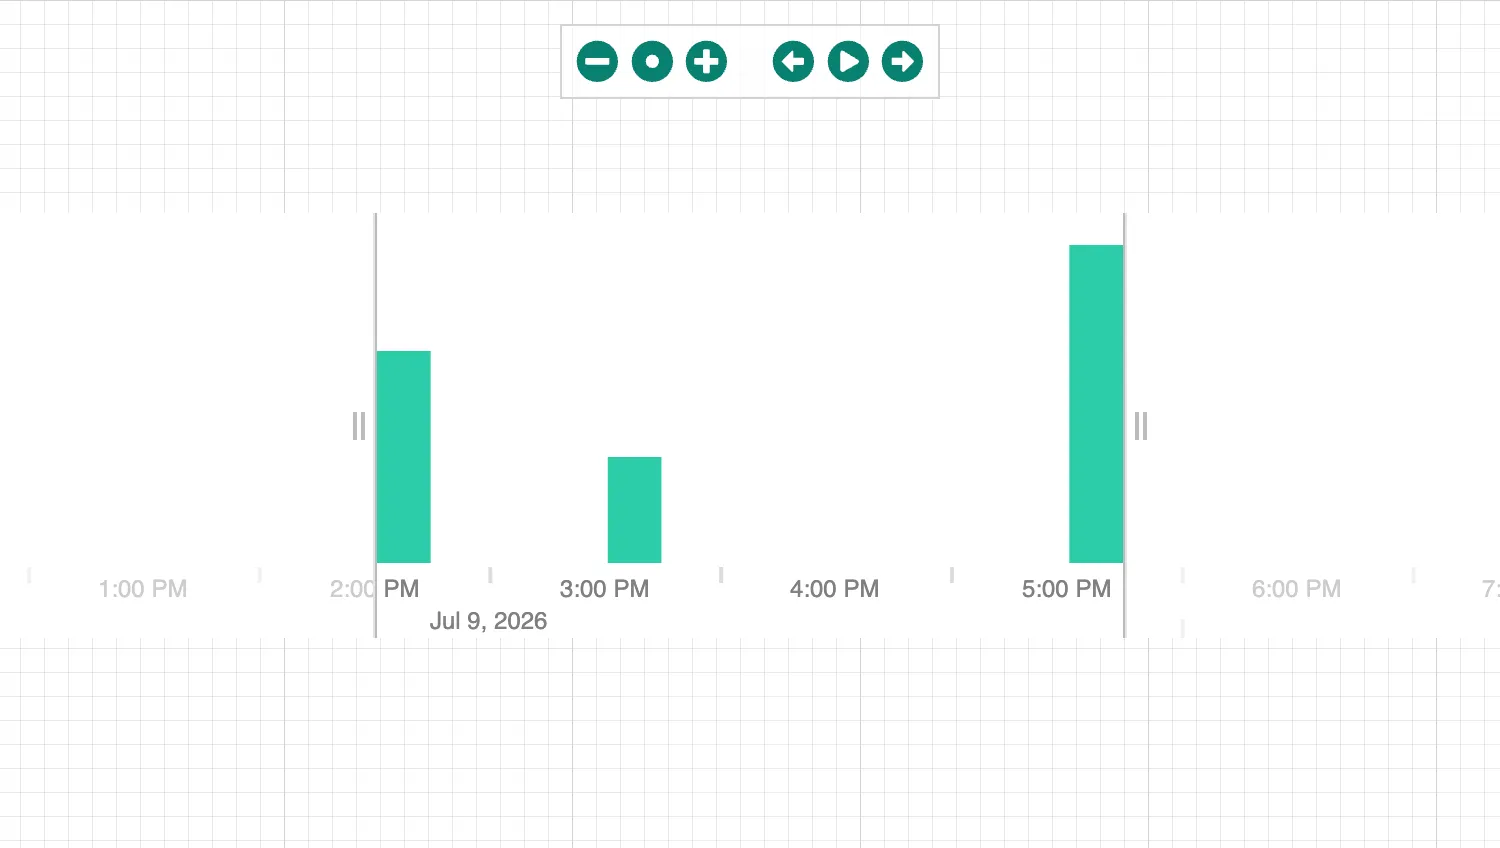
Controls
Add controls to interact with the time bar.
See example
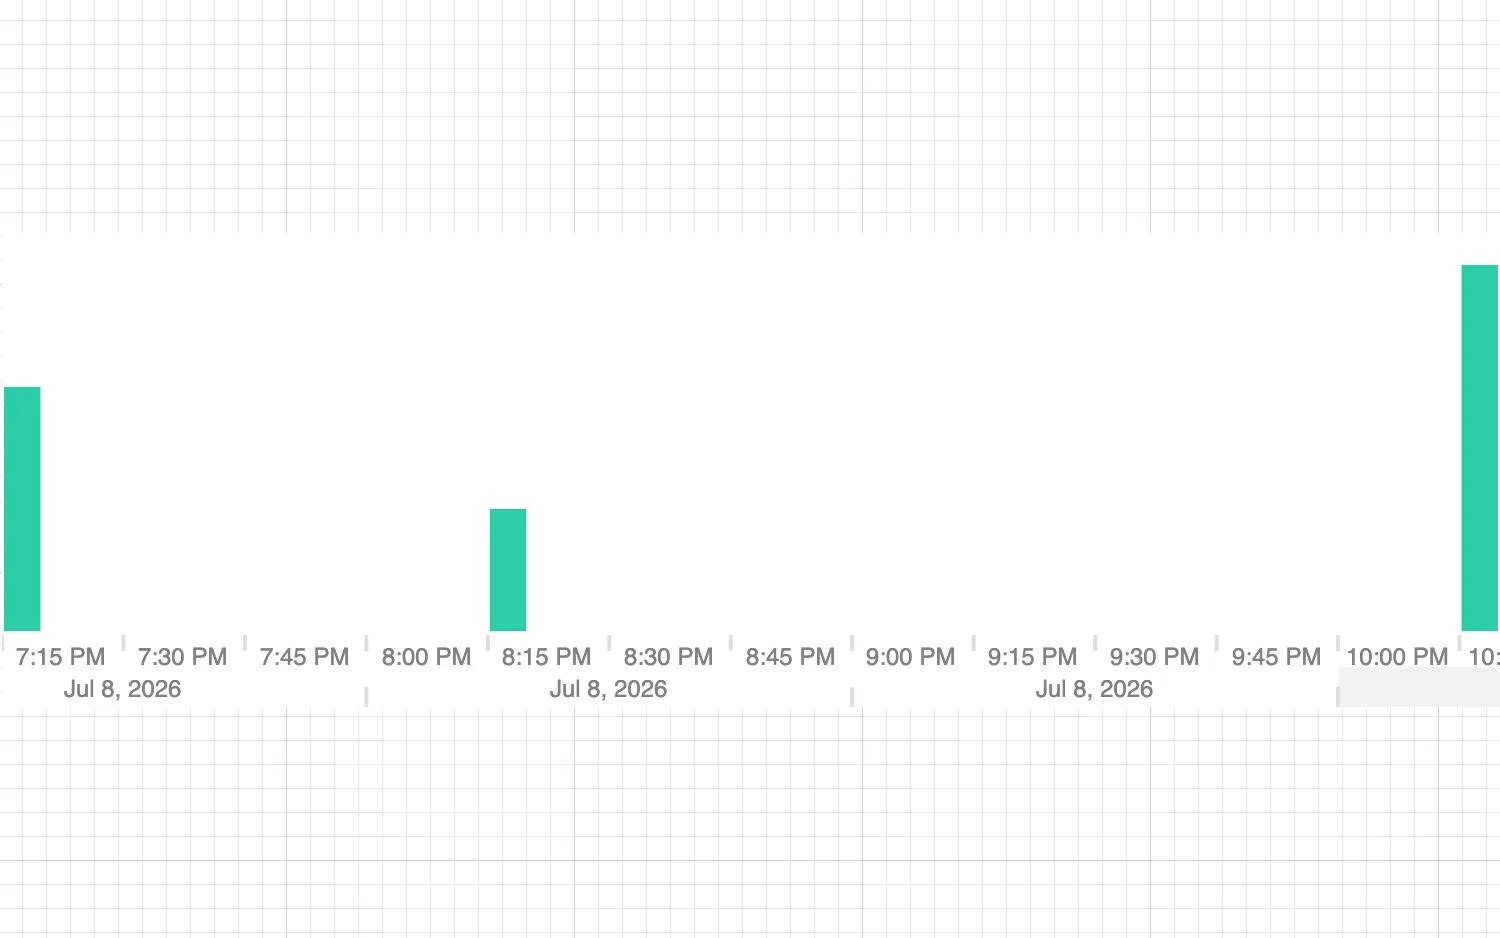
Without Sliders
Hide range sliders to focus on data within range.
See example
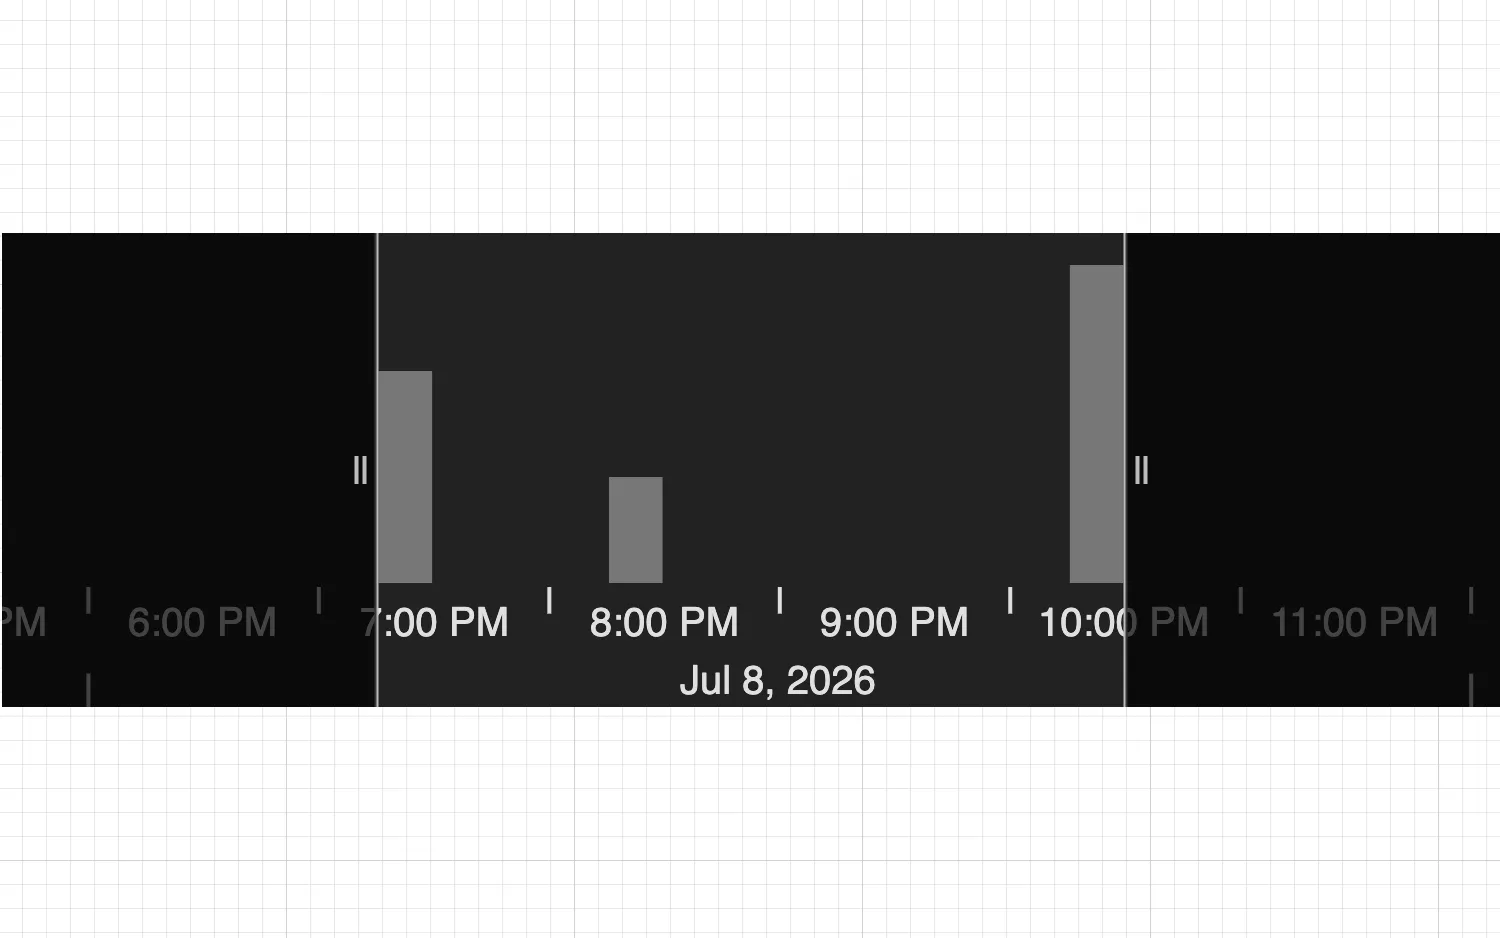
Styles
Customize the look of the time bar to fit your application.
See example
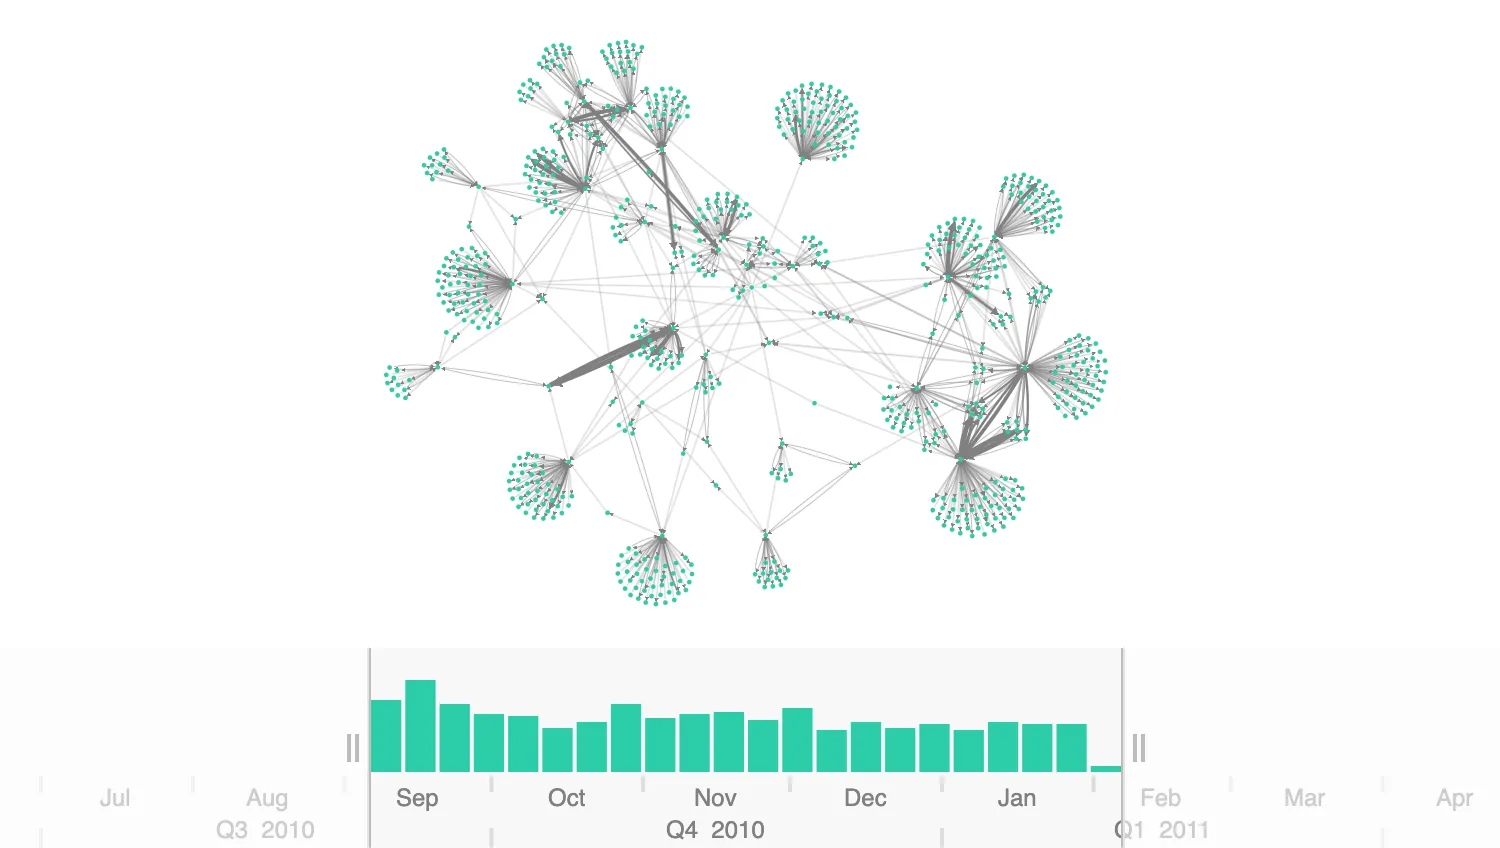
Chart and Time Bar
Integrate chart with a time bar and use it as a chart filter.
See example
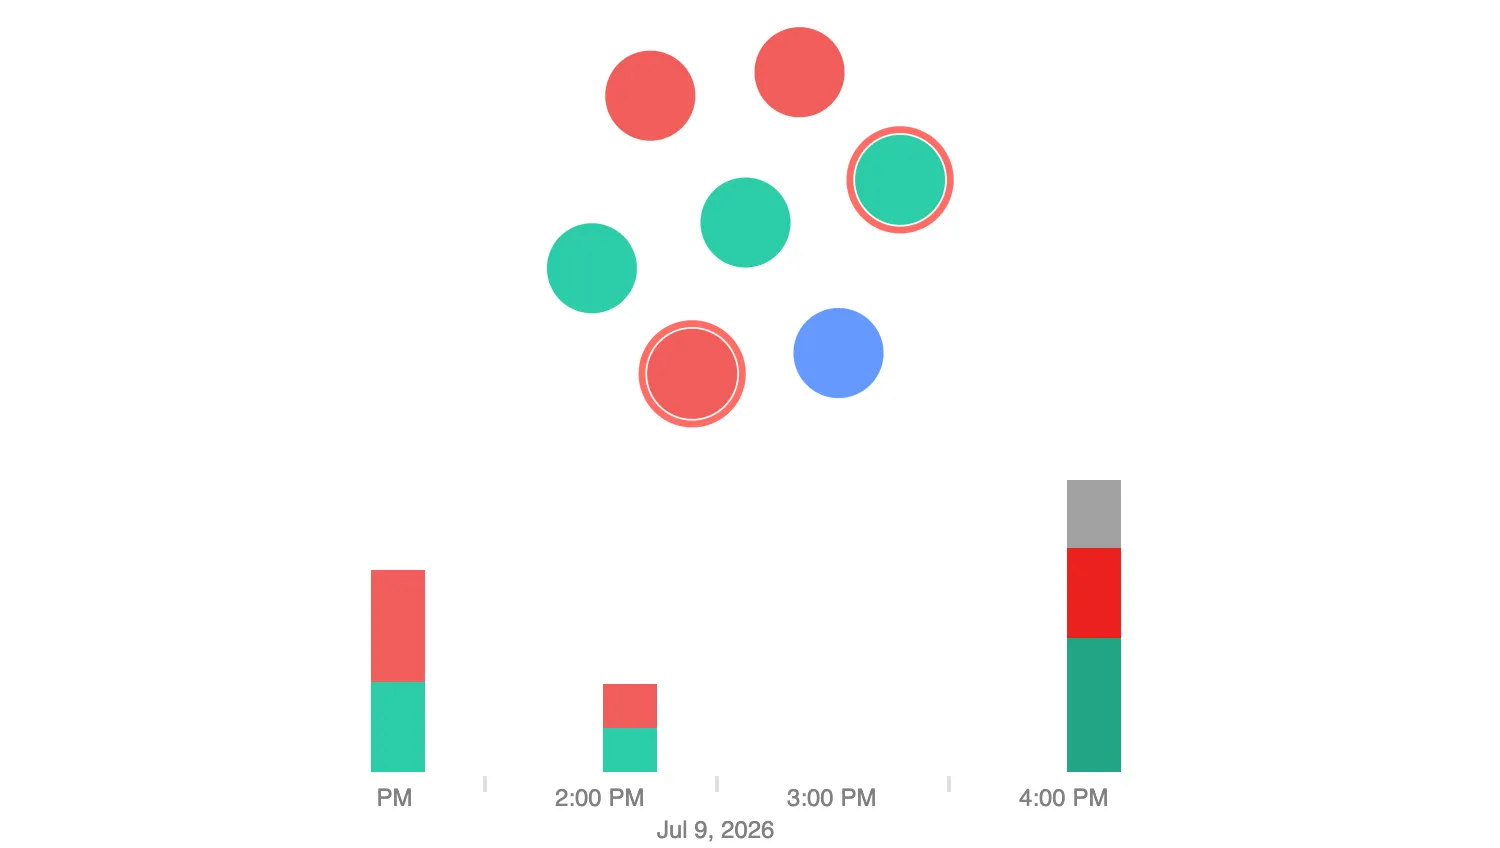
Chart and Stacked Bars
Visualize multiple groups of chart items with stacked bars.
See example
Chart Options
Dark Mode
Explore dark background and navigation for dark theme charts.
See example
Background Gradient
Customize chart background with gradient colors.
See example
Hand Mode Off
Explore marquee selection mode in charts.
See example
Hand Mode On
Explore hand mode in charts.
See example
Navigation
Reposition or disable the navigation controls.
See example
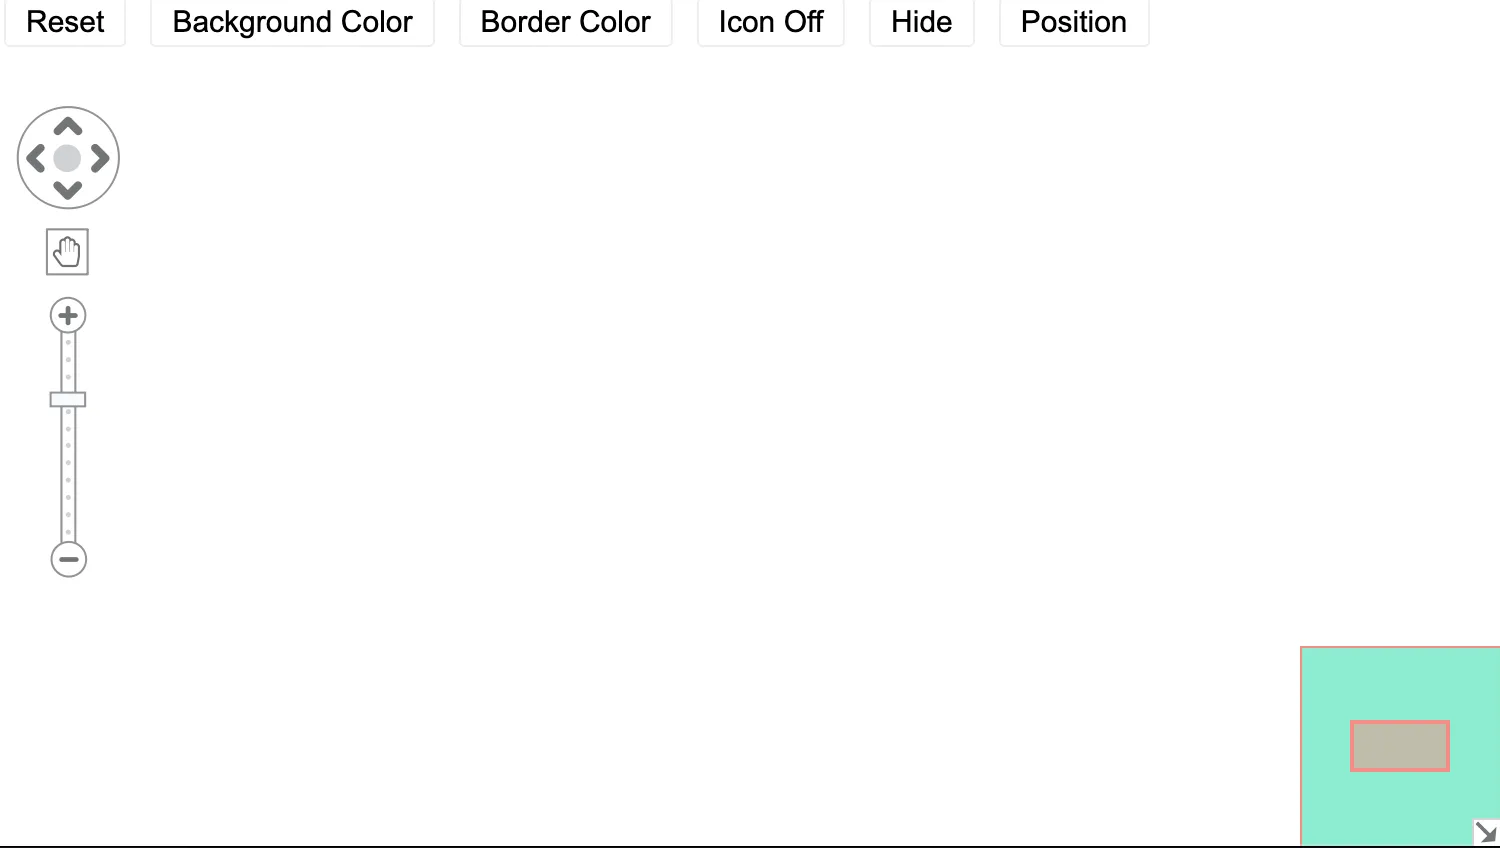
Overview Window
Customize, reposition or disable the overview window.
See example

Selection Color
Customize the appearance of selected items.
See example
Advanced
Animation
Explore how ReGraph animates changes to its state.
See example
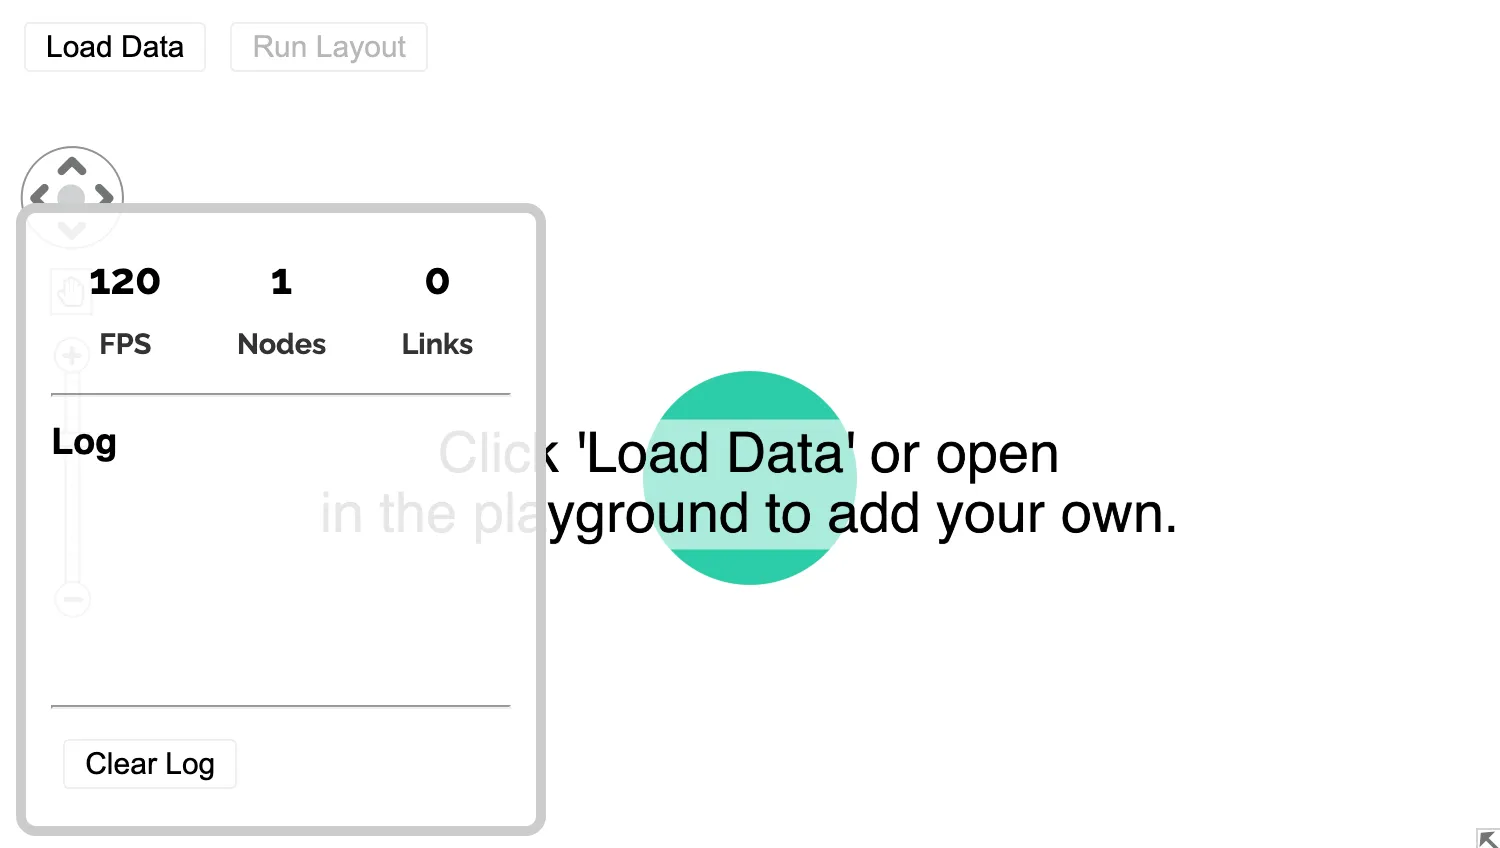
Performance
Measure how well ReGraph performs.
See example
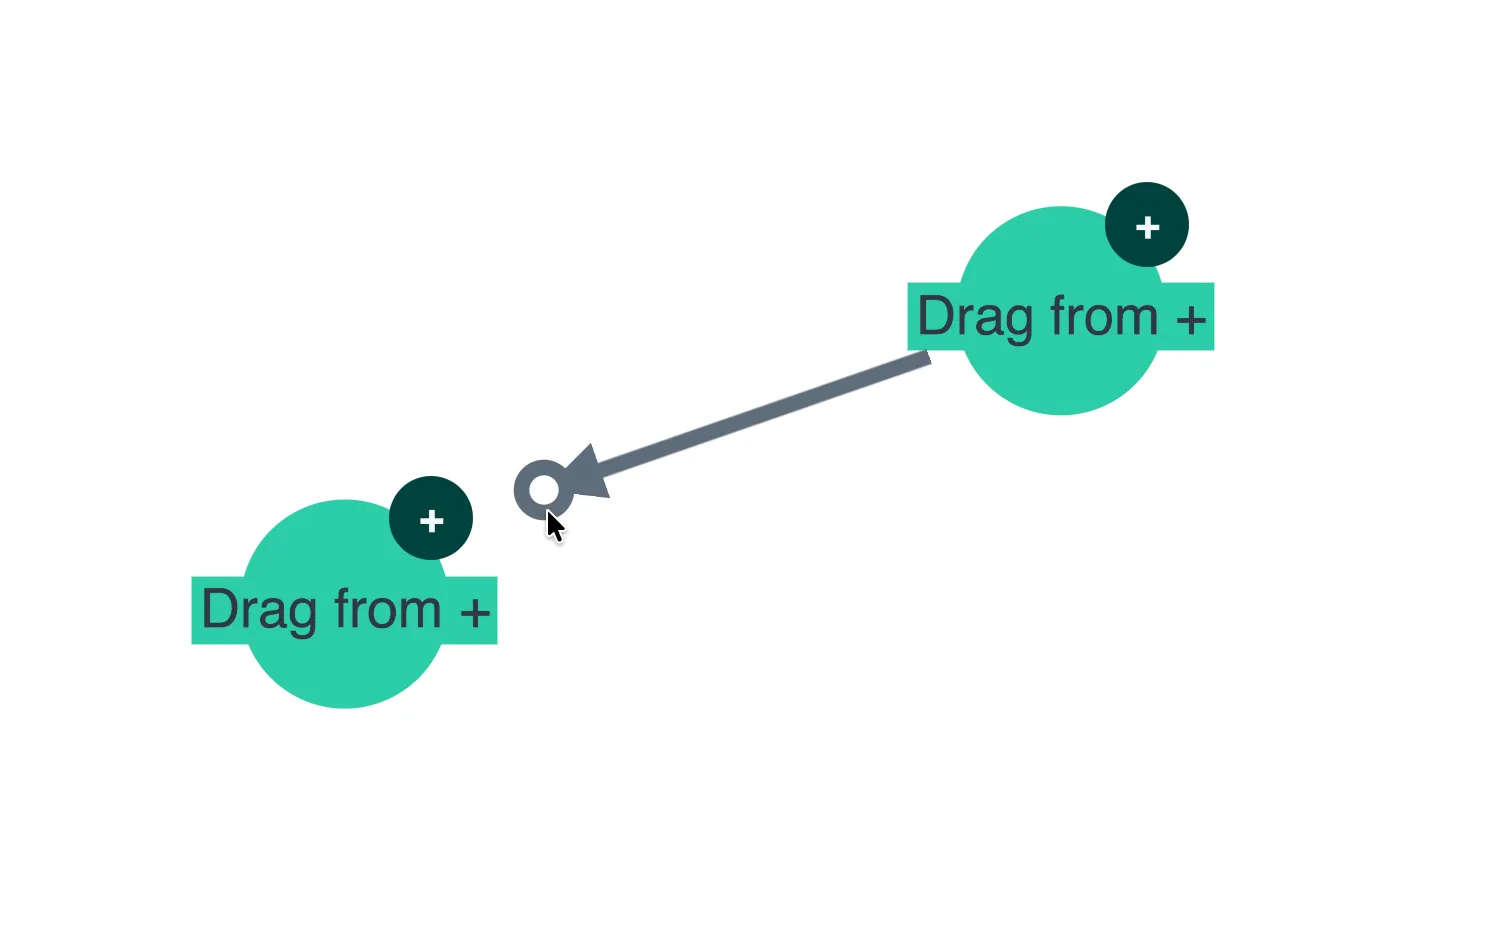
Create Link
Create links between nodes with custom link draggers.
See example
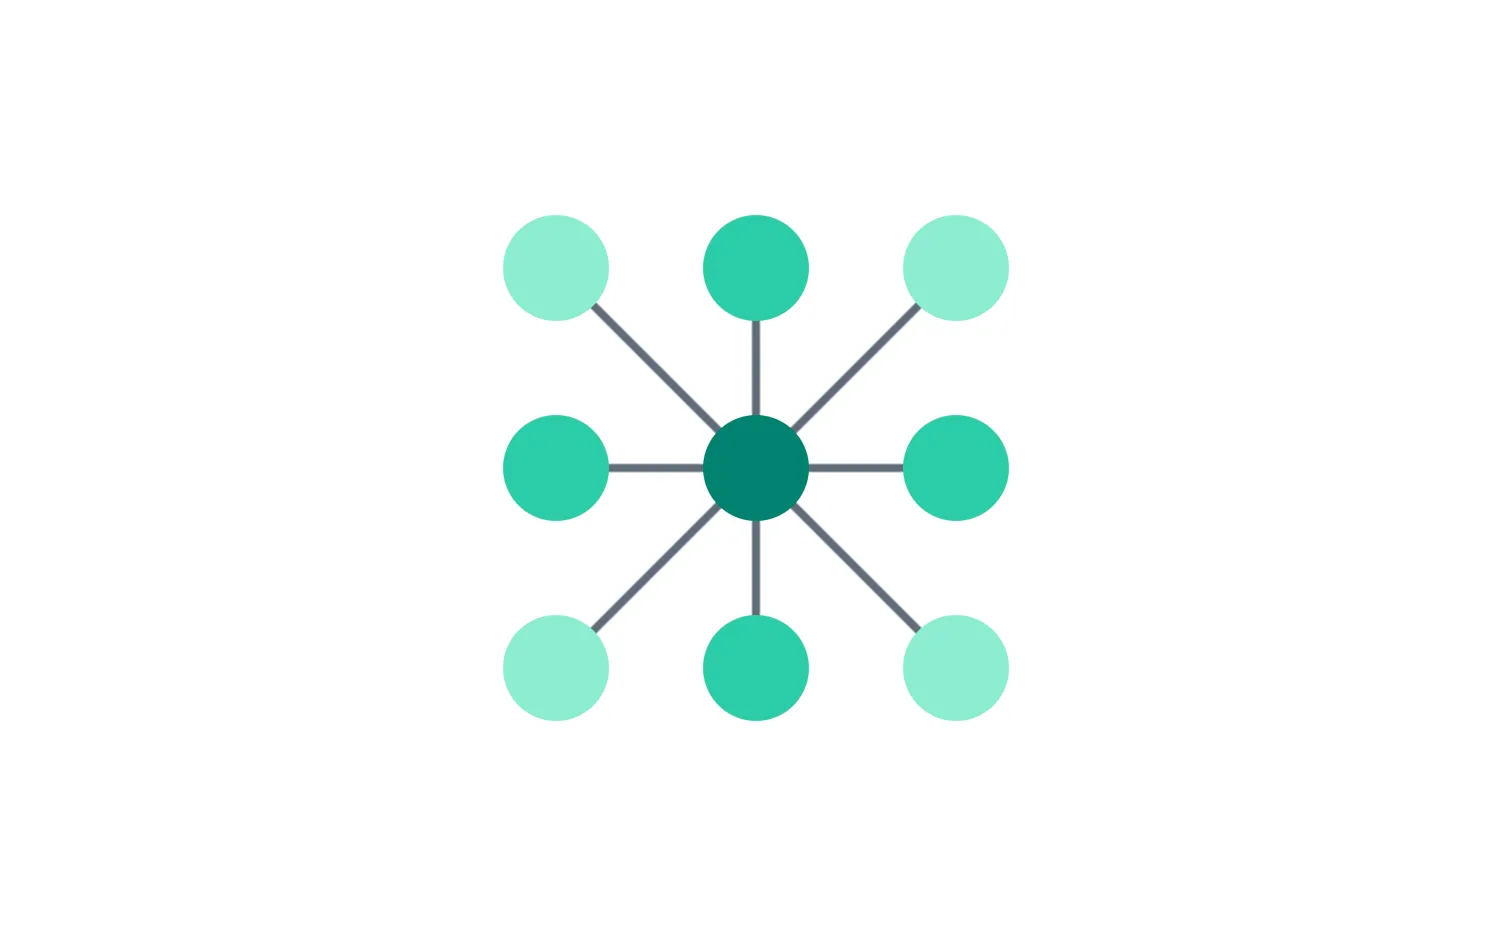
Snap To Grid
Snap dragged nodes to a grid at the end of a drag.
See example
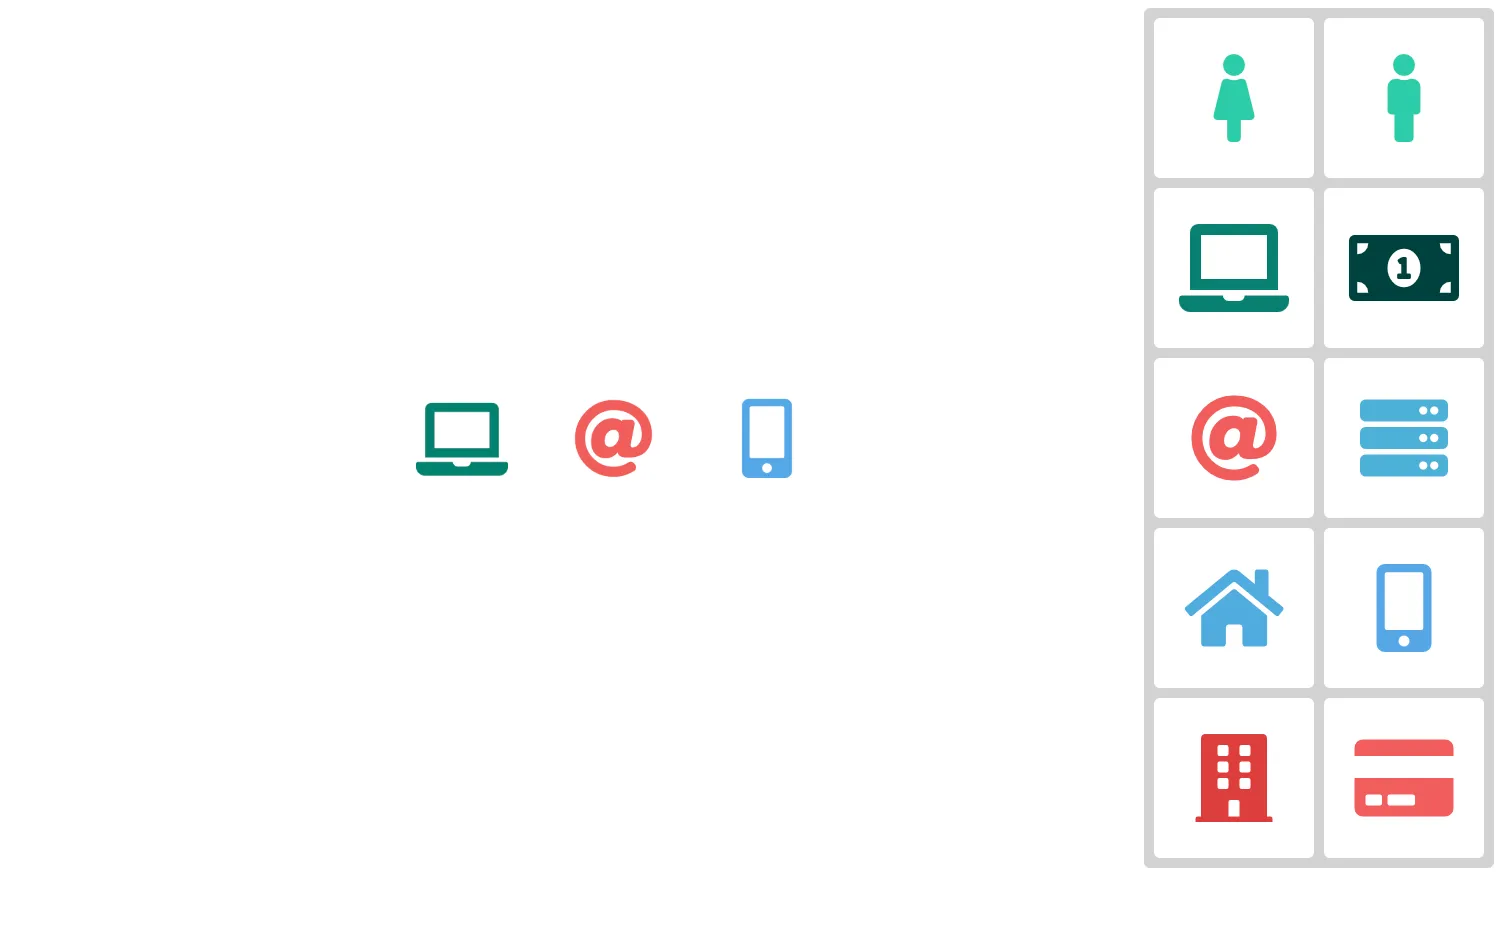
Drag and Drop
Drag items onto the chart to create a network.
See example
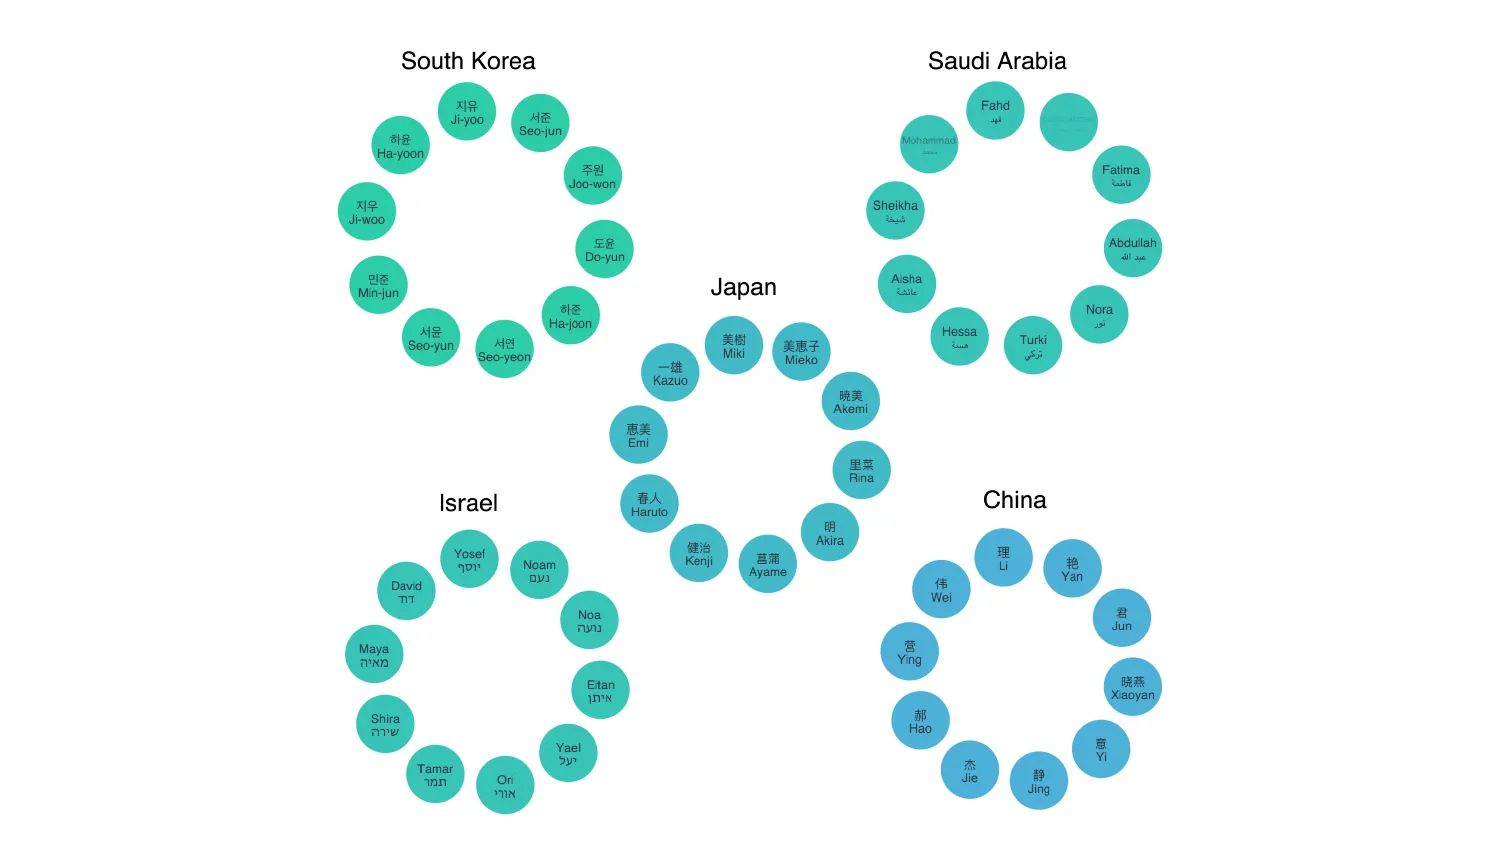
Right to Left Text
See how ReGraph supports international languages.
See example
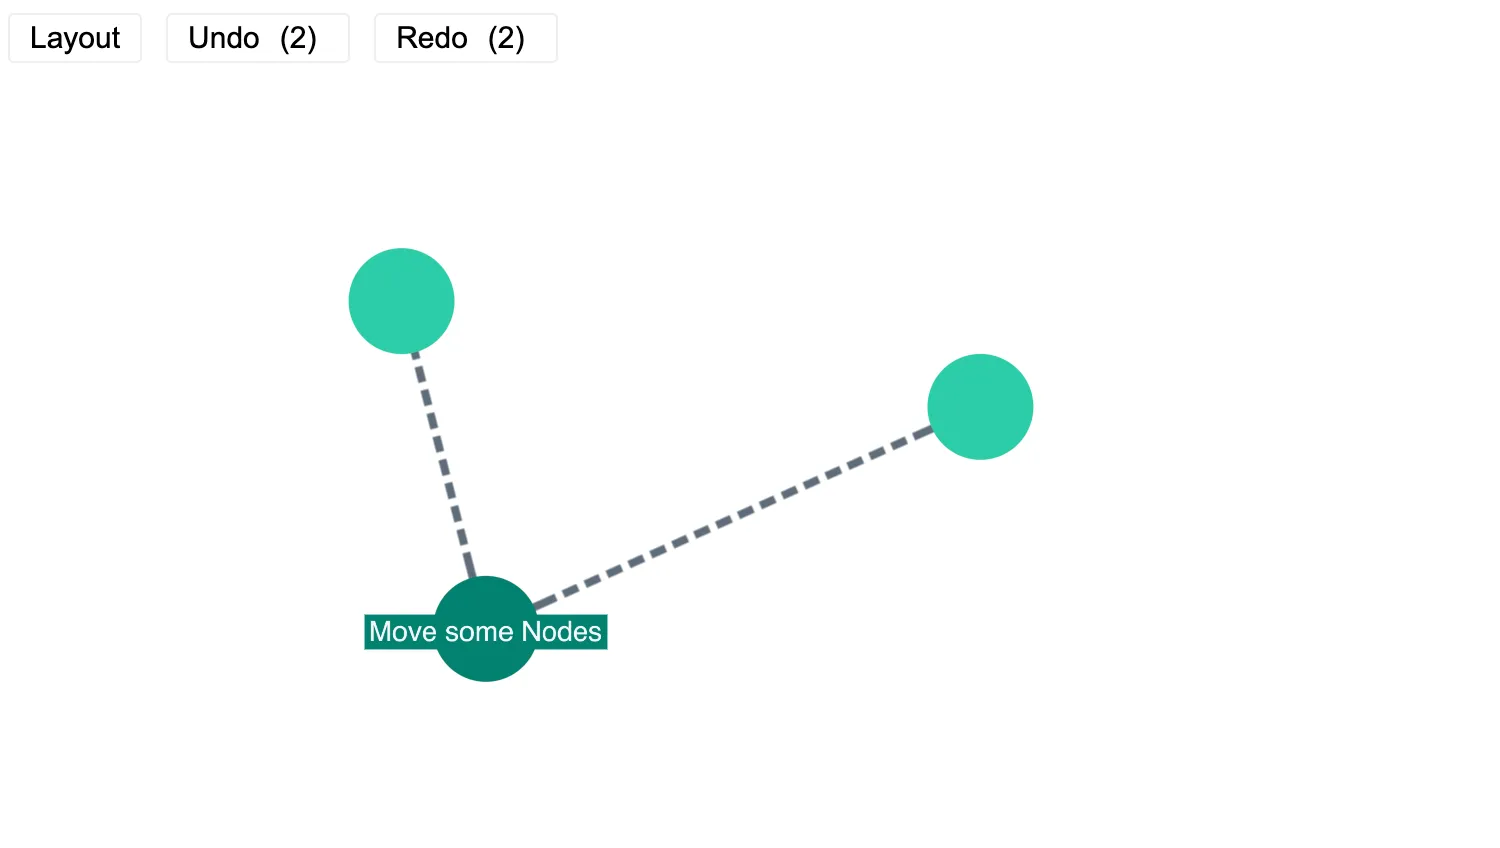
Undo / Redo
Save, undo and restore changes in the chart.
See example
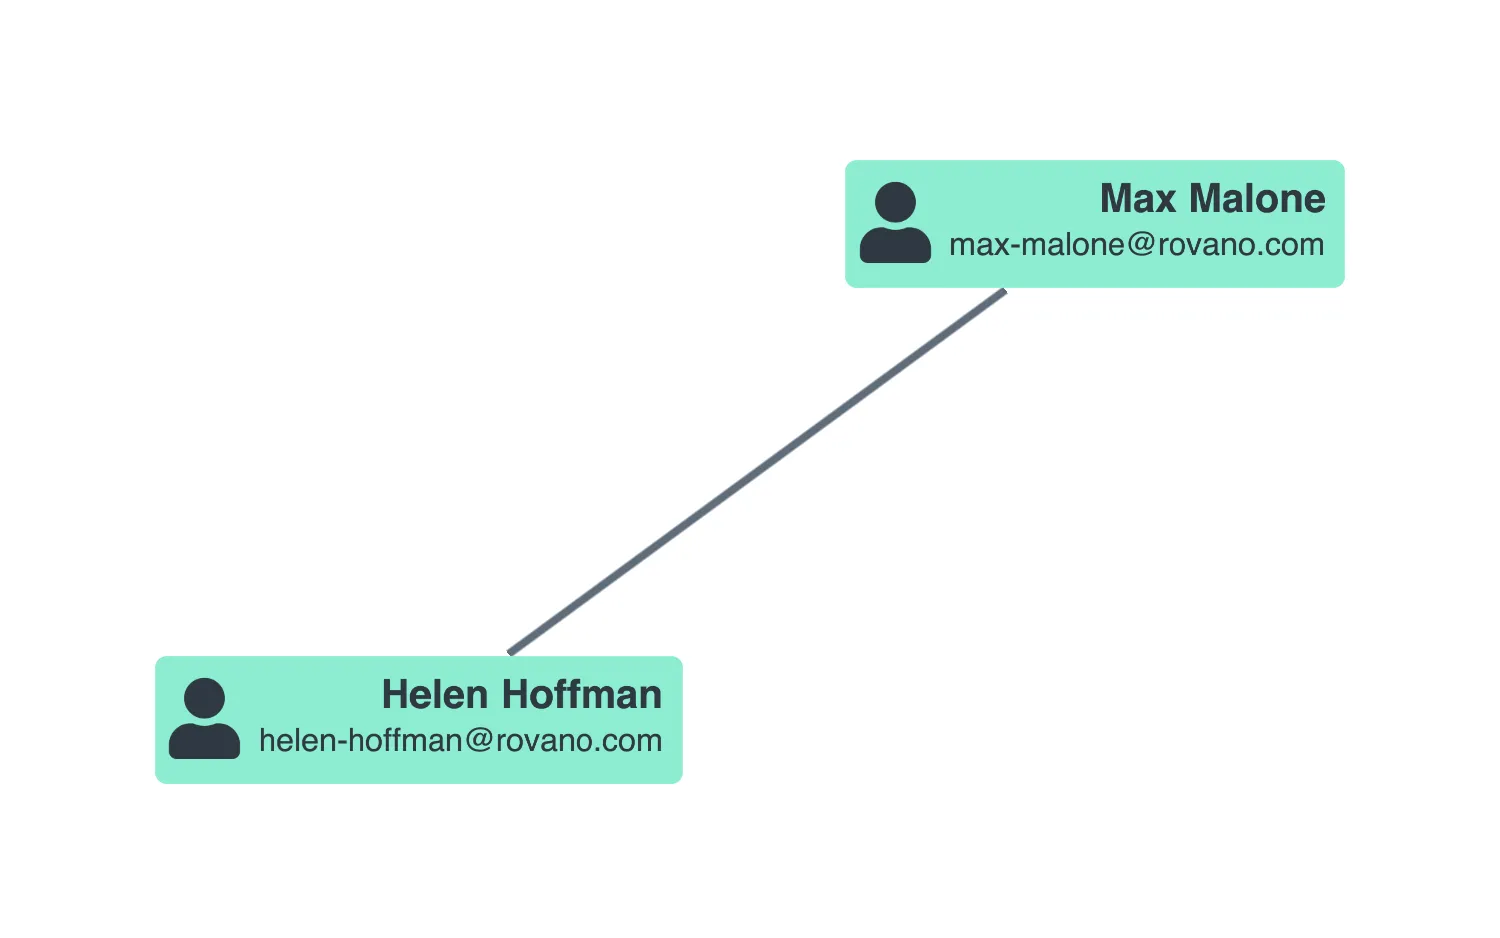
Edit Labels
Add a text editing functionality to your labels.
See example
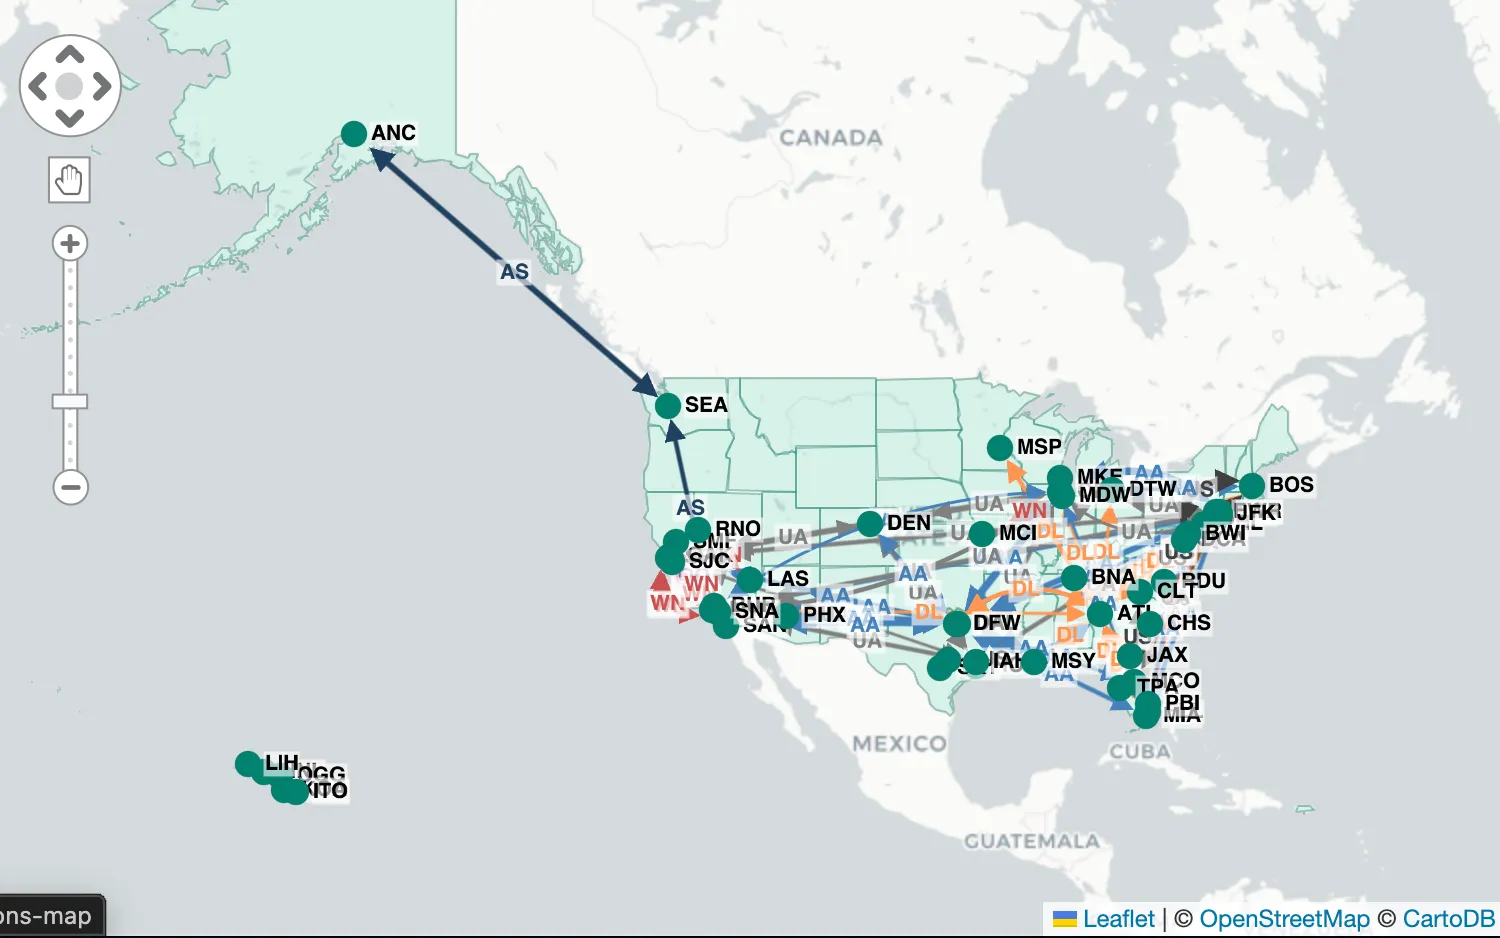
Interacting with Leaflet
Enhance your charts with a map background by Leaflet.
See example
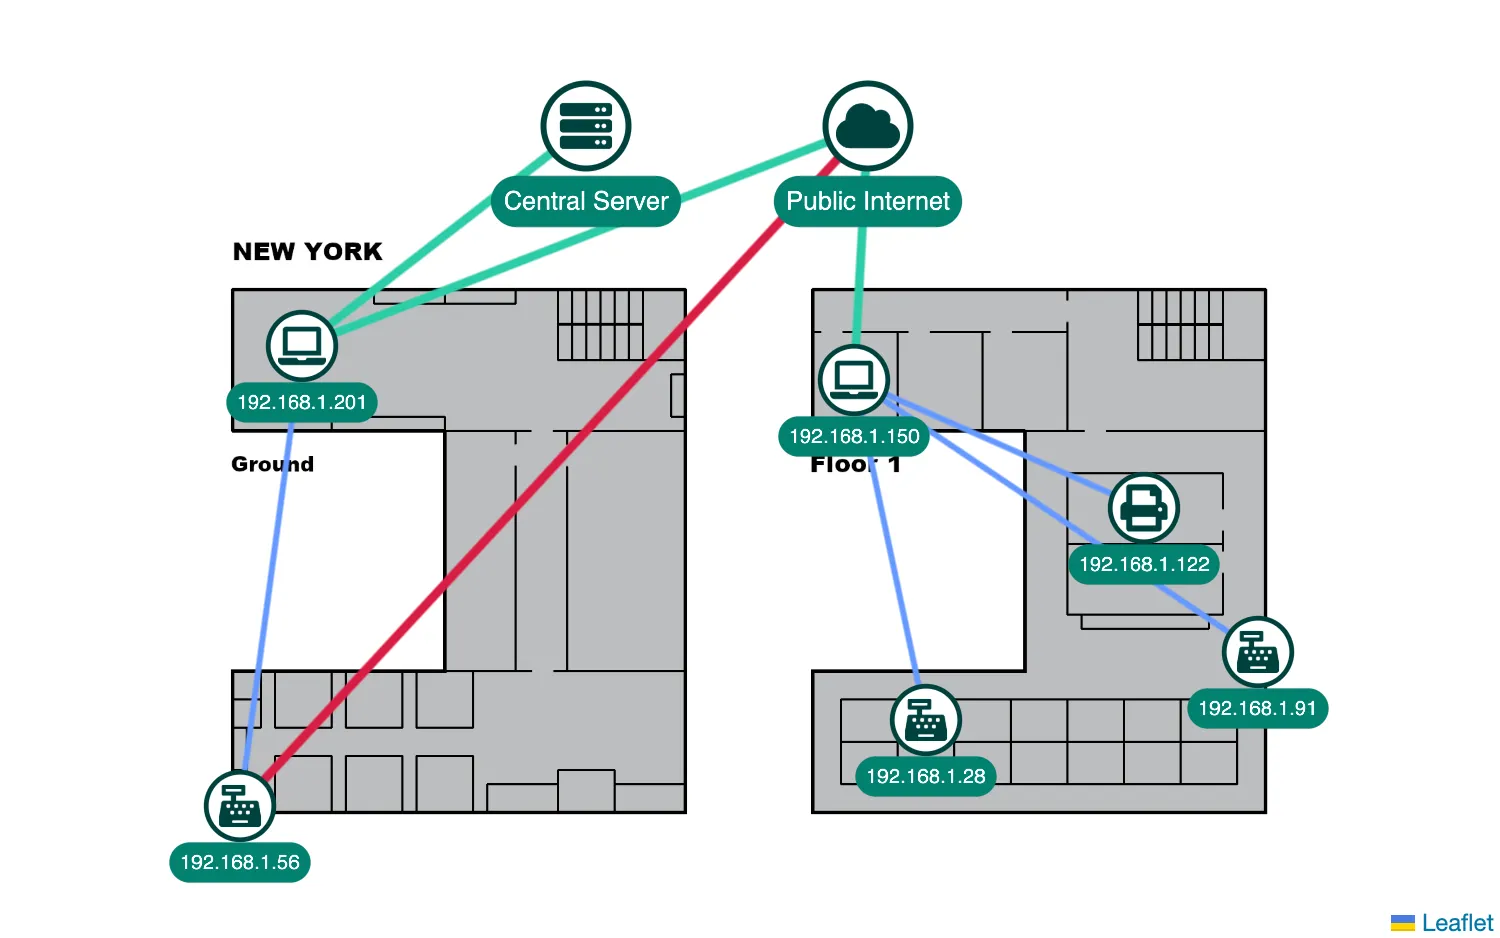
Using Images with Leaflet
Create floorplans and projections with images and CRS.
See example