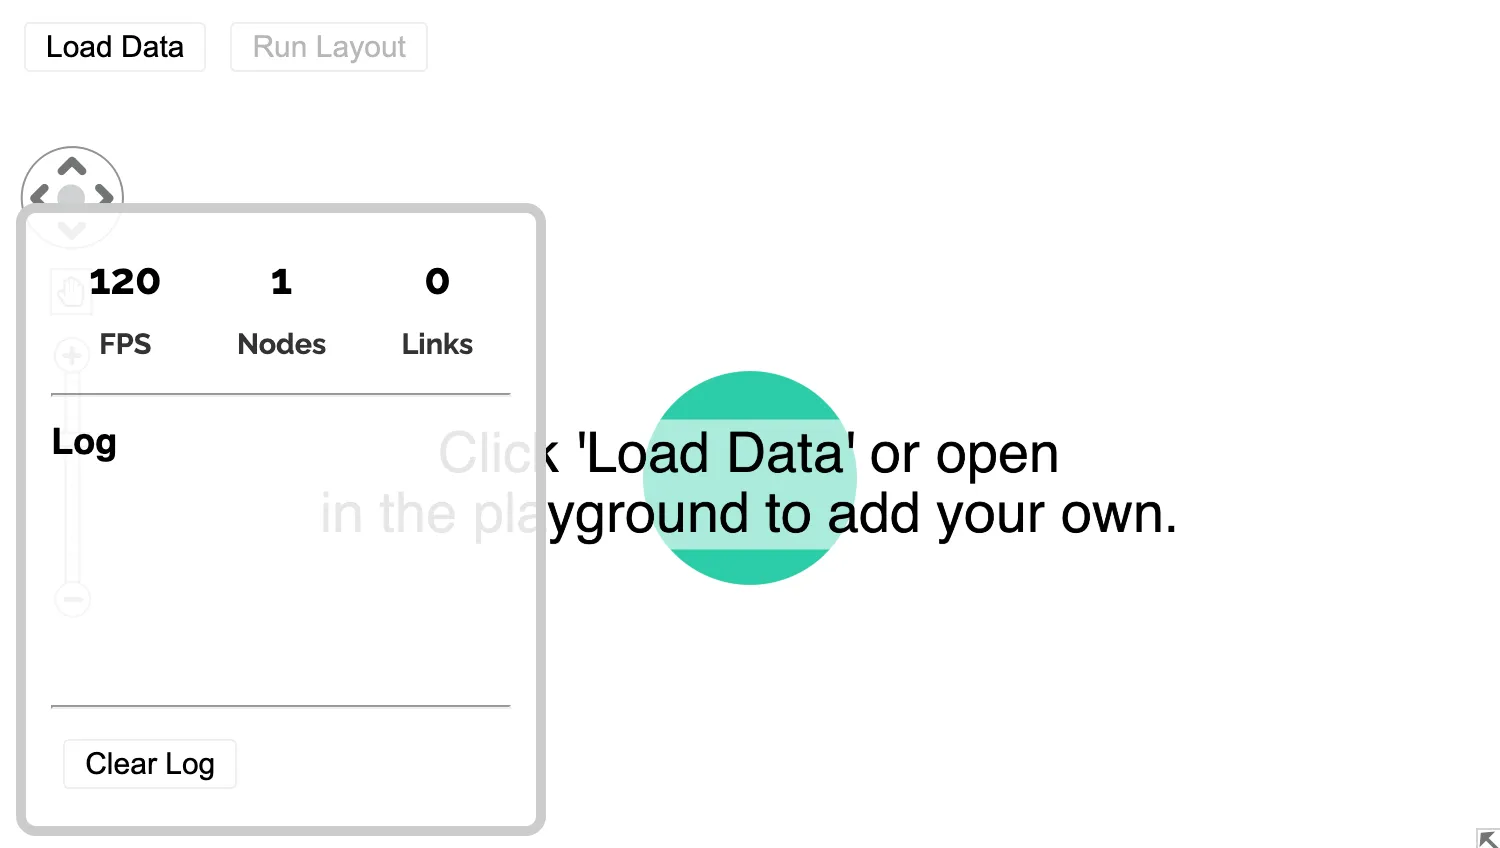
ReGraph has excellent performance capability for a variety of datasets.
Click 'Load Data' to generate data onto the chart and analyse performance. Alternatively, open in the playground to add your own dataset.
You can see the example's styling in the CSS tab or modify the CSS in the playground.
import React, { useEffect, useMemo, useState } from "react";
import { createRoot } from "react-dom/client";

import random from "lodash/random";
import round from "lodash/round";
import { Chart } from "regraph";

import { generateItems, initialChartItems } from "./data";

export function Demo() {
  const [state, setState] = useState({
    items: initialChartItems,
    action: null,
    isLoading: false,
    layout: {
      name: "organic",
    },
    positions: {},
  });
  const [logOutput, setLogOutput] = useState([]);
  const [startTime, setStartTime] = useState(0);

  // Resets start time on chart load.
  useEffect(() => {
    setStartTime(window.performance.now());
  }, [state.isLoading]);

  /**
   * Trigger a layout rerun.
   */
  function runLayout() {
    setState((current) => ({
      ...current,
      isLoading: true,
      action: "Ran layout",
      positions: {},
    }));
  }

  /**
   * Loads the data onto the chart.
   */
  function loadData() {
    const items = generateItems();

    setState((current) => ({
      ...current,
      positions: {},
      items: {},
    }));

    // This 1ms delay ensures that - for this specific scenario - the state items
    // and positions are emptied before repopulating them, preventing React from
    // combining both state changes in one render.
    setTimeout(() => {
      setState((current) => ({
        ...current,
        isLoading: true,
        action: "Loaded data",
        items,
        positions: generatePositions(items),
      }));
    }, 1);
  }

  /**
   * Calculates action duration and appends output on each change to chart items or
   * layout.
   */
  function onChange({ why }) {
    if (why === "auto" && state.isLoading) {
      const timeElapsed = round(
        (window.performance.now() - startTime) / 1000,
        2,
      ).toFixed(2);
      const currentTimestamp = new Date().toTimeString().substring(0, 8);
      const message = `${currentTimestamp} - ${state.action} in ${timeElapsed}s.`;
      setLogOutput((logs) => [message, ...logs]);
      setState((current) => ({
        ...current,
        isLoading: false,
      }));
    }
  }

  return (
    <div className="story-performance">
      <header>
        <button type="button" onClick={loadData}>
          Load Data
        </button>
        <button
          type="button"
          onClick={runLayout}
          disabled={state.action === null}
        >
          Run Layout
        </button>
      </header>
      <Chart
        items={state.items}
        className="chart"
        onChange={onChange}
        layout={state.layout}
        positions={state.positions}
      />
      <Stats
        items={state.items}
        logMessages={logOutput}
        setLogMessages={setLogOutput}
      />
      <LoadingOverlay isLoading={state.isLoading} />
    </div>
  );
}

function Stats({ items, logMessages, setLogMessages }) {
  const [framesPerSecond, setFramesPerSecond] = useState(0);

  // Retrieve number of nodes and links when items change.
  const metrics = useMemo(() => {
    let linkCount = 0;
    let nodeCount = 0;
    Object.keys(items).forEach((key) => {
      const item = items[key];
      if ("id1" in item) {
        linkCount += 1;
      } else {
        nodeCount += 1;
      }
    });
    return {
      nodeCount,
      linkCount,
    };
  }, [items]);

  // Listens for each new frame and calculates frames every second.
  useEffect(() => {
    let animationFrameId = 0;
    let frameCount = 0;
    let startTime = window.performance.now();

    function countFrame() {
      frameCount++;
      animationFrameId = window.requestAnimationFrame(countFrame);
    }

    const intervalId = setInterval(() => {
      const now = window.performance.now();
      const fps = Math.round((frameCount * 1000) / (now - startTime));
      setFramesPerSecond(fps);
      frameCount = 0;
      startTime = now;
    }, 1000);

    countFrame();

    return () => {
      window.cancelAnimationFrame(animationFrameId);
      clearInterval(intervalId);
    };
  }, []);

  return (
    <aside>
      <section>
        <table>
          <tbody>
            <tr>
              <td>{framesPerSecond}</td>
              <td>{metrics.nodeCount}</td>
              <td>{metrics.linkCount}</td>
            </tr>
          </tbody>
          <tfoot>
            <tr>
              <td>FPS</td>
              <td>Nodes</td>
              <td>Links</td>
            </tr>
          </tfoot>
        </table>
      </section>
      <hr />
      <section>
        <h4>Log</h4>
        <div className="log-output">
          <ol className="log-output-list">
            {logMessages.map((output, key) => {
              return <li key={key}>{output}</li>;
            })}
          </ol>
        </div>
        <hr />
        <button
          type="button"
          className="clear-logs"
          onClick={() => setLogMessages([])}
        >
          Clear Log
        </button>
      </section>
    </aside>
  );
}

function LoadingOverlay({ isLoading }) {
  if (!isLoading) return null;
  return (
    <div className="loading-overlay">
      <span>Loading...</span>
    </div>
  );
}

/**
 * Generates random positions for each node on the chart.
 */
function generatePositions(items) {
  const itemsCount = Object.keys(items).length;
  const bounds = {
    maxX: itemsCount,
    maxY: itemsCount,
    minX: -itemsCount,
    minY: -itemsCount,
  };
  const positions = {};

  Object.keys(items).forEach((key) => {
    const item = items[key];
    if ("id1" in item) {
      return;
    }

    const nextX = random(bounds.minX, bounds.maxX);
    const nextY = random(bounds.minY, bounds.maxY);

    positions[key] = { x: nextX, y: nextY };
  });

  return positions;
}

const root = createRoot(document.getElementById("regraph"));
root.render(<Demo />);import random from "lodash/random";
import { style } from "@ci/theme/rg/js/storyStyles";
// Add initial data here...
export const initialChartItems = {
node0: {
...style.primary1,
size: 2,
label: {
text: "Click 'Load Data' or open\nin the playground to add your own.",
},
},
};
// Add your own logic to generate data here...
export function generateItems() {
const nodes = generateNodes();
const links = generateLinks(nodes);
return { ...nodes, ...links };
}
function generateNodes() {
const nodes = {};
for (let i = 0; i < 500; i += 1) {
nodes[`node${i}`] = { ...style.primary1 };
}
return nodes;
}
function generateLinks(nodes) {
const nodeIds = Object.keys(nodes);
const links = {};
for (let i = 0; i < nodeIds.length; i += 5) {
const currentNodeId = nodeIds[i];
for (let j = 1; j <= 5; j++) {
const targetNodeId = nodeIds[i + j];
addLink(links, currentNodeId, targetNodeId);
}
if (Math.random() > 0.7) {
const targetNodeId = `node${random(nodeIds.length)}`;
addLink(links, currentNodeId, targetNodeId);
}
}
return links;
}
function addLink(links, sourceId, targetId) {
links[`link-${sourceId}-${targetId}`] = {
id1: sourceId,
id2: targetId,
width: 8,
};
}<!doctype html>
<html>
<head>
<link rel="stylesheet" href="./style.css" />
</head>
<body>
<div id="regraph" style="height: 100vh"></div>
<script type="module" src="./code.jsx"></script>
</body>
</html>.story-performance {
display: flex;
flex-direction: column;
height: 100%;
}
.story-performance header {
padding: 0.5em;
}
.story-performance header button:disabled {
cursor: not-allowed;
}
.story-performance aside {
background-color: rgba(255, 255, 255, 0.9);
border-radius: 10px;
border: 5px solid #ccc;
bottom: 10px;
color: #000;
font-size: 18px;
left: 10px;
min-width: 230px;
padding: 0.7em;
position: absolute;
z-index: 3;
}
.story-performance table {
border-spacing: 0.2em;
font-family: "Raleway", sans-serif;
width: 100%;
}
.story-performance table td {
text-align: center;
}
.story-performance table tbody td {
font-size: 1.2em;
font-weight: bold;
}
.story-performance table tfoot td {
color: rgba(0, 0, 0, 0.8);
font-size: 0.8em;
font-weight: bold;
}
.story-performance h4 {
margin: 0.5em 0;
}
.story-performance div.log-output {
height: 100px;
overflow-x: hidden;
overflow-y: auto;
}
.story-performance ol.log-output-list {
font-size: 0.8em;
list-style-type: none;
margin: 0;
padding: 0;
}
.story-performance div.chart {
height: 100%;
}
.story-performance div.loading-overlay {
align-items: center;
background: rgba(255, 255, 255, 0.6);
color: rgba(0, 0, 0, 0.7);
cursor: wait;
display: flex;
font-size: 2em;
font-weight: bold;
height: 100%;
justify-content: center;
position: absolute;
width: 100%;
z-index: 2;
}