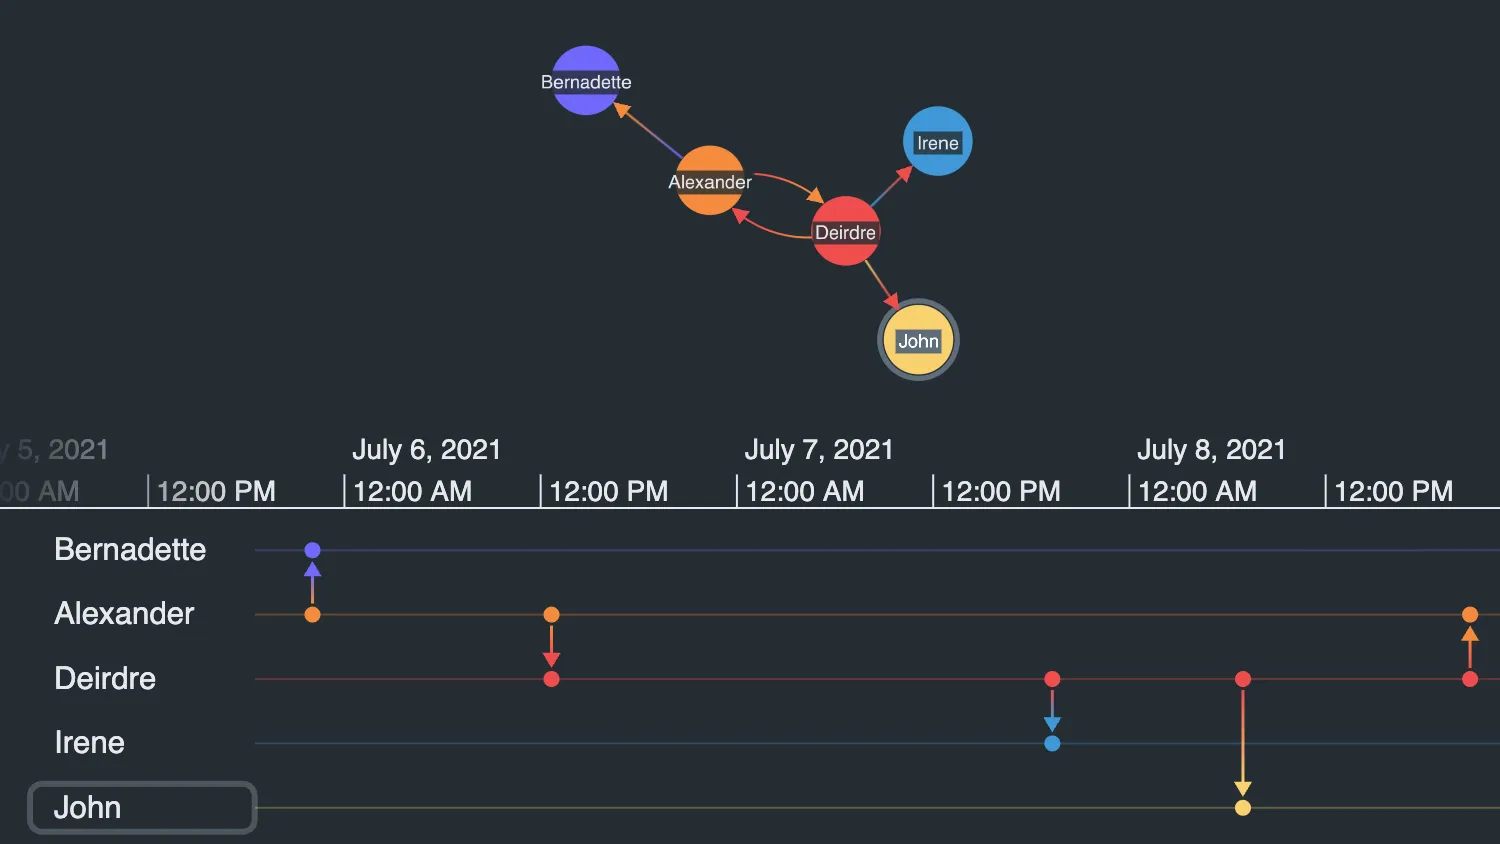
This example shows an integration between KronoGraph and KeyLines.
Select nodes in the chart and see them reflected in the timeline. Pan and zoom the timeline to filter the chart by time.
Toggle whether to reflect any selected chart nodes as selected entities or focused entities.
We're handling entity-selection-change, focus and range events to keep the two components in sync. When the timeline changes, getInRangeItems returns the visible items.
See also:
This example shows an integration between KronoGraph and ReGraph.
Select nodes in the chart and see them reflected in the timeline. Pan and zoom the timeline to filter the chart by time.
Toggle whether to reflect any selected chart nodes as selected entities or focused entities.
We're using the entitySelection, focus and range props to keep the two components in sync. When the timeline changes, getInRangeItems returns the visible items.
See also:
import { createTimeline } from "kronograph";
import KeyLines from "keylines";
import { isEmpty } from "lodash";
import { chartData, timelineData, timelineOptions, chartOptions } from "./data";

async function main() {
  // Allow entities to be focused or selected
  const focusEntity = document.getElementById("toggle-focus");
  const selectEntity = document.getElementById("toggle-select");

  let selectIsChecked = true;

  function enableFocus(event) {
    if (event.target.checked) {
      selectIsChecked = false;
      clearSelections();
      timelineOptions.controls.focus.show = true;
      timeline.options(timelineOptions);
      timeline.entitySelectionEnabled(false);
    }
  }

  function enableSelect(event) {
    if (event.target.checked) {
      selectIsChecked = true;
      clearSelections();
      timelineOptions.controls.focus.show = false;
      timeline.options(timelineOptions);
      timeline.entitySelectionEnabled(true);
    }
  }

  // Selections are cleared on change
  function clearSelections() {
    timeline.entitySelection([]);
    timeline.focus([]);
    chart.selection([]);
    chart.foreground(() => true);
    timeline.fit(timelineData);
  }

  async function applySelection(selection, fadeNeighbors) {
    chart.selection(selection);
    const selectedNodeIds = selection.filter(
      (itemId) => chart.getItem(itemId).type === "node",
    );

    if (fadeNeighbors) {
      //focus
      timeline.focus(selectedNodeIds);
      const neighborsOfSelection = await chart.graph().neighbours(selection);
      if (isEmpty(selection)) {
        // If nothing is selected, nothing is faded.
        chart.foreground(() => true);
      } else {
        // Fade nodes that are neither themselves selected nor neighboring a selected node.
        chart.foreground(
          (node) =>
            selection.includes(node.id) ||
            neighborsOfSelection.nodes.includes(node.id),
        );
      }
    } else {
      // select
      timeline.entitySelection(selectedNodeIds);
    }
  }

  async function timelineRangeHandler() {
    // When timeline range changes, filter the items in the KeyLines chart.
    const selection = timeline.entitySelection();
    const { entities: visibleEntityIds } = timeline.getInRangeItems({
      focus: false,
    });
    const filterOptions = { type: "node", animate: false };
    const { shown, hidden } = await chart.filter(
      (item) => visibleEntityIds[item.id],
      filterOptions,
    );

    timeline.entitySelection(selection);
    chart.selection(selection);

    if (!isEmpty(shown.nodes) || !isEmpty(hidden.nodes)) {
      await chart.layout("organic");
    }
  }

  const chart = await KeyLines.create({
    container: "chart",
    options: chartOptions,
  });
  const timeline = createTimeline({
    container: "timeline",
    options: timelineOptions,
  });

  timeline.set(timelineData);
  timeline.fit();
  timeline.entitySelectionEnabled(true);

  focusEntity.addEventListener("change", enableFocus);
  selectEntity.addEventListener("change", enableSelect);

  // Fade neighbors on the chart if entities are focused
  chart.on("selection-change", () =>
    applySelection(chart.selection(), focusEntity.checked),
  );

  // prevent selection of links
  chart.on("click", (event) => {
    if (event.id) {
      const item = chart.getItem(event.id);
      if (item.type === "link") {
        event.preventDefault();
      }
    }
  });

  // When the focus or entity selection on the timeline changes, update the KeyLines chart.
  timeline.on("focus", ({ focus }) => applySelection(focus, true));
  timeline.on("entity-selection-change", ({ entitySelection }) =>
    applySelection(entitySelection, false),
  );
  timeline.on("range", timelineRangeHandler);

  timeline.on("double-click", ({ preventDefault }) => {
    // Prevent default behavior of focus on double click, when the 'Select' button is on
    if (selectIsChecked) {
      preventDefault();
    }
  });

  await chart.load(chartData);
  await chart.layout();
  await chart.zoom("fit");
}

main();function isLink(item) {
return item.type === "link";
}
const colorPalette = {
lightBlueGray: "#e5e8eb",
darkBlueGray: "#242c32",
darkBlueGrayAlpha: "rgba(36, 44, 50, 0.8)",
blueGray: "#606d7b",
orange: "#f58a3d",
purple: "#7069FA",
red: "#ef4e4e",
blue: "#4098D7",
yellow: "#f7d06e",
};
export const timelineOptions = {
focus: {
backgroundColor: colorPalette.blueGray,
},
scales: { showAtBottom: false },
controls: { focus: { show: false } },
};
export const chartOptions = {
backgroundAlpha: 0.3,
backColour: colorPalette.darkBlueGray,
selectionColour: colorPalette.blueGray,
navigation: { shown: false },
controlTheme: "dark",
handMode: true,
minZoom: 0.2,
overview: false,
};
const nodes = [
{ t: "Alexander", c: colorPalette.orange },
{ t: "Bernadette", c: colorPalette.purple },
{ t: "Deirdre", c: colorPalette.red },
{ t: "Irene", c: colorPalette.blue },
{ t: "John", c: colorPalette.yellow },
].map((node, idx) => {
return {
...node,
type: "node",
id: `${idx + 1}`,
fc: colorPalette.lightBlueGray, // label text color
fbc: colorPalette.darkBlueGrayAlpha, // label text background color
};
});
const links = [
{ id1: "1", id2: "2", time: 1625518983000 },
{ id1: "1", id2: "3", time: 1625571591000 },
{ id1: "3", id2: "4", time: 1625681838000 },
{ id1: "3", id2: "5", time: 1625723792000 },
{ id1: "3", id2: "1", time: 1625773792000 },
].map((link, idx) => {
const { c: c2 } = nodes.find((node) => node.id === link.id1);
const { c } = nodes.find((node) => node.id === link.id2);
return {
...link,
type: "link",
id: `a${idx + 1}`,
c, // link color at id1 end
c2, // link color at id2 end
a2: true, // show arrow at id2 end
w: 1.5, // width
d: { time: new Date(link.time) },
};
});
export const chartData = {
type: "LinkChart",
items: [...nodes, ...links],
};
const entities = {};
const events = {};
chartData.items.forEach((item) => {
if (isLink(item)) {
events[item.id] = { time: item.d.time, entityIds: [item.id1, item.id2] };
} else {
entities[item.id] = {
color: item.c,
label: item.t,
};
}
});
export const timelineData = { events, entities };<!doctype html>
<html>
<head>
<link rel="stylesheet" href="@ci/theme/kg/css/examples.css" />
</head>
<body>
<div style="display: flex; flex-direction: column; height: 100%">
<div id="chart" style="flex: 1"></div>
<div id="timeline" style="flex: 1"></div>
<div class="story__controls story__controls--row story__controls__center-align">
<label>Show selected chart nodes as:</label>
<label for="toggle-select">Selected entities</label>
<input type="radio" id="toggle-select" name="choice" class="radio-button" checked />
<label for="toggle-focus">Focused entities</label>
<input type="radio" id="toggle-focus" name="choice" class="radio-button" />
</div>
</div>
<script type="module" src="./code.js"></script>
</body>
</html>import React, { useState, useRef, useMemo } from "react";
import { createRoot } from "react-dom/client";
import Timeline from "kronograph/react/Timeline";
import { Chart } from "regraph";
import { neighbors } from "regraph/analysis";
import { pickBy, mapValues } from "lodash";
import {
chartData,
timelineData,
initialTimelineOptions,
chartOptions,
} from "./data";
function isLink(item) {
return item.id1 && item.id2;
}
function preventLinkSelection(event) {
const item = chartData[event.id];
if (item && isLink(item)) {
event.preventDefault();
}
}
export const Demo = () => {
// State of the radio buttons
const [selectChecked, setSelectChecked] = useState(true);
// Timeline states
const timeline = useRef(null);
const [focusedEntities, setFocusedEntities] = useState([]);
const [selectedEntities, setSelectedEntities] = useState([]);
// Chart states
const [chartItems, setChartItems] = useState(chartData);
const timelineOptions = useMemo(() => {
return {
...initialTimelineOptions,
controls: {
...initialTimelineOptions.controls,
focus: {
show: !selectChecked,
},
},
};
}, [selectChecked]);
async function chartInteractionHandler({ id, selected, setStyle }) {
if (selected) {
// When in focus mode, fade everything except for neighbors of the selected item, and the selected item itself.
if (!selectChecked) {
const neighborsOfSelected = await neighbors(chartItems, id);
setStyle(
mapValues(chartItems, (_item, itemId) => {
return {
fade: !neighborsOfSelected[itemId] && itemId !== id,
};
}),
);
}
}
}
function timelineChangeHandler({ range, focus, entitySelection }) {
// When timeline range changes, filter the items in the ReGraph chart.
if (range) {
const { entities, events } = timeline.current.getInRangeItems({
focus: false,
});
setChartItems(
pickBy(chartData, (_item, id) => events[id] || entities[id]),
);
}
// In the ReGraph chart, select all items that are focused or selected entities in the timeline.
if (focus) {
setFocusedEntities(focus);
} else if (entitySelection) {
setSelectedEntities(entitySelection);
}
}
function chartChangeHandler({ selection, why }) {
// If the chart was changed from a range event, the selection should be retairnd
if (why === "auto") {
return;
}
// In the timeline, focus or select all items that are selected in the ReGraph chart.
if (selection) {
if (!selectChecked) {
setFocusedEntities(Object.keys(selection));
} else {
setSelectedEntities(Object.keys(selection));
}
}
}
// When the 'Select' button is on, the focus icon is disabled and entities may be selected on click
function selectChangeHandler(e) {
setSelectChecked(e.target.checked);
if (e.target.checked) {
clearSelections();
}
}
function focusChangeHandler(e) {
// When the 'Select' button is off, focus is on
setSelectChecked(!e.target.checked);
if (e.target.checked) {
clearSelections();
}
}
function clearSelections() {
setSelectedEntities([]);
setFocusedEntities([]);
}
// Determine the chart selection from either selected or focused entities
const chartSelection = selectChecked
? Object.fromEntries(selectedEntities.map((id) => [id, true]))
: Object.fromEntries(focusedEntities.map((id) => [id, true]));
return (
<div style={{ display: "flex", flexDirection: "column", height: "100%" }}>
<div style={{ position: "relative", flexGrow: 1 }}>
<Chart
id="chart"
items={chartItems}
selection={chartSelection}
options={chartOptions}
onClick={preventLinkSelection}
onChange={chartChangeHandler}
onItemInteraction={chartInteractionHandler}
style={{
height: "100%",
width: "100%",
position: "absolute",
}}
/>
</div>
<div style={{ position: "relative", flexGrow: 1 }}>
<Timeline
id="timeline"
{...timelineData}
ref={timeline}
focus={focusedEntities}
entitySelection={selectedEntities}
options={timelineOptions}
onTimelineChange={timelineChangeHandler}
onTimelineDoubleClick={({ preventDefault }) => {
if (selectChecked) {
preventDefault();
}
}}
entitySelectionEnabled={selectChecked}
style={{
height: "100%",
width: "100%",
position: "absolute",
}}
/>
</div>
<div style={{ flex: "0 0 auto" }}>
<div className="story__controls story__controls--row story__controls__center-align">
<div>Show selected chart nodes; :</div>
<label htmlFor="toggle-select">Selected entities</label>
<input
type="radio"
className="radio-button"
id="toggle-select"
name="choice"
checked={selectChecked}
onChange={selectChangeHandler}
/>
<label htmlFor="toggle-focus">Focused entities</label>
<input
type="radio"
className="radio-button"
id="toggle-focus"
name="choice"
checked={selectChecked}
onChange={focusChangeHandler}
/>
</div>
</div>
</div>
);
};
const root = createRoot(document.getElementById("my-timeline"));
root.render(<Demo />);import mapValues from "lodash/mapValues";
function isLink(item) {
return item.id1 && item.id2;
}
const colorPalette = {
lightBlueGray: "#e5e8eb",
darkBlueGray: "#242c32",
darkBlueGrayAlpha: "rgba(36, 44, 50, 0.8)",
blueGray: "#606d7b",
orange: "#f58a3d",
purple: "#7069FA",
red: "#ef4e4e",
blue: "#4098D7",
yellow: "#f7d06e",
};
export const initialTimelineOptions = {
focus: { backgroundColor: colorPalette.blueGray },
scales: { showAtBottom: false },
controls: { focus: { show: false } },
};
export const chartOptions = {
backgroundColor: colorPalette.darkBlueGray,
selection: { color: colorPalette.blueGray },
navigation: { visible: false },
controlTheme: "dark",
minZoom: 0.2,
overview: false,
};
const nodes = mapValues(
{
1: { name: "Alexander", color: colorPalette.orange },
2: { name: "Bernadette", color: colorPalette.purple },
3: { name: "Deirdre", color: colorPalette.red },
4: { name: "Irene", color: colorPalette.blue },
5: { name: "John", color: colorPalette.yellow },
},
({ name, color }) => {
return {
label: {
text: name,
backgroundColor: colorPalette.darkBlueGrayAlpha,
color: colorPalette.lightBlueGray,
},
color,
};
},
);
const links = mapValues(
{
a1: { id1: "1", id2: "2", timestamp: 1625518983000 },
a2: { id1: "1", id2: "3", timestamp: 1625571591000 },
a3: { id1: "3", id2: "4", timestamp: 1625681838000 },
a4: { id1: "3", id2: "5", timestamp: 1625723792000 },
a5: { id1: "3", id2: "1", timestamp: 1625773792000 },
},
(link) => {
return {
...link,
color: nodes[link.id2].color,
end2: { color: nodes[link.id1].color, arrow: true },
data: { time: new Date(link.timestamp) },
width: 1.5,
};
},
);
export const chartData = { ...nodes, ...links };
const entities = {};
const events = {};
Object.entries(chartData).forEach(([id, item]) => {
if (isLink(item)) {
events[id] = { time: item.data.time, entityIds: [item.id1, item.id2] };
} else {
entities[id] = { label: item.label.text, color: item.color };
}
});
export const timelineData = { events, entities };<!doctype html>
<html>
<head>
<link rel="stylesheet" href="@ci/theme/kg/css/examples.css" />
</head>
<body>
<div id="my-timeline" style="height: 100vh"></div>
<script type="module" src="./code.jsx"></script>
</body>
</html>