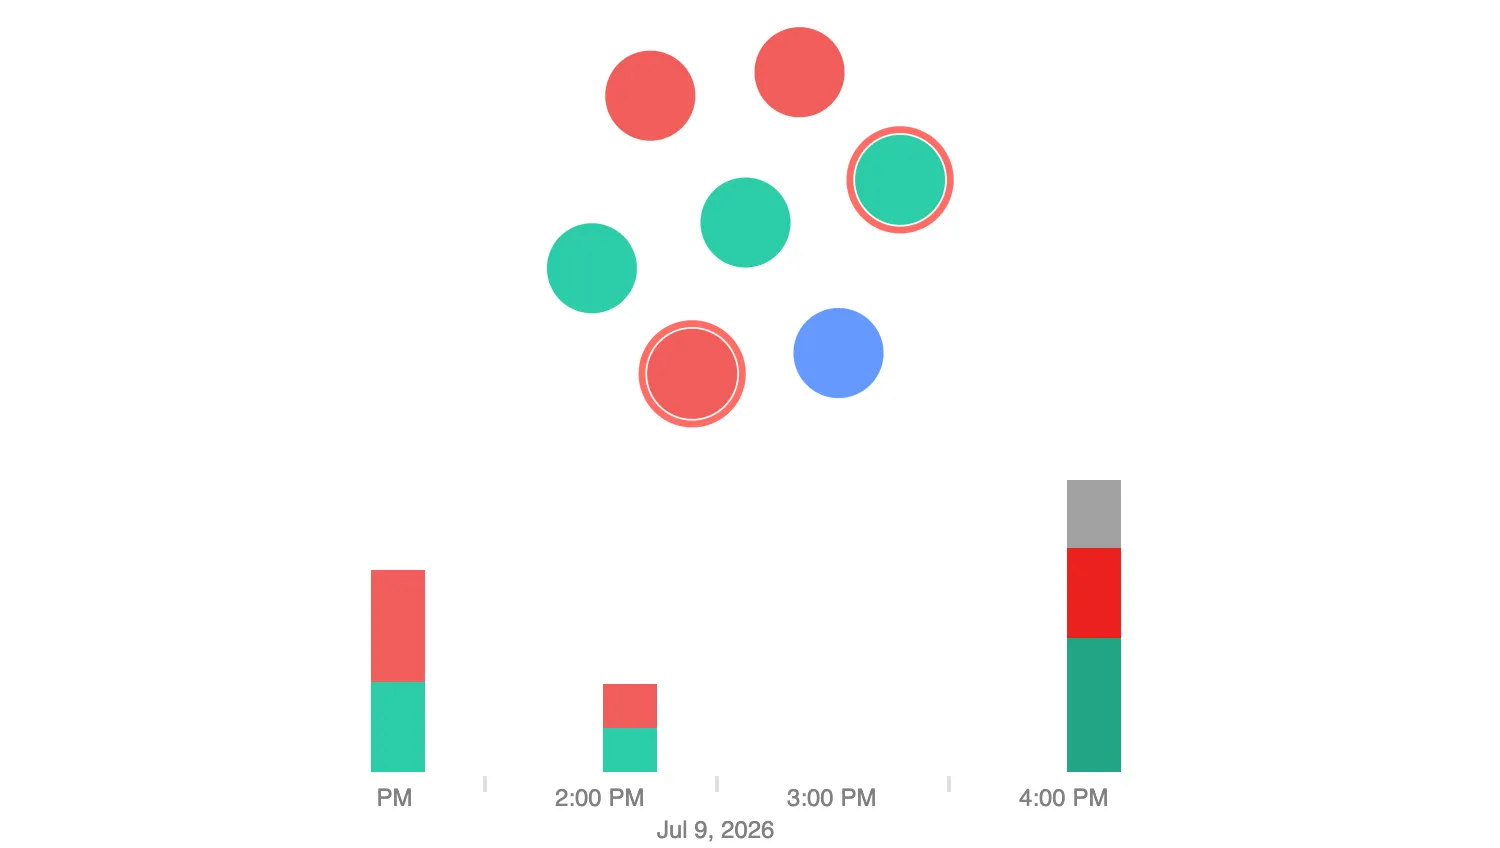
Click on a node to separate its category into a stack group, or select multiple colors to see more stack groups.
The order that you select categories controls the stacking order.
See also
import React, { useEffect, useState } from "react";
import { createRoot } from "react-dom/client";

import forEach from "lodash/forEach";
import isUndefined from "lodash/isUndefined";
import { Chart, TimeBar } from "regraph";

import { style } from "@ci/theme/rg/js/storyStyles";

export const Demo = () => <ChartAndStackedBars items={styledItems()} />;

const COLORS = {
  x: style.primary1.color,
  y: style.secondary1.color,
  z: style.tertiary1.color,
};

const ChartAndStackedBars = (props) => {
  const { items } = props;
  const [selectedItems, setSelectedItems] = useState(null);
  const [styles, setStyles] = useState(null);

  useEffect(() => {
    if (!isUndefined(selectedItems)) {
      const stackStyles = {};
      forEach(selectedItems, (item) => {
        const stackIdentifier = item.data.id;
        if (!stackStyles[stackIdentifier]) {
          stackStyles[stackIdentifier] = { color: COLORS[stackIdentifier] };
        }
      });
      setStyles(stackStyles);
    }
  }, [selectedItems]);

  return (
    <div style={{ height: "100%", backgroundColor: "white" }}>
      <Chart
        items={items}
        onChange={({ selection }) => {
          setSelectedItems(selection);
        }}
        options={{ handMode: false, navigation: false, overview: false }}
        style={{ height: "calc(100% - 200px)" }}
      />
      <TimeBar
        items={items}
        options={{
          style: { hoverColor: "#A2A2A2" },
          sliders: { type: "none" },
          stack: { by: "id", styles },
        }}
        style={{
          margin: "0 auto",
          height: "200px",
          width: "50%",
        }}
      />
    </div>
  );
};

function styledItems() {
  const items = data();
  forEach(items, (item) => {
    item.color = COLORS[item.data.id];
  });
  return items;
}

function data() {
  return {
    id1: { times: [{ time: Date.now(), value: 2 }], data: { id: "x" } },
    id2: { times: [{ time: Date.now() + 1000 * 60 * 60 }], data: { id: "x" } },
    id3: {
      times: [{ time: Date.now() + 1000 * 60 * 60 * 3, value: 3 }],
      data: { id: "x" },
    },
    id4: { times: [{ time: Date.now(), value: 2.5 }], data: { id: "y" } },
    id5: { times: [{ time: Date.now() + 1000 * 60 * 60 }], data: { id: "y" } },
    id6: {
      times: [{ time: Date.now() + 1000 * 60 * 60 * 3, value: 2 }],
      data: { id: "y" },
    },
    id7: {
      times: [{ time: Date.now() + 1000 * 60 * 60 * 3, value: 1.5 }],
      data: { id: "z" },
    },
  };
}

const root = createRoot(document.getElementById("regraph"));
root.render(<Demo />);<!doctype html>
<html>
<body>
<div id="regraph" style="height: 100vh"></div>
<script type="module" src="./code.jsx"></script>
</body>
</html>