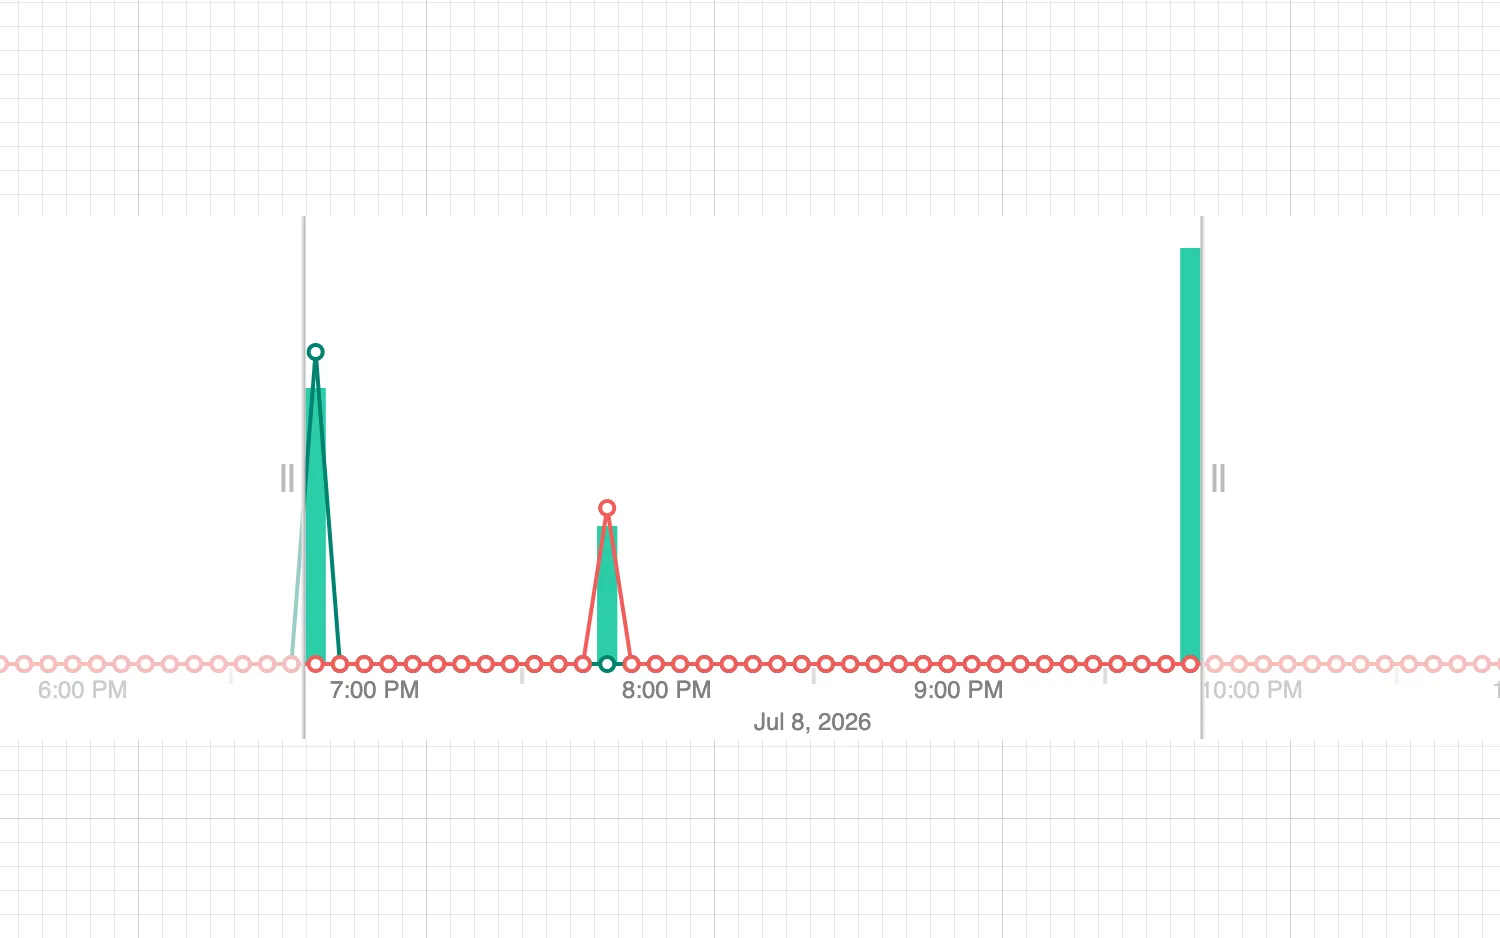
Hover over selection lines to log data to the console.
Selection lines are scaled relative to each other but independent of histogram bars.
You can have up to three selection lines on a time bar.
See also
import React from "react";
import { createRoot } from "react-dom/client";

import { TimeBar } from "regraph";

import { style } from "@ci/theme/rg/js/storyStyles";

export const Demo = () => (
  <div className="timebar-wrapper">
    <TimeBar
      items={data()}
      selection={[{ id1: true }, { id2: true }]}
      selectionColor={[style.primary2.color, style.secondary1.color]}
      onHover={({ type, value, x, y, start, end }) => {
        if (type === "selection") {
          // index is not used. value is the point value of all items in the selection
          // (the height of the selection)
          console.log(value, x, y, start, end);
        }
      }}
      options={{
        style: { ...style.primary1, hoverColor: style.primary0.color },
      }}
    />
  </div>
);

function data() {
  return {
    id1: { times: [{ time: Date.now(), value: 2 }] },
    id2: { times: [{ time: Date.now() + 1000 * 60 * 60 }] },
    id3: { times: [{ time: Date.now() + 1000 * 60 * 60 * 3, value: 3 }] },
  };
}

const root = createRoot(document.getElementById("regraph"));
root.render(<Demo />);<!doctype html>
<html>
<body>
<div id="regraph" style="height: 100vh"></div>
<script type="module" src="./code.jsx"></script>
</body>
</html>