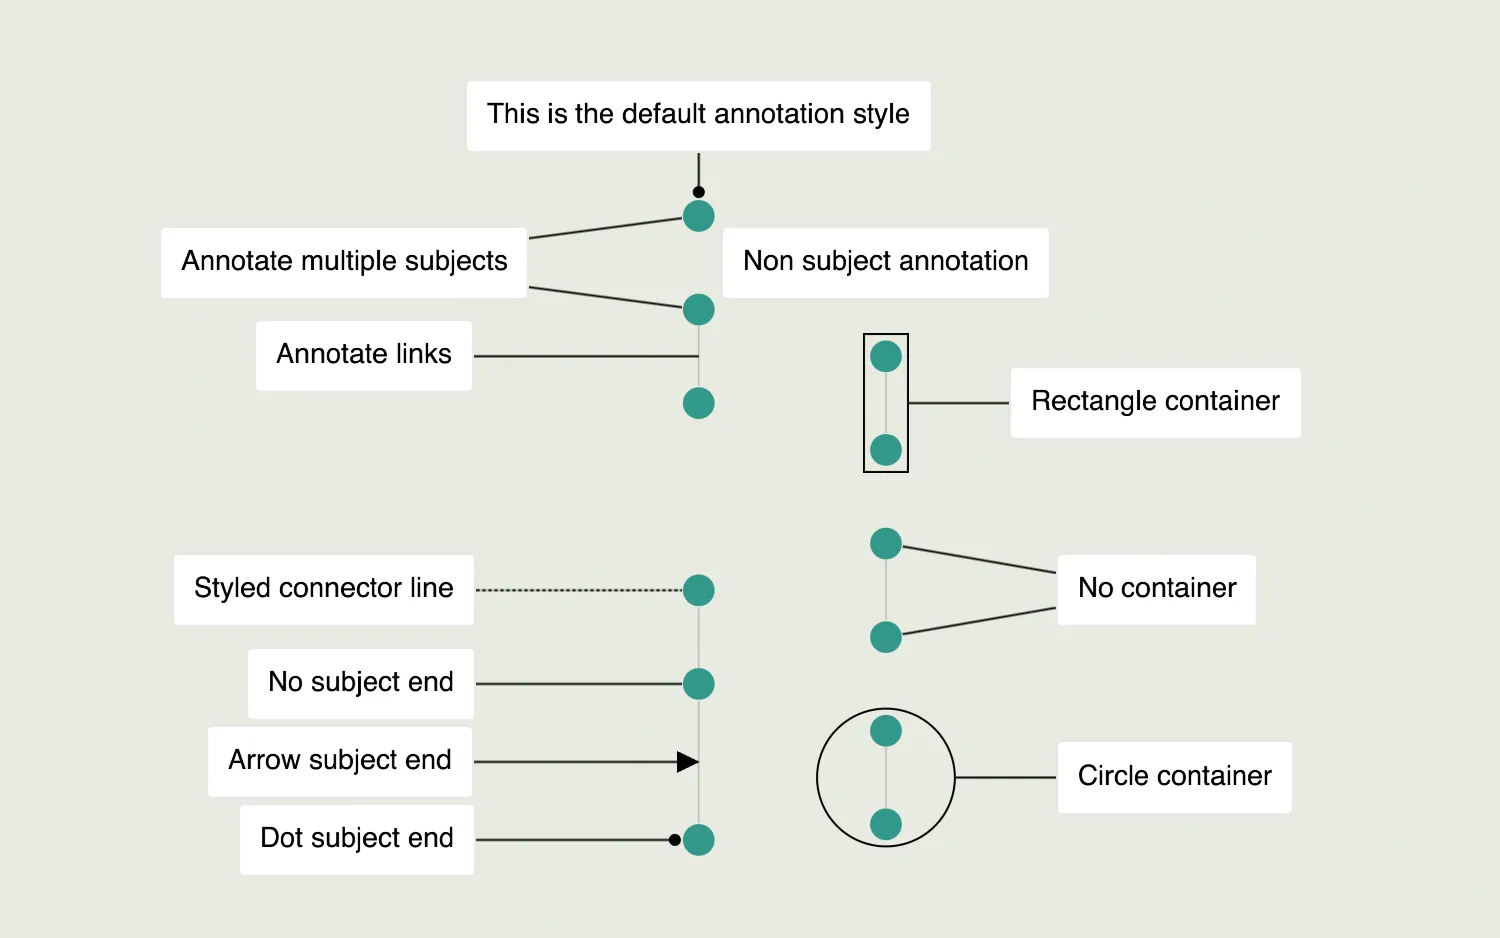
Click on an annotation to see its data in the overlay, and pan and zoom the chart and drag the nodes to see how annotations respond to changes.
Annotations do not scale during zooming and stay visible at each zoom level.
Annotations can be positioned using world coordinates and stay fixed in place even during chart changes or view changes, or they can be positioned relative to their subjects and move to keep the relative position whenever their subjects move.
Annotations have two main parts - a body with information, styling and user controls, and a connector that links the annotation to its subjects. The connector further divides into a line, a subject end and a container, all of which can be styled or hidden in the connectorStyle property.
See also
import React, { useState } from "react";
import { createRoot } from "react-dom/client";

import { Chart } from "regraph";

import { data, dataPositions } from "./data";

import "@ci/theme/rg/css/properties.css";

export const Demo = () => (
  <AnnotationsBasics items={data} itemPositions={dataPositions} />
);

function AnnotationsBasics(props) {
  const { items, itemPositions } = props;
  const [clickedAnnotationId, setClickedAnnotationId] = useState(null);
  const [updatedPositions, setUpdatedPositions] = useState(itemPositions);

  const handleClick = ({ id, itemType }) => {
    if (id && itemType === "annotation") {
      setClickedAnnotationId(id);
    } else if (clickedAnnotationId) {
      setClickedAnnotationId(null);
    }
  };

  const handleChange = async ({ annotationPositions }) => {
    if (annotationPositions) {
      // Track annotation position changes so we can display them to the user
      setUpdatedPositions((current) => ({
        ...current,
        annotations: annotationPositions,
      }));
    }
  };

  return (
    <div style={{ width: "100%", height: "100%" }}>
      <Chart
        items={items}
        positions={itemPositions.nodes}
        annotationPositions={updatedPositions.annotations}
        onClick={handleClick}
        onChange={handleChange}
        options={{
          navigation: false,
          overview: false,
          backgroundColor: "rgb(231, 234, 224)",
          selection: false,
          minZoom: 0.3,
        }}
      />
      {clickedAnnotationId === null ? (
        <pre className="properties annotations empty">
          Click an annotation to see its properties
        </pre>
      ) : (
        <pre className="properties annotations">
          {JSON.stringify(
            {
              items: {
                [clickedAnnotationId]: {
                  ...items[clickedAnnotationId],
                },
              },
              annotationPositions:
                updatedPositions.annotations[clickedAnnotationId],
            },
            null,
            2,
          )}
        </pre>
      )}
    </div>
  );
}

const root = createRoot(document.getElementById("regraph"));
root.render(<Demo />);const annotationDistance = 100;
const columnXMidPoints = {
1: 0,
2: 300,
};
export const dataPositions = {
// Node positions are populated via the makeNode function
nodes: {},
annotations: {
a2: {
angle: "0",
distance: 20,
},
a2: {
angle: "w",
distance: annotationDistance - 50,
},
a3: {
angle: "w",
distance: annotationDistance,
},
a4: {
angle: "w",
distance: annotationDistance,
},
a5: {
angle: "w",
distance: annotationDistance,
},
a6: {
angle: "w",
distance: annotationDistance,
},
a7: {
angle: "w",
distance: annotationDistance,
},
a8: {
x: columnXMidPoints[2],
y: 125,
},
a9: {
angle: "e",
distance: annotationDistance - 50,
},
a10: {
angle: "e",
distance: annotationDistance - 50,
},
a11: {
angle: "e",
distance: annotationDistance - 50,
},
},
};
export const data = {
...makeNode("n1", columnXMidPoints[1], 50),
...makeNode("n2", columnXMidPoints[1], 200),
...makeNode("n3", columnXMidPoints[1], 350),
...makeLink("n2", "n3"),
...makeNode("n4", columnXMidPoints[1], 650),
...makeNode("n5", columnXMidPoints[1], 800),
...makeLink("n4", "n5"),
...makeNode("n6", columnXMidPoints[1], 1050),
...makeLink("n5", "n6"),
...makeNode("n7", columnXMidPoints[2], 275),
...makeNode("n8", columnXMidPoints[2], 425),
...makeLink("n7", "n8"),
...makeNode("n9", columnXMidPoints[2], 575),
...makeNode("n10", columnXMidPoints[2], 725),
...makeLink("n9", "n10"),
...makeNode("n11", columnXMidPoints[2], 875),
...makeNode("n12", columnXMidPoints[2], 1025),
...makeLink("n11", "n12"),
a1: {
subject: "n1",
label: {
text: "This is the default annotation style",
},
},
a2: {
subject: ["n1", "n2"],
connectorStyle: {
subjectEnd: "none",
},
label: {
text: "Annotate multiple subjects",
},
},
a3: {
subject: ["n2-n3"],
connectorStyle: {
subjectEnd: "none",
},
label: {
text: "Annotate links",
},
},
a4: {
subject: ["n4"],
connectorStyle: {
lineStyle: "dashed",
subjectEnd: "none",
},
label: {
text: "Styled connector line",
},
},
a5: {
subject: ["n5"],
connectorStyle: {
subjectEnd: "none",
},
label: {
text: "No subject end",
},
},
a6: {
subject: ["n5-n6"],
connectorStyle: {
subjectEnd: "arrow",
},
label: {
text: "Arrow subject end",
},
},
a7: {
subject: ["n6"],
connectorStyle: {
subjectEnd: "dot",
},
label: {
text: "Dot subject end",
},
},
a8: {
subject: [],
label: {
text: "Non subject annotation",
},
},
a9: {
subject: ["n7", "n8"],
connectorStyle: {
container: "rectangle",
subjectEnd: "none",
},
label: {
text: "Rectangle container",
},
},
a10: {
subject: ["n9", "n10"],
connectorStyle: {
container: "none",
subjectEnd: "none",
},
label: {
text: "No container",
},
},
a11: {
subject: ["n11", "n12"],
connectorStyle: {
container: "circle",
subjectEnd: "none",
},
label: {
text: "Circle container",
},
},
};
function makeNode(id, x, y) {
dataPositions.nodes[id] = {
x,
y,
};
return {
[id]: {
color: "rgb(50, 152, 138)",
},
};
}
function makeLink(id1, id2) {
return {
[`${id1}-${id2}`]: {
type: "link",
id1: id1,
id2: id2,
color: "rgb(166, 166, 166)",
},
};
}<!doctype html>
<html>
<body>
<div id="regraph" style="height: 100vh"></div>
<script type="module" src="./code.jsx"></script>
</body>
</html>