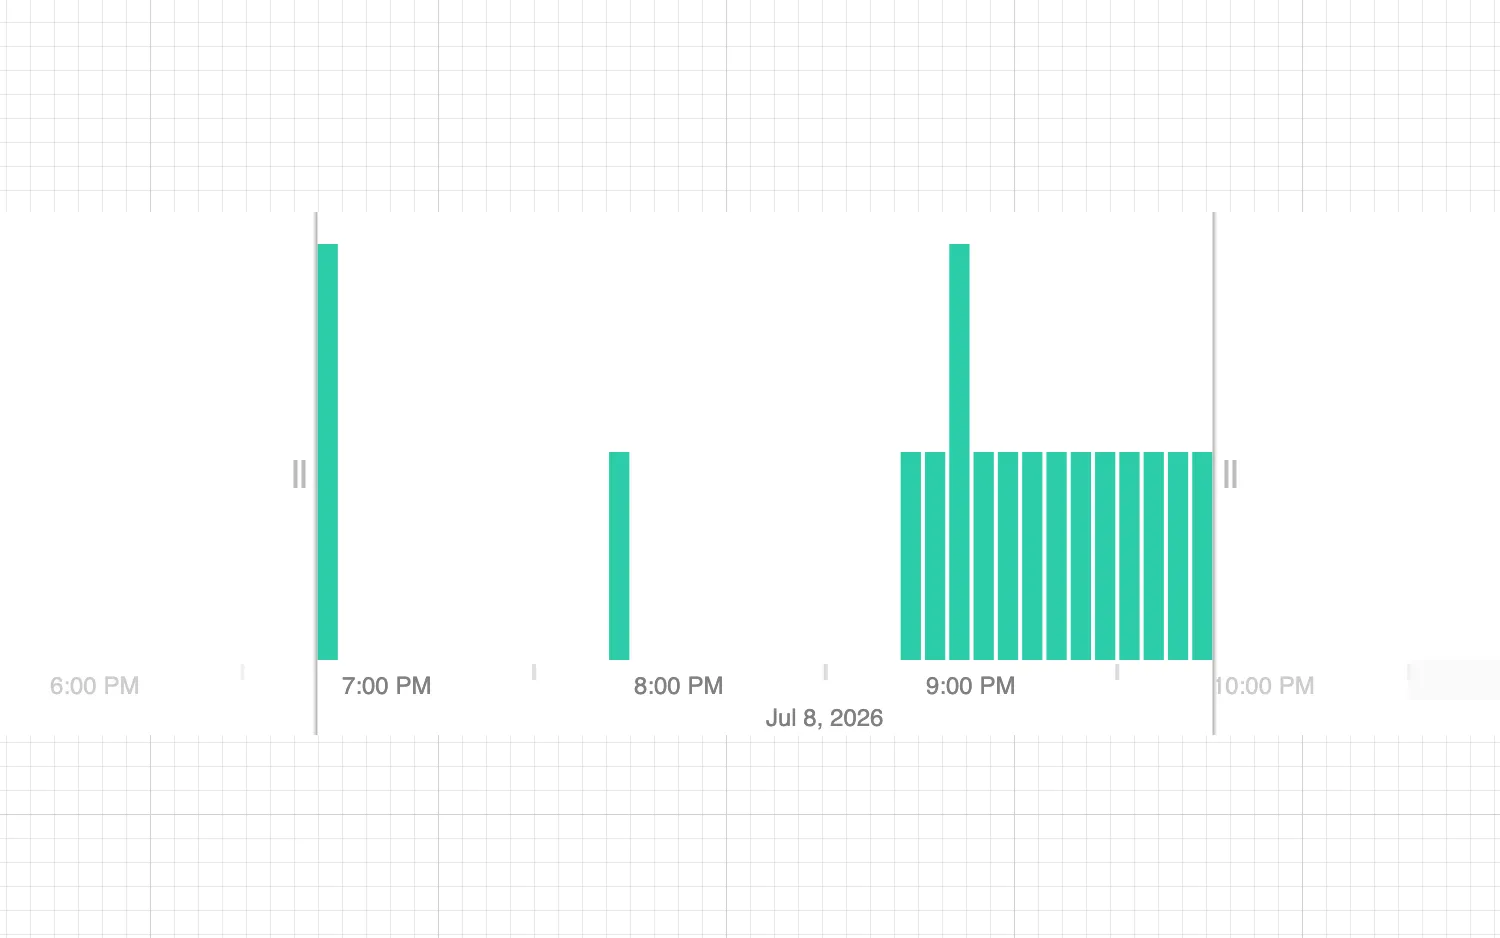
The time bar accepts data in the same JSON object format as the chart. Each key is the id of an item, and must contain a times property.
See the Code tab to see how this time bar was created.
See also
import React from "react";
import { createRoot } from "react-dom/client";

import { TimeBar } from "regraph";

import { style } from "@ci/theme/rg/js/storyStyles";

import "@ci/theme/rg/css/layout.css";

export const Demo = () => (
  <div className="timebar-wrapper">
    <TimeBar
      items={{
        id1: {
          times: [
            { time: Date.now(), value: 2 },
            { time: Date.now() + 1000 * 60 * 60 },
            { time: Date.now() + 2200 * 60 * 60 },
          ],
        },
        id2: {
          times: [
            {
              time: {
                start: Date.now() + 2000 * 60 * 60,
                end: Date.now() + 3000 * 60 * 60,
              },
            },
          ],
        },
      }}
      options={{
        style: { ...style.primary1, hoverColor: style.primary0.color },
      }}
    />
  </div>
);

const root = createRoot(document.getElementById("regraph"));
root.render(<Demo />);<!doctype html>
<html>
<body>
<div id="regraph" style="height: 100vh"></div>
<script type="module" src="./code.jsx"></script>
</body>
</html>