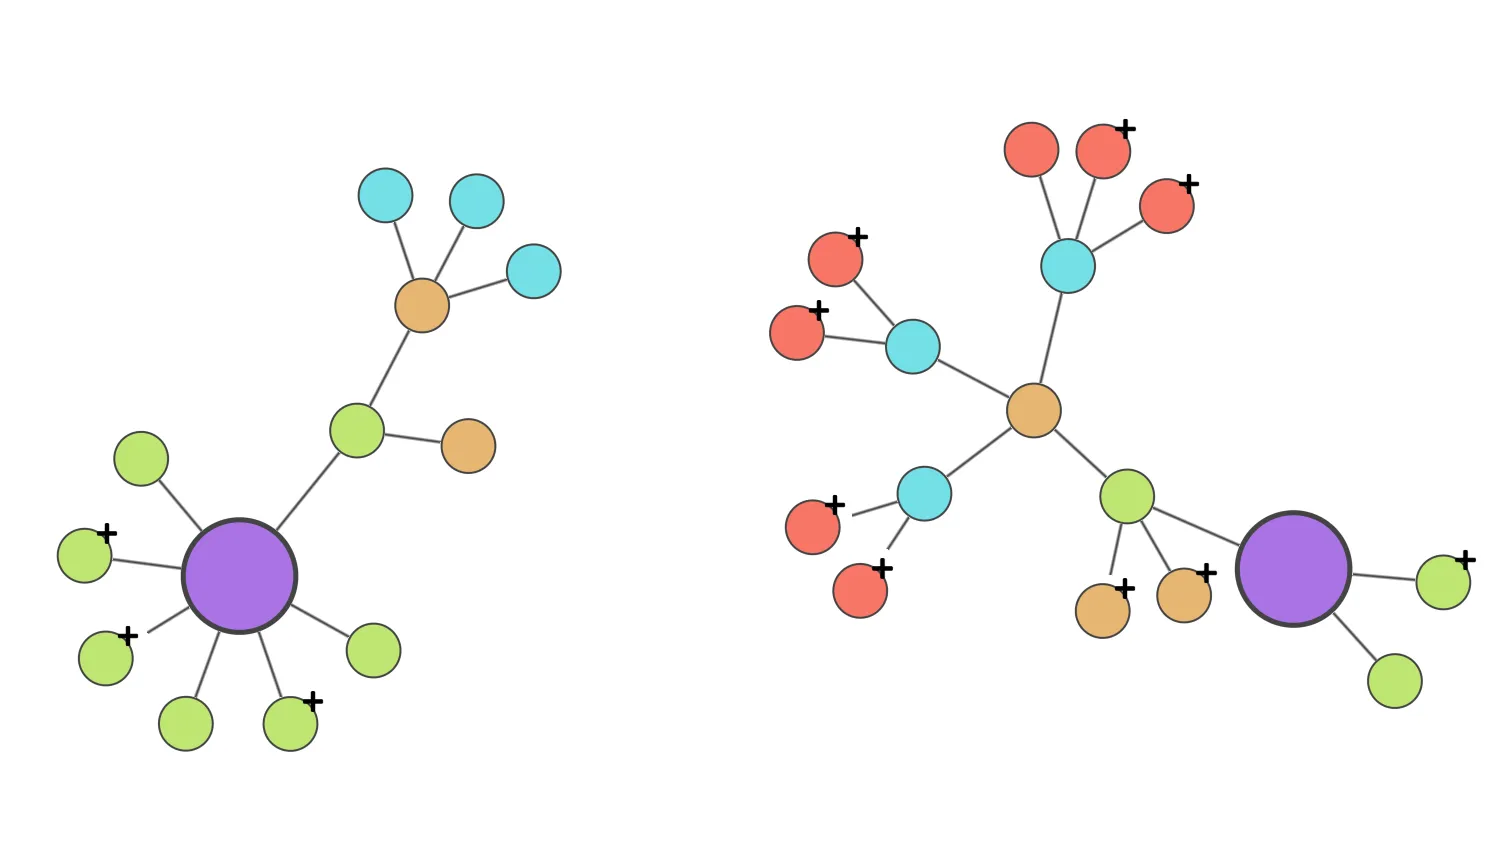
Layouts can help you quickly make sense of networks but dynamically changing graphs can sometimes be challenging to follow.
This demo shows how the expand function can be used to add new data to the chart, animating the positions of nodes in an intuitive way to help users keep track of incremental changes.
Try double-clicking anywhere on the background to add a new component or click on any node with ** to expand its connections. The new items will appear in the best available position in the existing chart.
The controls let you choose a layout and set a behaviour for expanding new data, which is determined by the fix option. The adaptive option gives optimum results - but you can also experiment with running a full layout (fix is set to 'none') or by fixing all existing nodes (fix is set to 'all').
Key functions used:
import KeyLines from "keylines";
import { data } from "./data.js";

let chart;

function getRootNodes() {
  const rootNodes = [];
  chart.each({ type: "node" }, (node) => {
    if (node.d.level === 0) {
      rootNodes.push(node.id);
    }
  });
  return rootNodes;
}

async function runExpand(itemsToExpand) {
  const layoutName = document.querySelector(
    ".btn-group button.btn.active",
  ).value;
  const fixOption = document.querySelector('input[name="fix"]:checked').value;
  const options = {
    name: layoutName,
    fit: true,
    fix: fixOption,
    consistent: fixOption !== "none",
  };
  if (layoutName === "radial" || layoutName === "sequential") {
    options.level = "level";
    options.top = getRootNodes();
  }
  chart.lock(true);
  await chart.expand(itemsToExpand, { layout: options });
  chart.lock(false);
}

async function runLayout() {
  const layoutName = document.querySelector(
    ".btn-group button.btn.active",
  ).value;
  const options = { packing: "adaptive" };
  if (layoutName === "radial" || layoutName === "sequential") {
    options.level = "level";
    options.top = getRootNodes();
  }
  if (layoutName === "sequential") {
    options.packing = "aligned";
  }
  await chart.layout(layoutName, options);
}

function setUIAvailability(enabled) {
  document.getElementById("reset").disabled = !enabled;

  const buttons = ["organic", "sequential", "radial"];
  buttons.forEach((button) => {
    document.getElementById(button).disabled = !enabled;
  });

  const inputs = ['input[name="fix"]'];
  inputs.forEach((input) => {
    document.querySelectorAll(input).forEach((radio) => {
      radio.disabled = !enabled;
    });
  });
}

function setFixOptionAvailability(layoutName) {
  const fixInputs = document.querySelectorAll('input[name="fix"]');
  fixInputs.forEach((radio) => {
    if (layoutName === "radial") {
      radio.disabled = true;
    } else if (layoutName === "sequential") {
      radio.disabled = radio.value === "all";
    } else {
      radio.disabled = false;
    }
  });
}

// If double-click is on the background, then create a new component
// otherwise expand node connections
async function doubleClickHandler({ id, preventDefault }) {
  preventDefault();
  setUIAvailability(false);
  if (id) {
    const item = chart.getItem(id);
    if (item && item.type === "node") {
      // remove glyph from selected node
      chart.setProperties({ id: item.id, g: [] });
      await runExpand(data.expandTree(item));
    }
  } else {
    await runExpand(data.createTree());
  }
  setUIAvailability(true);
  setFixOptionAvailability(
    document.querySelector(".btn-group button.btn.active").value,
  );
}

async function resetChart() {
  const items = data.reset();
  chart.load(items);
  await runLayout();
}

function addInteractions() {
  chart.on("double-click", doubleClickHandler);
  document.getElementById("reset").addEventListener("click", resetChart);
  const layoutButtons = ["organic", "sequential", "radial"];
  layoutButtons.forEach((button) => {
    const buttonElement = document.getElementById(button);
    buttonElement.addEventListener("click", handleLayoutButtonClick);
  });
}

async function handleLayoutButtonClick(event) {
  updateButton(event.target.id);
  setFixOptionAvailability(event.target.value);
  await runLayout();
}

function updateButton(clickedButtonId) {
  const layoutButtons = ["organic", "sequential", "radial"];
  layoutButtons.forEach((buttonId) => {
    const buttonElement = document.getElementById(buttonId);
    if (buttonId === clickedButtonId) {
      buttonElement.classList.add("active");
    } else {
      buttonElement.classList.remove("active");
    }
  });
}

async function loadKeyLines() {
  const options = {
    logo: "/public/images/Logo.png",
    handMode: true,
    iconFontFamily: "Font Awesome 5 Free",
    selectedNode: {
      ha0: {
        c: "rgb(114, 179, 0)",
        w: 10,
        r: 30,
      },
    },
  };
  chart = await KeyLines.create({
    container: "klchart",
    options,
  });
  resetChart();
  addInteractions();
}

function loadFonts() {
  document.fonts.load('24px "Font Awesome 5 Free"').then(loadKeyLines);
}

window.addEventListener("DOMContentLoaded", loadFonts);import KeyLines from "keylines";
const colours = [
"rgb(216, 101, 247)",
"rgb(192, 230, 115)",
"rgb(230, 181, 115)",
"rgb(115, 222, 230)",
"rgb(248, 118, 102)",
"rgb(115, 157, 230)",
];
const glyph = {
p: "ne",
fi: {
t: "fas fa-plus",
},
e: 2,
};
function* idGenerator(prefix) {
let i = 0;
while (1) {
yield `${prefix}${i}`;
i++;
}
}
function randomInt(min = 3, max = 8) {
return Math.floor(Math.random() * (max - min)) + min;
}
function createRootNode(id) {
const node = {
id,
type: "node",
b: "rgb(68, 68, 68)",
fbc: "rgba(0,0,0,0)",
c: "rgb(171, 115, 230)",
bw: 2.5,
e: 2,
d: { level: 0 },
};
return node;
}
function createLeafNode(id, level) {
const node = {
id,
type: "node",
b: "rgb(68, 68, 68)",
fbc: "rgba(0,0,0,0)",
c: colours[level % colours.length],
bw: 1.5,
d: { level },
};
// Make only 2/3rds of all nodes expandable;
if (Math.random() <= 2 / 3) node.g = [glyph];
return node;
}
function createLink(source, target) {
const link = {
type: "link",
id: `${source} - ${target}`,
id1: `${source}`,
id2: `${target}`,
c: "rgb(68, 68, 68)",
w: 2.5,
};
return link;
}
export const data = (() => {
let expandableIds, rootIdGen, leafIdGen;
function removeIdFromExpandableIds(id) {
const index = expandableIds.indexOf(id);
if (index > -1) expandableIds.splice(index, 1);
}
function addLeaves(leafNode, numberOfLeaves) {
const leaves = [];
if (expandableIds.includes(leafNode.id)) {
removeIdFromExpandableIds(leafNode.id);
let i = 0;
while (i < numberOfLeaves) {
const id = leafIdGen.next().value;
const level = leafNode.d.level + 1;
const node = createLeafNode(id, level);
if (node.g && node.g.length > 0) {
expandableIds.push(node.id);
}
const link = createLink(leafNode.id, id);
leaves.push(node, link);
i++;
}
}
return leaves;
}
function createTree(min, max) {
const rootId = rootIdGen.next().value;
const rootNode = createRootNode(rootId);
expandableIds.push(rootNode.id);
return [rootNode, ...addLeaves(rootNode, randomInt(min, max))];
}
function expandTree(leafNode) {
return addLeaves(leafNode, randomInt(2, 4));
}
function reset() {
expandableIds = [];
rootIdGen = idGenerator("root");
leafIdGen = idGenerator("leaf");
return {
type: "LinkChart",
items: [...createTree(6, 8), ...createTree(3, 4)],
};
}
return { createTree, expandTree, reset };
})();<!doctype html>
<html lang="en" style="background-color: #2d383f">
<head>
<meta charset="utf-8" />
<title>Adaptive Layouts</title>
<link rel="stylesheet" type="text/css" href="@ci/theme/kl/css/keylines.css" />
<link rel="stylesheet" type="text/css" href="@ci/theme/kl/css/minimalsdk.css" />
<link rel="stylesheet" type="text/css" href="@ci/theme/kl/css/sdk-layout.css" />
<link rel="stylesheet" type="text/css" href="@ci/theme/kl/css/demo.css" />
<link
rel="stylesheet"
type="text/css"
href="@fortawesome/[email protected]/css/fontawesome.css"
/>
<link
rel="stylesheet"
type="text/css"
href="@fortawesome/[email protected]/css/solid.css"
/>
</head>
<body>
<div id="klchart" class="klchart"></div>
<script type="module" src="./code.js"></script>
</body>
</html>