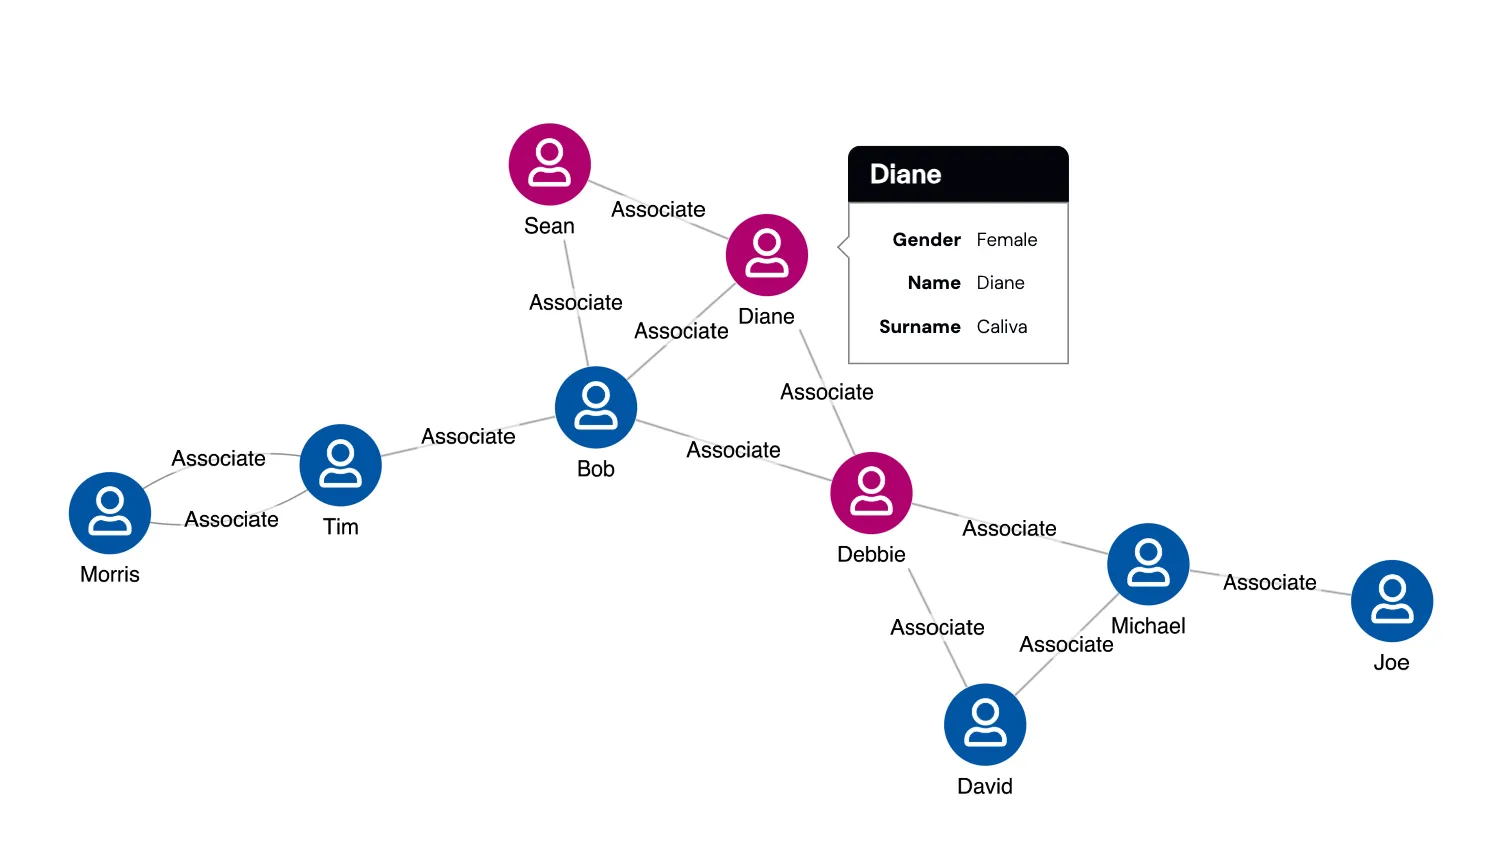
Tooltips are a simple mechanism to give the user more information about chart items. There are two basic ways of populating tooltips: pre-loading and dynamic loading.
Preloading loads the data onto the d property for all nodes up front, which is why it's mostly convenient only for relatively small datasets. Preloading is used in this demo.
Dynamic loading brings the data in dynamically when each node is hovered, which makes it suitable even for very large datasets.
Object format used:
Key function used:
import KeyLines from "keylines";
import { data } from "./data.js";

// declaring global vars
let chart;

const nodeBaseSize = 26;
const tooltipContainer = document.querySelector("#tooltip-container");
const tooltip = {
  itemId: null,
  element: null,
};

// Create the HTML code that is going to fill the tooltip
const templateHtml = document.getElementById("tt_html").innerHTML;

function updateTooltipPosition() {
  if (tooltip.itemId) {
    const { itemId, element } = tooltip;
    const item = chart.getItem(itemId);
    const coordinates = chart.viewCoordinates(item.x, item.y);
    const x = coordinates.x;
    const y = coordinates.y;
    const zoom = chart.viewOptions().zoom;
    const arrowTipOffset = 20;
    // get the size of the node on screen
    const nodeSize = nodeBaseSize * (item.e || 1) * zoom;
    element.style.opacity = 0;
    // allow fade in and out to animate
    element.style.transition = "opacity 0.3s ease";
    // scale the size of the tooltip depending on zoom level
    element.style.transform = `scale(${Math.max(0.75, Math.min(2, zoom))}`;
    const top = y - element.clientHeight / 2;
    element.style.left = `${x + arrowTipOffset + nodeSize}px`;
    element.style.top = `${top}px`;
    element.style.opacity = 1;
  }
}

function closeTooltip() {
  if (tooltip.element) {
    tooltip.element.style.opacity = 0;
    tooltip.itemId = null;
    tooltip.element = null;
  }
}

function handleTooltip({ id }) {
  const item = chart.getItem(id);
  if (item && item.type === "node") {
    const html = templateHtml
      .replace(/{{label}}/, item.t)
      .replace(/{{gender}}/, item.d.g)
      .replace(/{{name}}/, item.d.fn)
      .replace(/{{surname}}/, item.d.ln);

    // Add it to the DOM
    tooltipContainer.innerHTML = html;
    tooltip.element = document.getElementById("tooltip");
    tooltip.itemId = id;
    updateTooltipPosition();
  } else if (tooltip.element) {
    closeTooltip();
  }
}

function chartLoaded() {
  let { width, height } = chart.viewOptions();
  chart.on("view-change", () => {
    const { width: newWidth, height: newHeight } = chart.viewOptions();
    if (width !== newWidth || height !== newHeight) {
      closeTooltip();
      width = newWidth;
      height = newHeight;
    }
    updateTooltipPosition();
  });
  chart.on("drag-move", updateTooltipPosition);
  chart.on("hover", handleTooltip);

  chart.load(data);
  chart.layout();
}

async function startKeyLines() {
  const options = {
    drag: {
      links: false,
    },
    logo: { u: "/public/images/Logo.png" },
    hover: 100,
    iconFontFamily: "Font Awesome 5 Free",
    imageAlignment: { ["far fa-user"]: { dy: -5, e: 0.9 } },
  };

  chart = await KeyLines.create({
    container: "klchart",
    options,
  });
  chartLoaded();
}

function loadKeyLines() {
  document.fonts.load('24px "Font Awesome 5 Free"').then(startKeyLines);
}

window.addEventListener("DOMContentLoaded", loadKeyLines);import KeyLines from "keylines";
export const data = {
type: "LinkChart",
items: [
{
id: "ab",
id1: "a",
id2: "b",
type: "link",
t: "Associate",
off: 0,
},
{
id: "ac",
id1: "a",
id2: "c",
type: "link",
t: "Associate",
off: 0,
},
{
id: "ad",
id1: "a",
id2: "d",
type: "link",
t: "Associate",
off: 0,
},
{
id: "ae",
id1: "a",
id2: "e",
type: "link",
t: "Associate",
off: 0,
},
{
id: "bc",
id1: "b",
id2: "c",
type: "link",
t: "Associate",
off: 0,
},
{
id: "bd",
id1: "b",
id2: "d",
type: "link",
t: "Associate",
off: 0,
},
{
id: "cj",
id1: "c",
id2: "j",
type: "link",
t: "Associate",
off: 0,
},
{
id: "ci",
id1: "c",
id2: "i",
type: "link",
t: "Associate",
off: 0,
},
{
id: "eg",
id1: "e",
id2: "g",
type: "link",
t: "Associate",
off: 20,
},
{
id: "hi",
id1: "h",
id2: "i",
type: "link",
t: "Associate",
off: 0,
},
{
id: "ge",
id1: "g",
id2: "e",
type: "link",
t: "Associate",
off: 20,
},
{
id: "ij",
id1: "i",
id2: "j",
type: "link",
t: "Associate",
off: 0,
},
{
id: "a",
type: "node",
t: "Bob",
c: "#0155A5",
fi: {
t: "far fa-user",
c: "white",
},
d: {
fn: "Robert",
ln: "Smith",
g: "Male",
},
},
{
id: "b",
type: "node",
t: "Diane",
c: "#B0006E",
fi: {
t: "far fa-user",
c: "white",
},
d: {
fn: "Diane",
ln: "Caliva",
g: "Female",
},
},
{
id: "c",
type: "node",
t: "Debbie",
c: "#B0006E",
fi: {
t: "far fa-user",
c: "white",
},
d: {
fn: "Debbie",
ln: "Denise",
g: "Female",
},
},
{
id: "d",
type: "node",
t: "Sean",
c: "#B0006E",
fi: {
t: "far fa-user",
c: "white",
},
d: {
fn: "Sean",
ln: "Young",
g: "Female",
},
},
{
id: "e",
type: "node",
t: "Tim",
c: "#0155A5",
fi: {
t: "far fa-user",
c: "white",
},
d: {
fn: "Tim",
ln: "Angulo",
g: "Male",
},
},
{
id: "f",
type: "node",
t: "Bud",
c: "#0155A5",
fi: {
t: "far fa-user",
c: "white",
},
d: {
fn: "Bud",
ln: "Alper",
g: "Male",
},
},
{
id: "g",
type: "node",
t: "Morris",
c: "#0155A5",
fi: {
t: "far fa-user",
c: "white",
},
d: {
fn: "Morris",
ln: "Chapnick",
g: "Male",
},
},
{
id: "h",
type: "node",
t: "Joe",
c: "#0155A5",
fi: {
t: "far fa-user",
c: "white",
},
d: {
fn: "Joe",
ln: "Turkel",
g: "Male",
},
},
{
id: "j",
type: "node",
t: "David",
c: "#0155A5",
fi: {
t: "far fa-user",
c: "white",
},
d: {
fn: "David",
ln: "Snyder",
g: "Male",
},
},
{
id: "i",
type: "node",
t: "Michael",
c: "#0155A5",
fi: {
t: "far fa-user",
c: "white",
},
d: {
fn: "Michael",
ln: "Deeley",
g: "Male",
},
},
],
combos: {
nodes: [],
links: [],
},
viewSettings: {
width: 768,
height: 565,
zoom: 0.8185140073081608,
offsetX: 729.4129110840438,
offsetY: 527.2356881851401,
},
};<!doctype html>
<html lang="en" style="background-color: #2d383f">
<head>
<meta charset="utf-8" />
<title>Tooltips on Items</title>
<link rel="stylesheet" type="text/css" href="@ci/theme/kl/css/keylines.css" />
<link rel="stylesheet" type="text/css" href="@ci/theme/kl/css/minimalsdk.css" />
<link rel="stylesheet" type="text/css" href="@ci/theme/kl/css/sdk-layout.css" />
<link rel="stylesheet" type="text/css" href="@ci/theme/kl/css/demo.css" />
<link
rel="stylesheet"
type="text/css"
href="@fortawesome/[email protected]/css/fontawesome.css"
/>
<link
rel="stylesheet"
type="text/css"
href="@fortawesome/[email protected]/css/regular.css"
/>
<link rel="stylesheet" href="./style.css" />
</head>
<body>
<div id="klchart" class="klchart">
<div id="tooltip-container"></div>
</div>
<template id="tt_html"
><div
class="popover right"
id="tooltip"
style="
margin: 0px;
transform-origin: left;
position: absolute;
min-width: 70px;
pointer-events: none;
"
>
<div class="arrow"></div>
<h2 class="popover-title"><strong>{{label}}</strong></h2>
<div class="popover-content">
<table class="table-condensed">
<tbody>
<tr>
<td style="text-align: right"><strong>Gender</strong></td>
<td>{{gender}}</td>
</tr>
<tr>
<td style="text-align: right"><strong>Name</strong></td>
<td>{{name}}</td>
</tr>
<tr>
<td style="text-align: right"><strong>Surname</strong></td>
<td>{{surname}}</td>
</tr>
</tbody>
</table>
</div>
</div></template
>
<script type="module" src="./code.js"></script>
</body>
</html>#htmlModal {
-webkit-user-select: text;
-khtml-user-select: text;
-moz-user-select: text;
-ms-user-select: text;
user-select: text;
}
/* Tooltip styling */
.popover {
z-index: 1000;
background: white;
}
:fullscreen .popover {
margin-top: -70px;
}
#tooltip .popover-title {
font-size: 16px;
padding: 8px 14px;
margin: 0px;
line-height: 20px;
top: 0px;
}
#tooltip .popover-content {
font-size: 12px;
border: 1px solid gray;
}
#tooltip .popover-content .td {
border: 1px solid gray;
max-height: 20px;
}
#tooltip .arrow {
background-color: white;
border-bottom: 1px solid gray;
border-left: 1px solid gray;
transform: translate(-5px, 60px) rotateZ(45deg);
width: 10px;
height: 10px;
position: absolute;
}
.popover-content {
padding: 9px 14px;
}
.klchart {
overflow: hidden;
}
#tooltip {
background: white;
border: black;
transition: opacity 0.3s ease;
}