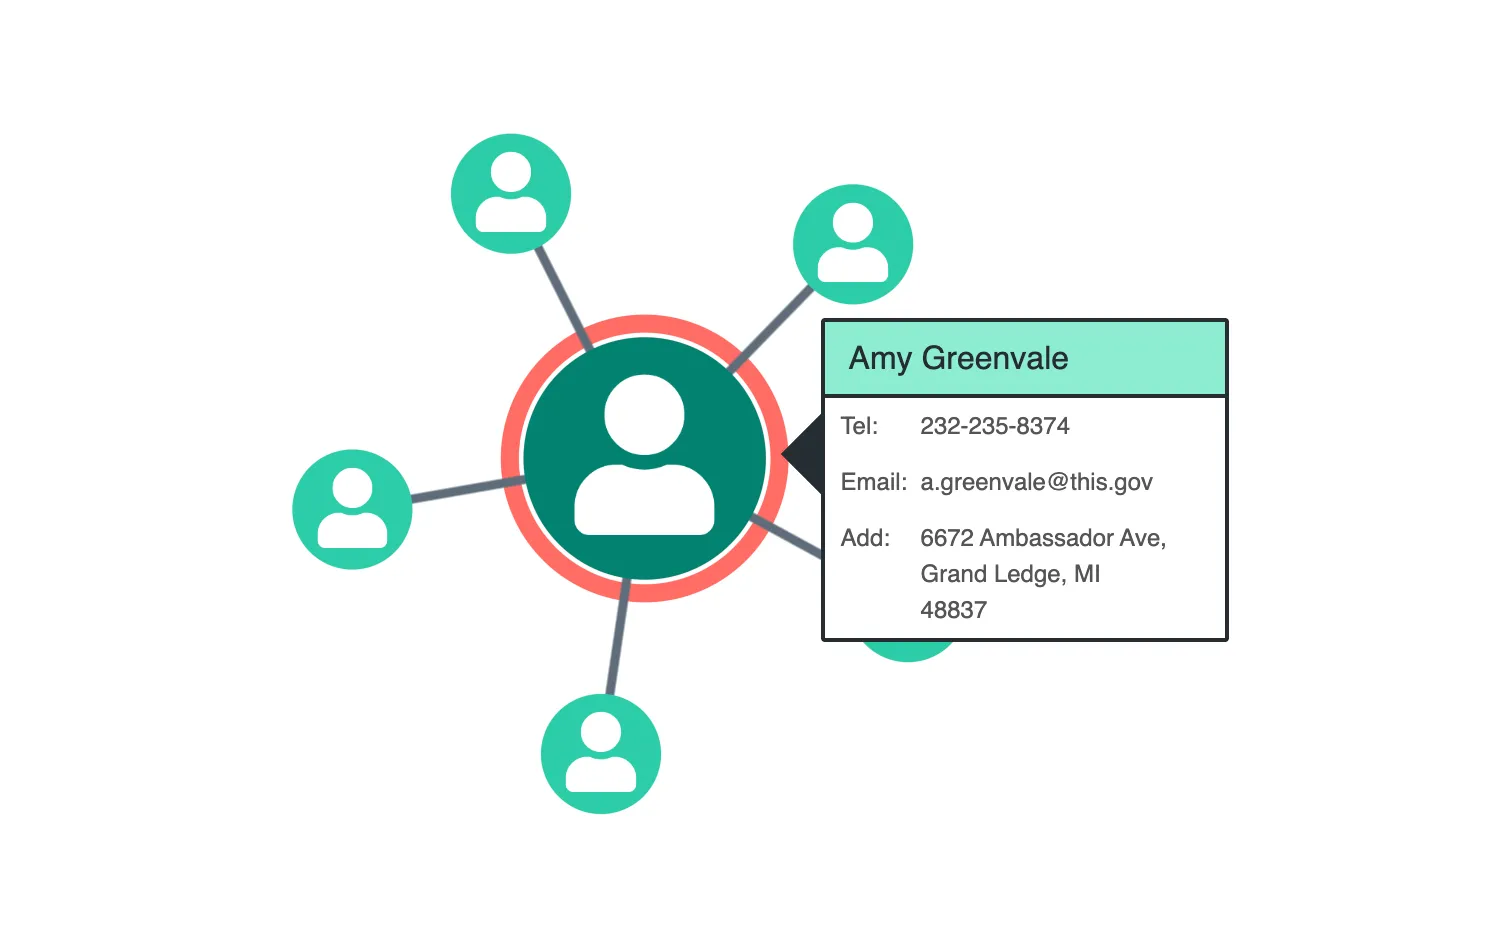
Click on a node to reveal a note, and then zoom or pan the chart or move the node to see how the note adjusts to state changes.
You can create your own HTML overlay to add elements made from scratch to your chart and use ReGraph events to integrate the elements into the chart.
You can see the example's styling in the CSS tab or modify the CSS in the playground.
See also
import React, { useEffect, useRef, useState } from "react";
import { createRoot } from "react-dom/client";

import { Chart } from "regraph";

import { chartOptions, data } from "./data";

import "@fortawesome/fontawesome-free/css/fontawesome.css";
import "@fortawesome/fontawesome-free/css/solid.css";

function firstKey(record) {
  if (record == null) {
    return null;
  }
  const keys = Object.keys(record);
  return keys[0];
}

function isNode(item) {
  return item && item.id1 == null && item.id2 == null;
}

function AnnotationDemo() {
  const items = data;
  const [state, setState] = useState({
    positions: {},
    selection: {},
    zoom: 1,
    offset: { x: 0, y: 0 },
    annotationPosition: null,
    isDragging: false,
  });
  const chartRef = useRef(null);

  // remove the annotation if the window changes size
  useEffect(() => {
    const handleResize = () => {
      setState((current) => {
        if (firstKey(current.selection) == null) {
          return current;
        }

        return {
          ...current,
          selection: {},
        };
      });
    };
    window.addEventListener("resize", handleResize);
    return () => {
      window.removeEventListener("resize", handleResize);
    };
  }, []);

  const onChangeHandler = ({
    positions: newPositions,
    selection: newSelection,
  }) => {
    if (newPositions == null && newSelection == null) {
      return;
    }

    const chart = chartRef.current;
    if (chart == null) {
      return;
    }
    setState((current) => {
      const nextPositions = newPositions || current.positions;
      let nextSelection = current.selection;
      let nextAnnotationPosition = current.annotationPosition;

      if (newSelection) {
        const selectedItemId = firstKey(newSelection);
        if (selectedItemId != null) {
          const selectedItem = items[selectedItemId];
          if (isNode(selectedItem)) {
            nextSelection = { [selectedItemId]: true };
            nextAnnotationPosition = chart.viewCoordinates(
              nextPositions[selectedItemId].x,
              nextPositions[selectedItemId].y,
            );
          }
        } else {
          nextSelection = {};
        }
      } else if (current.annotationPosition == null && nextPositions != null) {
        const firstItemId = firstKey(items);
        nextAnnotationPosition = chart.viewCoordinates(
          nextPositions[firstItemId].x,
          nextPositions[firstItemId].y,
        );
        nextSelection = { [firstItemId]: true };
      }

      return {
        ...current,
        annotationPosition: nextAnnotationPosition,
        selection: nextSelection,
        positions: nextPositions,
      };
    });
  };

  const onDragHandler = ({ type, x, y, draggedItems }) => {
    if (
      type !== "node" ||
      firstKey(draggedItems) !== firstKey(state.selection)
    ) {
      return;
    }
    // if dragging the selected node the position isn't updated until the
    // onChange event, so calculate it from the cursor
    setState((current) => {
      return {
        ...current,
        isDragging: true,
        annotationPosition: {
          x: x - current.offset.x,
          y: y - current.offset.y,
        },
      };
    });
  };

  const onDragEndHandler = ({ defaultPrevented }) => {
    setState((current) => {
      const chart = chartRef.current;
      const selectedItemId = firstKey(current.selection);
      if (
        !defaultPrevented ||
        chart == null ||
        selectedItemId == null ||
        current.positions[selectedItemId] == null
      ) {
        return { ...current, isDragging: false };
      }

      const annotationPosition = chart.viewCoordinates(
        current.positions[selectedItemId].x,
        current.positions[selectedItemId].y,
      );

      return {
        ...current,
        isDragging: false,
        annotationPosition,
      };
    });
  };

  // store the offset to the cursor position to correct during a drag
  const onPointerDownHandler = ({ id, x, y, itemType }) => {
    const chart = chartRef.current;
    if (itemType !== "node" || chart == null) {
      return;
    }
    setState((current) => {
      const position = chart.viewCoordinates(
        current.positions[id].x,
        current.positions[id].y,
      );
      const offset = {
        x: x - position.x,
        y: y - position.y,
      };

      return {
        ...current,
        offset,
      };
    });
  };

  const onViewChangeHandler = ({ zoom }) => {
    const chart = chartRef.current;
    if (chart == null) {
      return;
    }

    const selectedItemId = firstKey(state.selection);
    if (
      state.zoom === zoom &&
      (selectedItemId == null || state.positions[selectedItemId] == null)
    ) {
      return;
    }

    setState((current) => {
      let { annotationPosition } = current;
      if (selectedItemId != null && current.positions[selectedItemId] != null) {
        annotationPosition = chart.viewCoordinates(
          current.positions[selectedItemId].x,
          current.positions[selectedItemId].y,
        );
      }

      return {
        ...current,
        zoom,
        annotationPosition,
      };
    });
  };

  const onWheelHandler = ({ preventDefault }) => {
    if (state.isDragging) {
      preventDefault();
    }
  };

  const selectedItemId = firstKey(state.selection);
  return (
    <div
      className="chart-wrapper"
      style={{
        width: "100%",
        height: "100%",
        position: "relative",
        overflow: "hidden",
      }}
    >
      <Chart
        ref={chartRef}
        items={items}
        selection={state.selection}
        options={chartOptions}
        animation={{ animate: false }}
        onChange={onChangeHandler}
        onDrag={onDragHandler}
        onDragEnd={onDragEndHandler}
        onPointerDown={onPointerDownHandler}
        onViewChange={onViewChangeHandler}
        onWheel={onWheelHandler}
      />
      {selectedItemId != null && state.annotationPosition != null && (
        <Annotation
          position={state.annotationPosition}
          info={items[selectedItemId].data}
          size={items[selectedItemId].size}
          zoom={state.zoom}
        />
      )}
    </div>
  );
}

function Annotation({ position, info, zoom, size = 1 }) {
  const style = {
    top: `${position.y - 70}px`,
    left: `${position.x + (20 + size * zoom * 30)}px`,
  };
  return (
    <div className="annotation" style={style}>
      <div className="annotation-arrow" />
      <div className="annotation-header">{info.name}</div>
      <AnnotationRow title="Tel:" content={info.phone} />
      <AnnotationRow title="Email:" content={info.email} />
      <AnnotationRow title="Add:" content={info.address} />
    </div>
  );
}

function AnnotationRow({ title, content }) {
  return (
    <div className="annotation-row">
      <div className="annotation-column">{title}</div>
      <div>{content}</div>
    </div>
  );
}

const FontReadyChart = React.lazy(() =>
  document.fonts.load("900 24px 'Font Awesome 5 Free'").then(() => ({
    default: AnnotationDemo,
  })),
);

export function Demo() {
  return (
    <React.Suspense fallback="">
      <FontReadyChart />
    </React.Suspense>
  );
}

const root = createRoot(document.getElementById("regraph"));
root.render(<Demo />);import { style } from "@ci/theme/rg/js/storyStyles";
const data = {
id1: {
...style.primary2,
size: 2,
fontIcon: { text: "fas fa-user", color: "white" },
data: {
name: "Amy Greenvale",
phone: "232-235-8374",
email: "[email protected]",
address: "6672 Ambassador Ave,\nGrand Ledge, MI\n48837",
},
},
id2: {
...style.primary1,
size: 1,
fontIcon: { text: "fas fa-user", color: "white" },
data: {
name: "Tim Tadgel",
phone: "124-095-8356",
email: "[email protected]",
address: "261 Central Plains Rd\nPalmyra, VA\n22963",
},
},
id3: {
...style.primary1,
size: 1,
fontIcon: { text: "fas fa-user", color: "white" },
data: {
name: "George White",
phone: "213-475-5425",
email: "[email protected]",
address: "86 Reposo Dr\nOak View, CA\n93022",
},
},
id4: {
...style.primary1,
size: 1,
fontIcon: { text: "fas fa-user", color: "white" },
data: {
name: "Betty Buchanan",
phone: "208-343-3912",
email: "[email protected]",
address: "71 Litchfield St\nHartford, CT\n06112",
},
},
id5: {
...style.primary1,
size: 1,
fontIcon: { text: "fas fa-user", color: "white" },
data: {
name: "Helen Hoffman",
phone: "279-696-6393",
email: "[email protected]",
address: "4937 Old Way Rd\nBrowns Summit, NC\n27214",
},
},
id6: {
...style.primary1,
size: 1,
fontIcon: { text: "fas fa-user", color: "white" },
data: {
name: "Max Malone",
phone: "214-953-3285",
email: "[email protected]",
address: "6241 Main St\nQueenstown, MD\n21658",
},
},
id7: { id1: "id1", id2: "id2", ...style.link },
id8: { id1: "id1", id2: "id3", ...style.link },
id9: { id1: "id1", id2: "id4", ...style.link },
id10: { id1: "id1", id2: "id5", ...style.link },
id11: { id1: "id1", id2: "id6", ...style.link },
};
const chartOptions = {
dragPan: false,
fit: "none",
iconFontFamily: "Font Awesome 5 Free",
imageAlignment: { "fas fa-user": { size: 0.9, dy: -3 } },
minZoom: 0.5,
navigation: false,
};
export { data, chartOptions };<!doctype html>
<html>
<head>
<link rel="stylesheet" href="./style.css" />
</head>
<body>
<div id="regraph" style="height: 100vh"></div>
<script type="module" src="./code.jsx"></script>
</body>
</html>@import "@ci/theme/rg/css/variables.css";
.annotation {
display: "block";
position: absolute;
border: #252c32 2px solid;
background: white;
width: 200px;
font-size: 12px;
border-radius: 2px;
-webkit-touch-callout: none; /* iOS Safari */
-webkit-user-select: none; /* Safari */
-khtml-user-select: none; /* Konqueror HTML */
-moz-user-select: none; /* Old versions of Firefox */
-ms-user-select: none; /* Internet Explorer/Edge */
user-select: none;
}
.annotation-arrow {
position: absolute;
top: 51px;
left: -16px;
transform: rotate(-45deg);
border: solid 15px transparent;
border-top: #252c32 15px solid;
border-left: #252c32 15px solid;
}
.annotation-header {
border-bottom: #252c32 2px solid;
background-color: var(--primary0);
padding: 6px 12px;
color: #252c32;
font-size: 16px;
}
.annotation-row {
background: white;
padding: 5px 8px;
}
.annotation-row.top {
padding-top: 0px;
}
.annotation-row.bottom {
padding-bottom: 0px;
}
.annotation-row > * {
display: inline-block;
}
.annotation-column {
width: 40px;
max-width: 40px;
vertical-align: top;
}
.annotation-row > :not(.annotation-column) {
white-space: pre-line;
}