KeyLines Examples
Styling
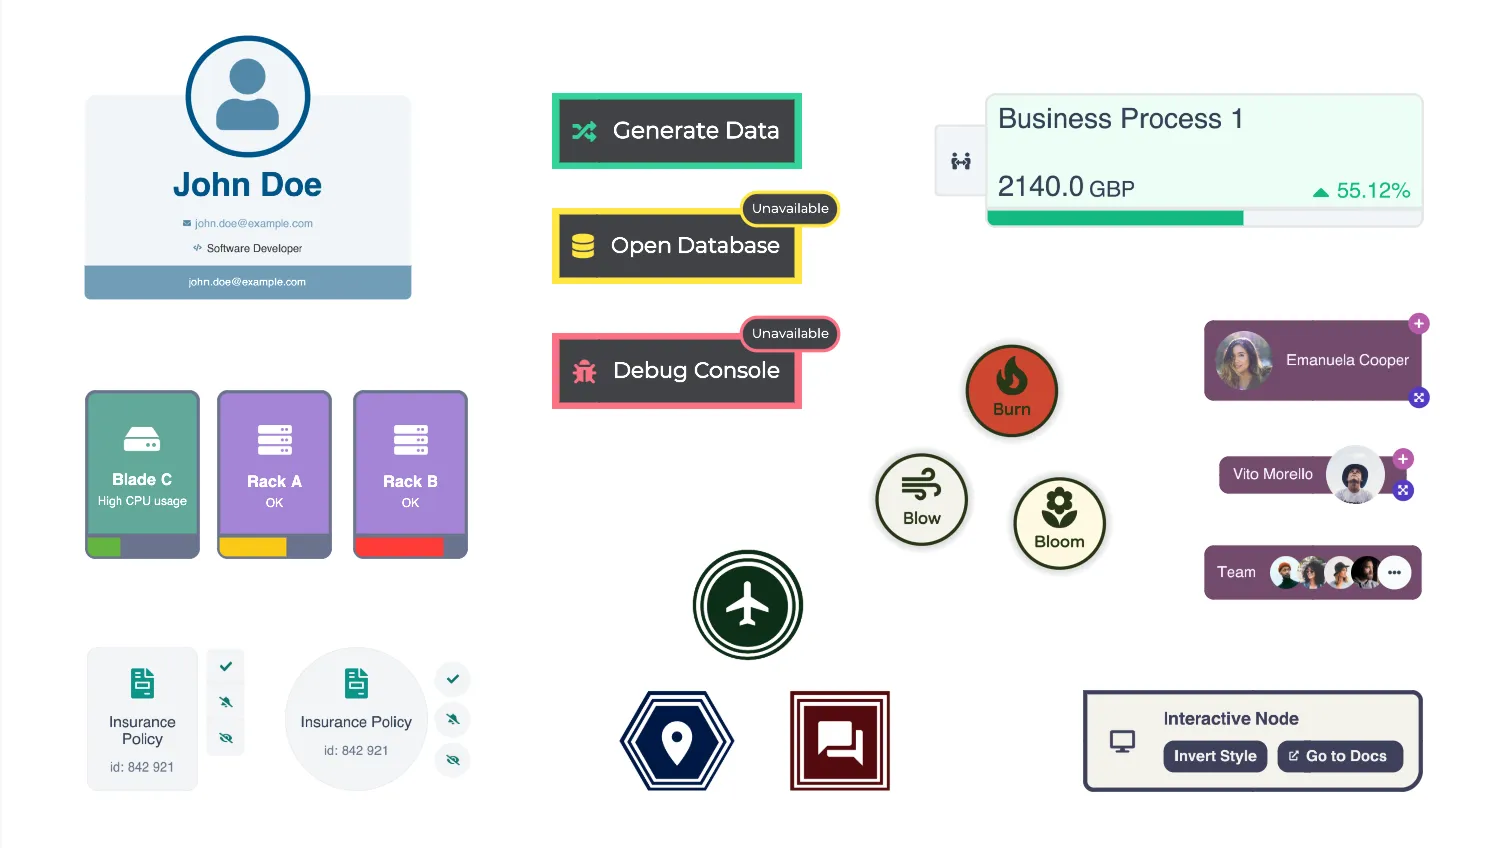
Advanced Node Styles
Create nodes with custom shapes, multiple labels and advanced styles.
See example
Animate Items
Animate properties to highlight interesting items.
See example
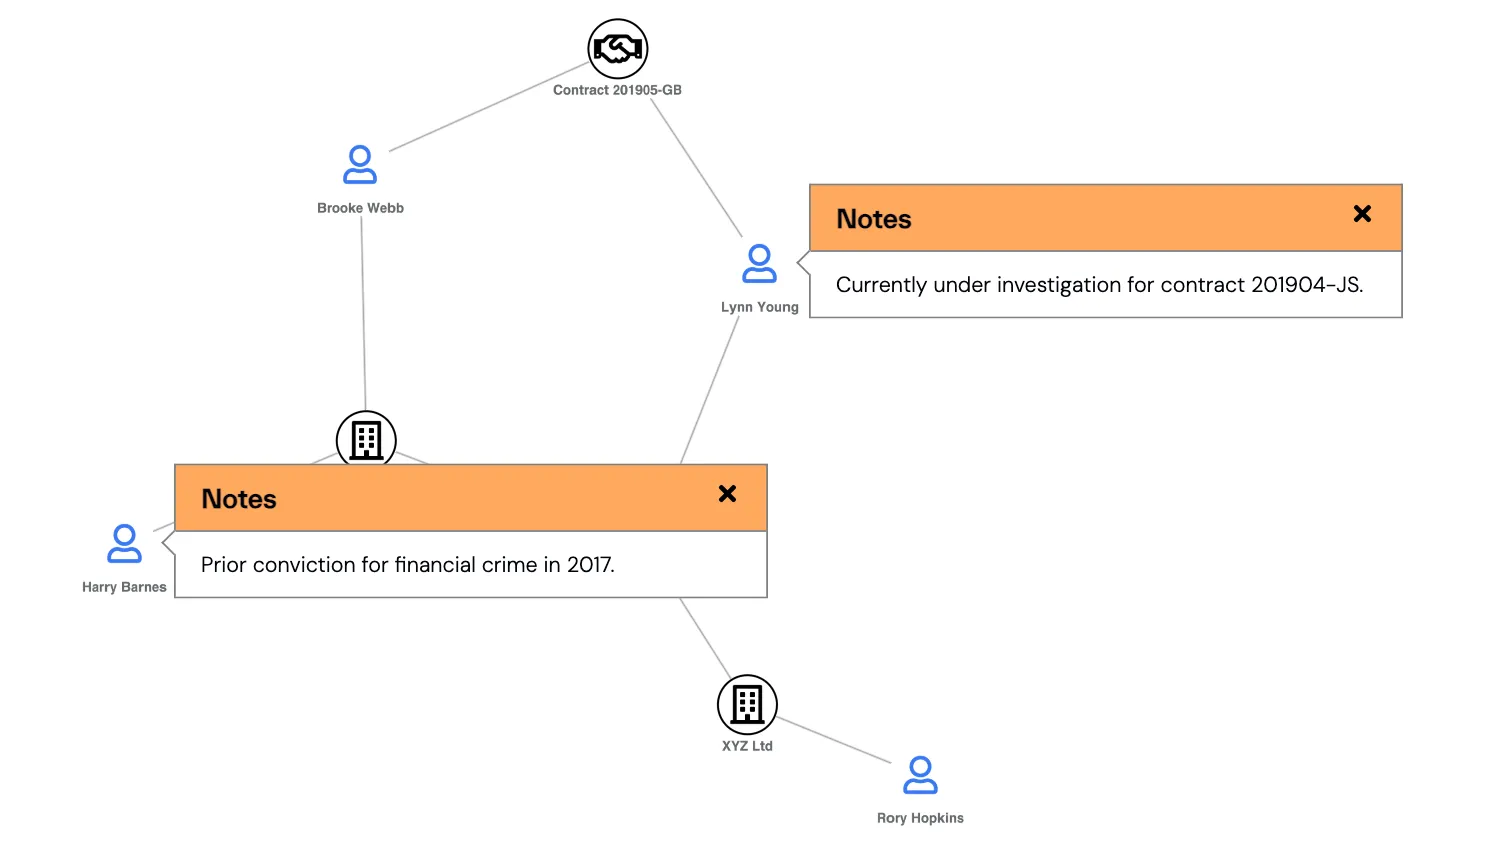
HTML Overlays
Create fully custom HTML overlays for the chart.
See example
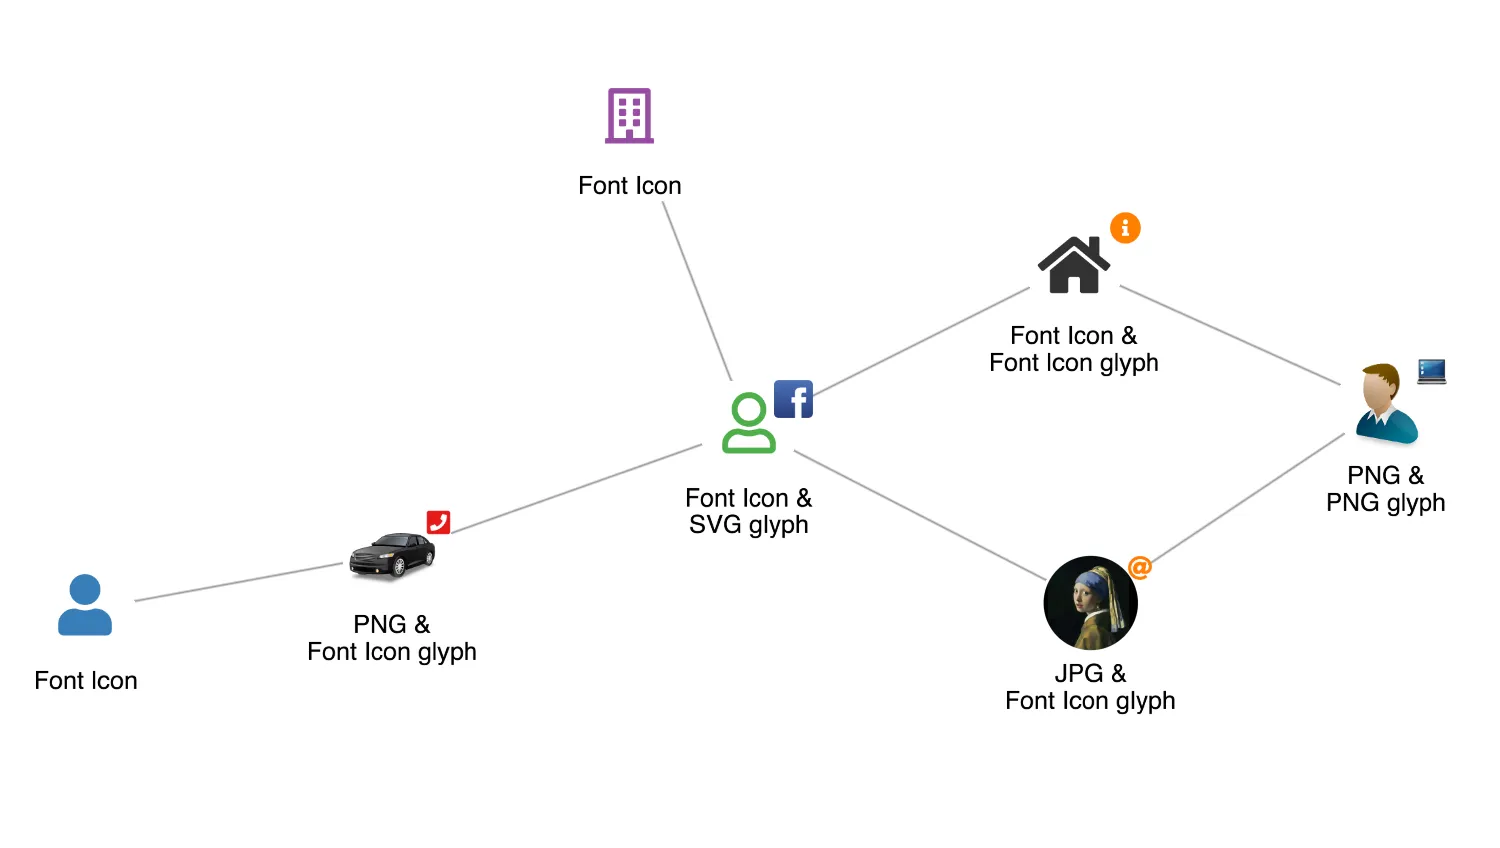
Icons and Images
Customise nodes and glyphs with images and font icons.
See example
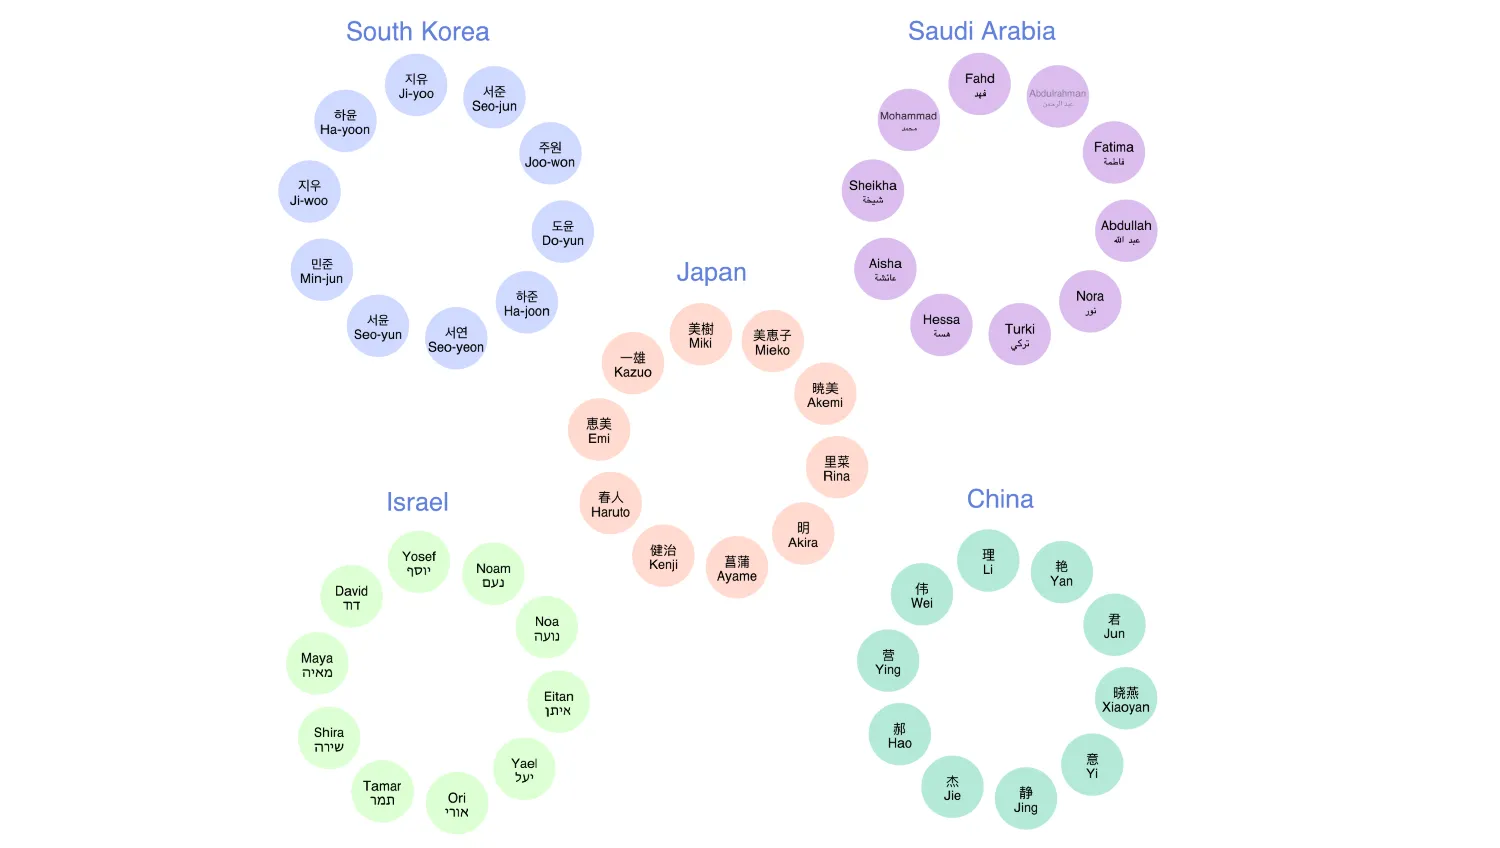
Multiple Languages
See how KeyLines automatically supports international languages.
See example
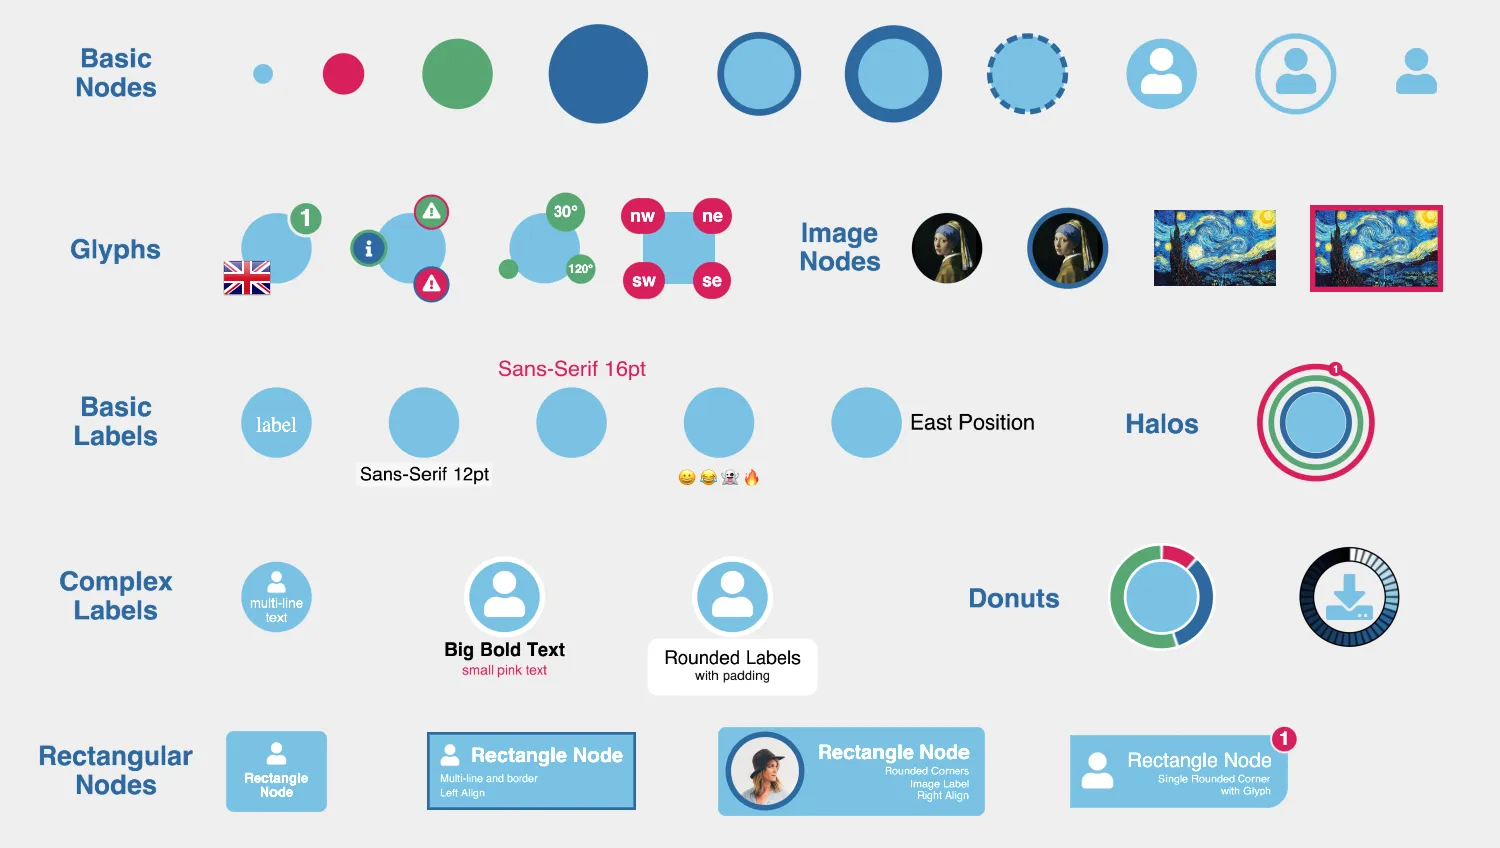
Node Styles
Explore ways to style nodes and make them stand out.
See example
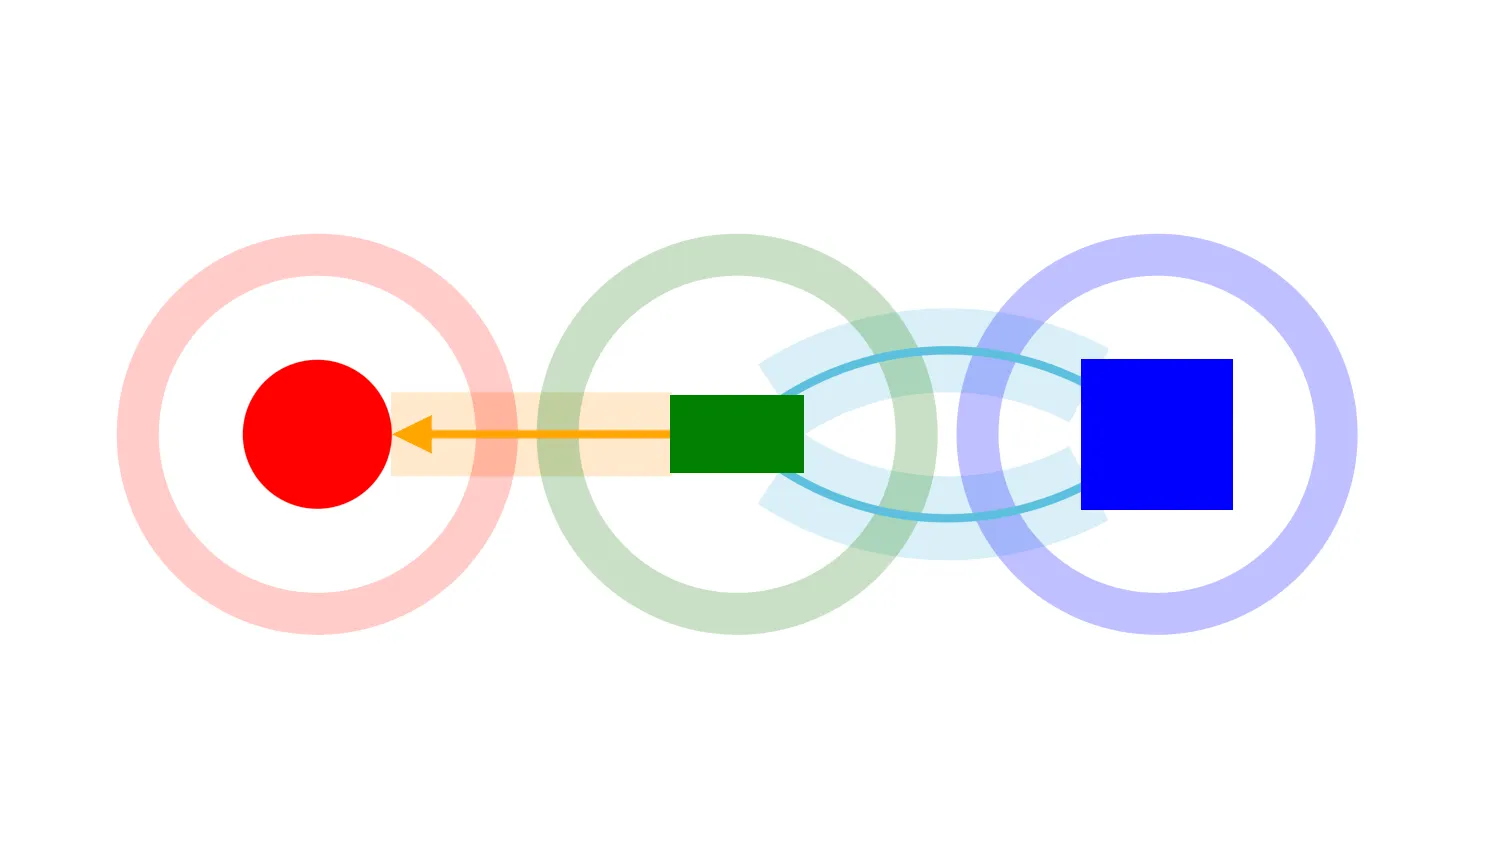
Ping Items
Use ping to highlight a node or link.
See example
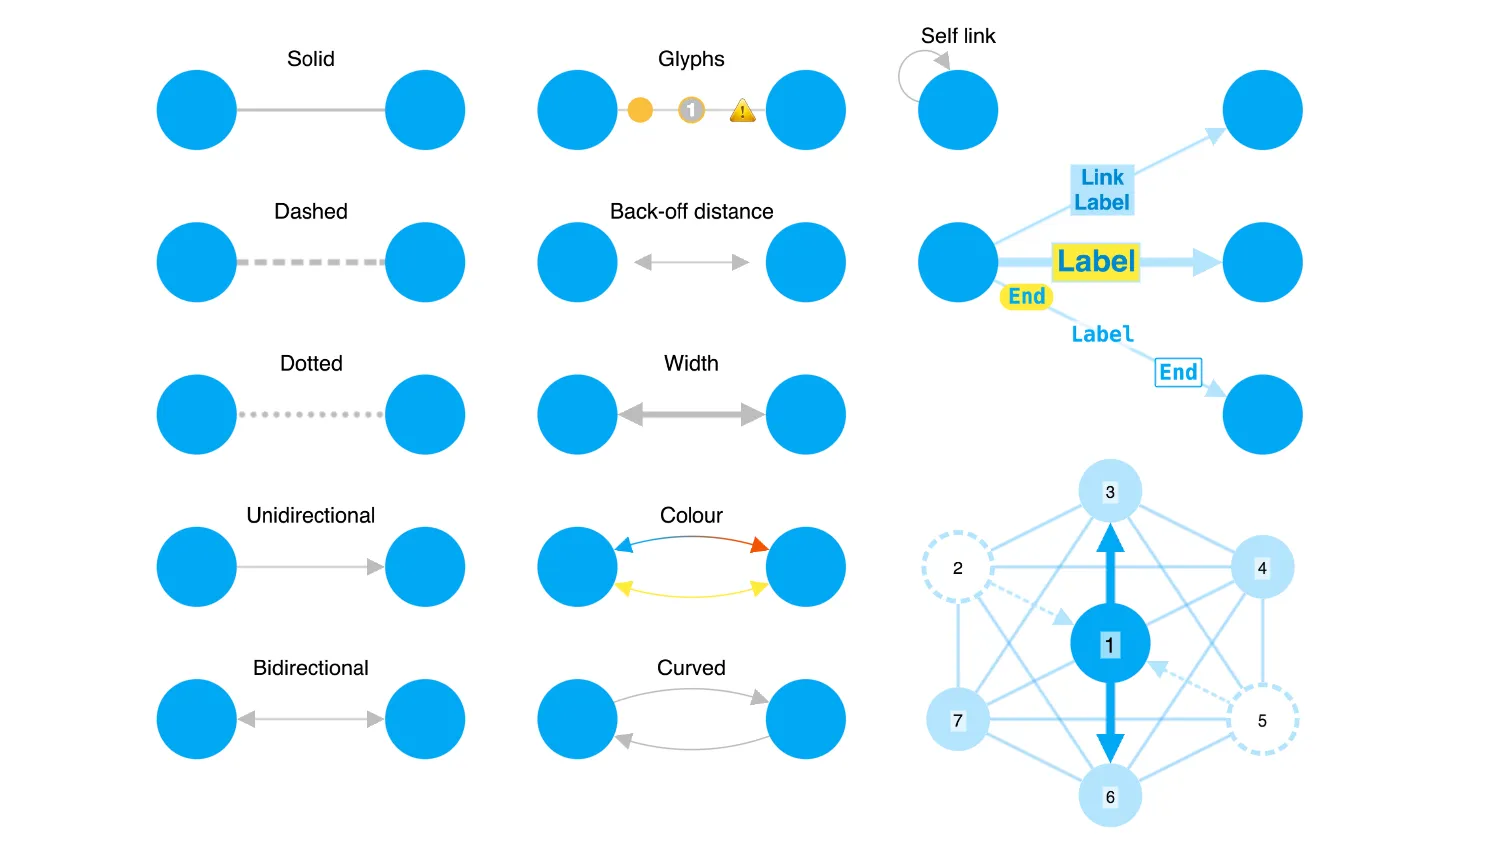
Style Links
Explore ways to style links and make them stand out.
See example
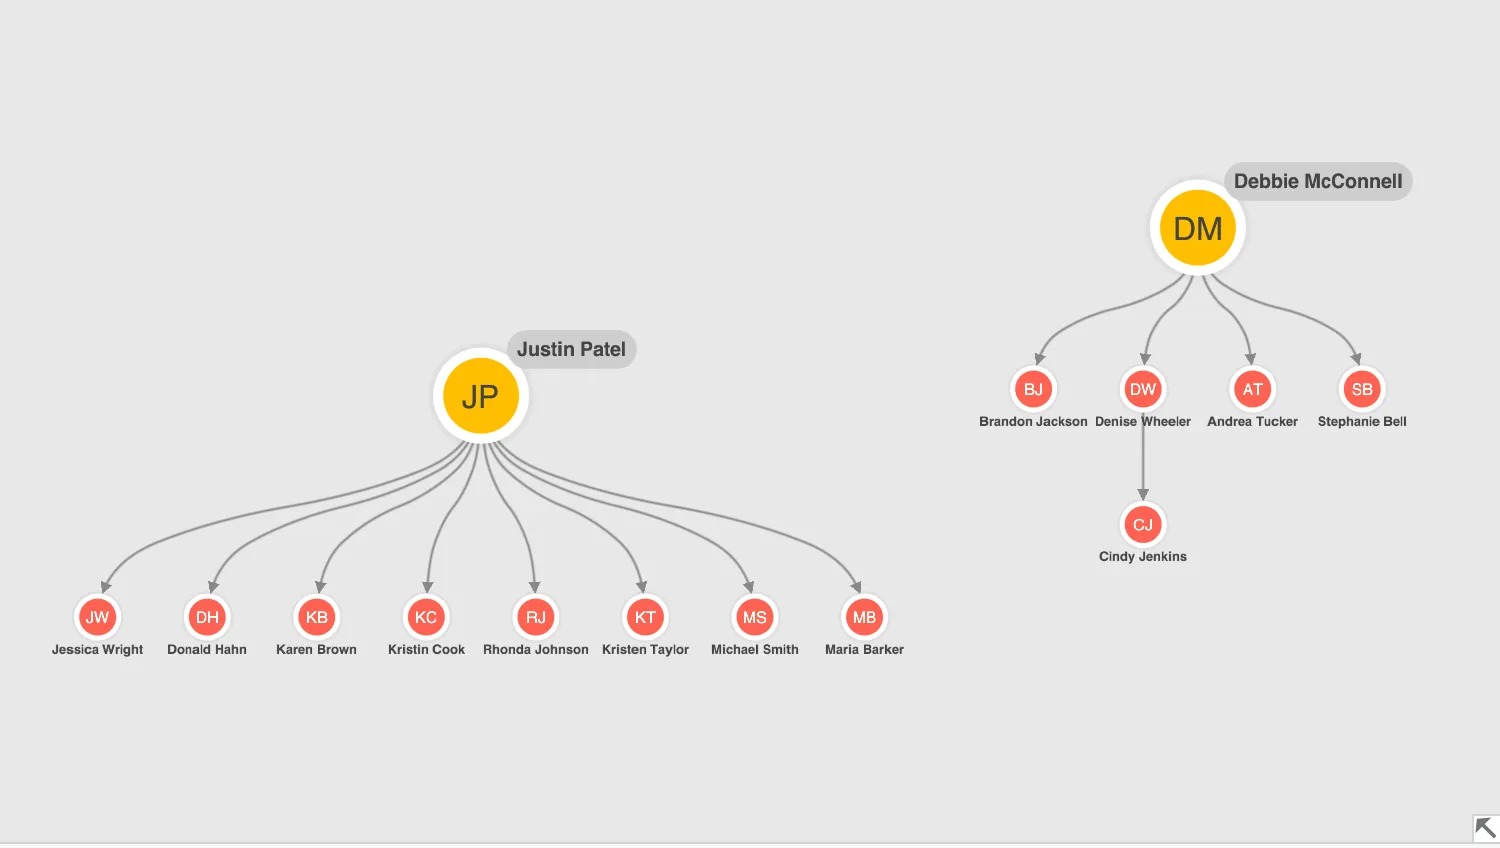
Styling Charts
Get the perfect look and feel for your network.
See example
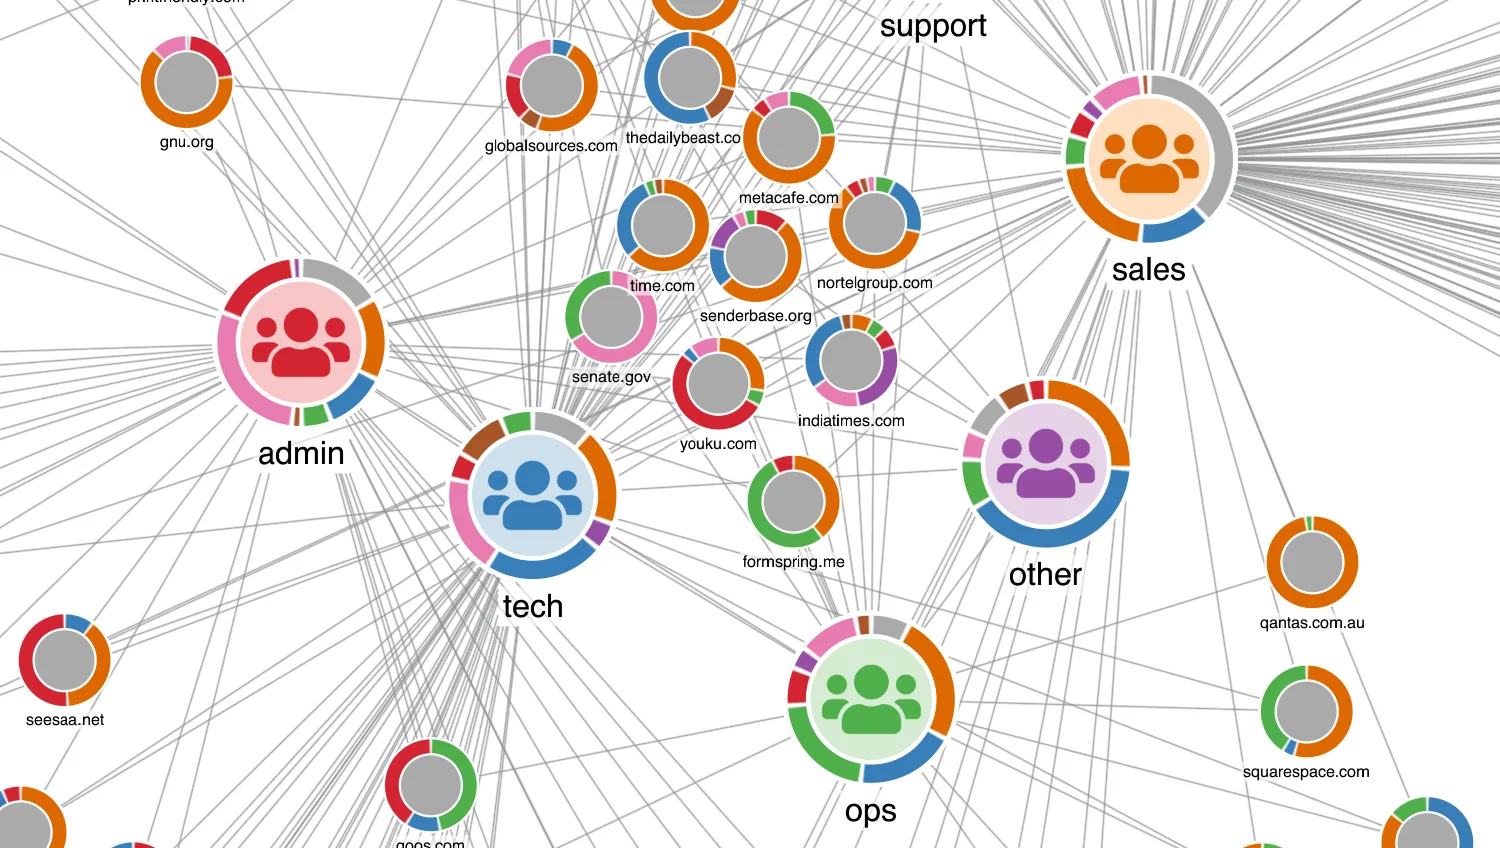
Donuts and Email Traffic
Use donuts to visualise relative volumes of email.
See example
Links
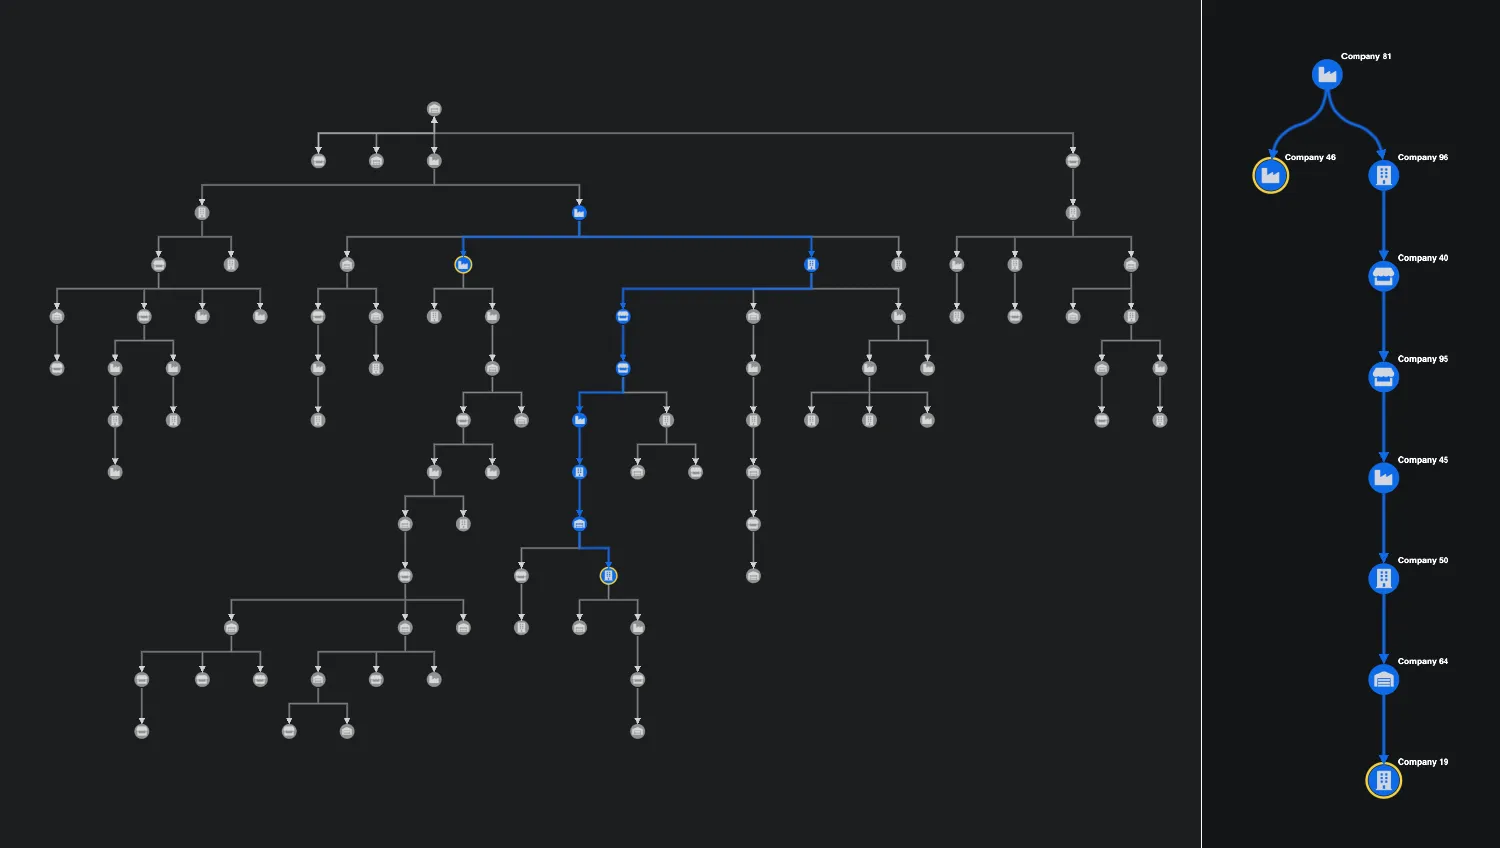
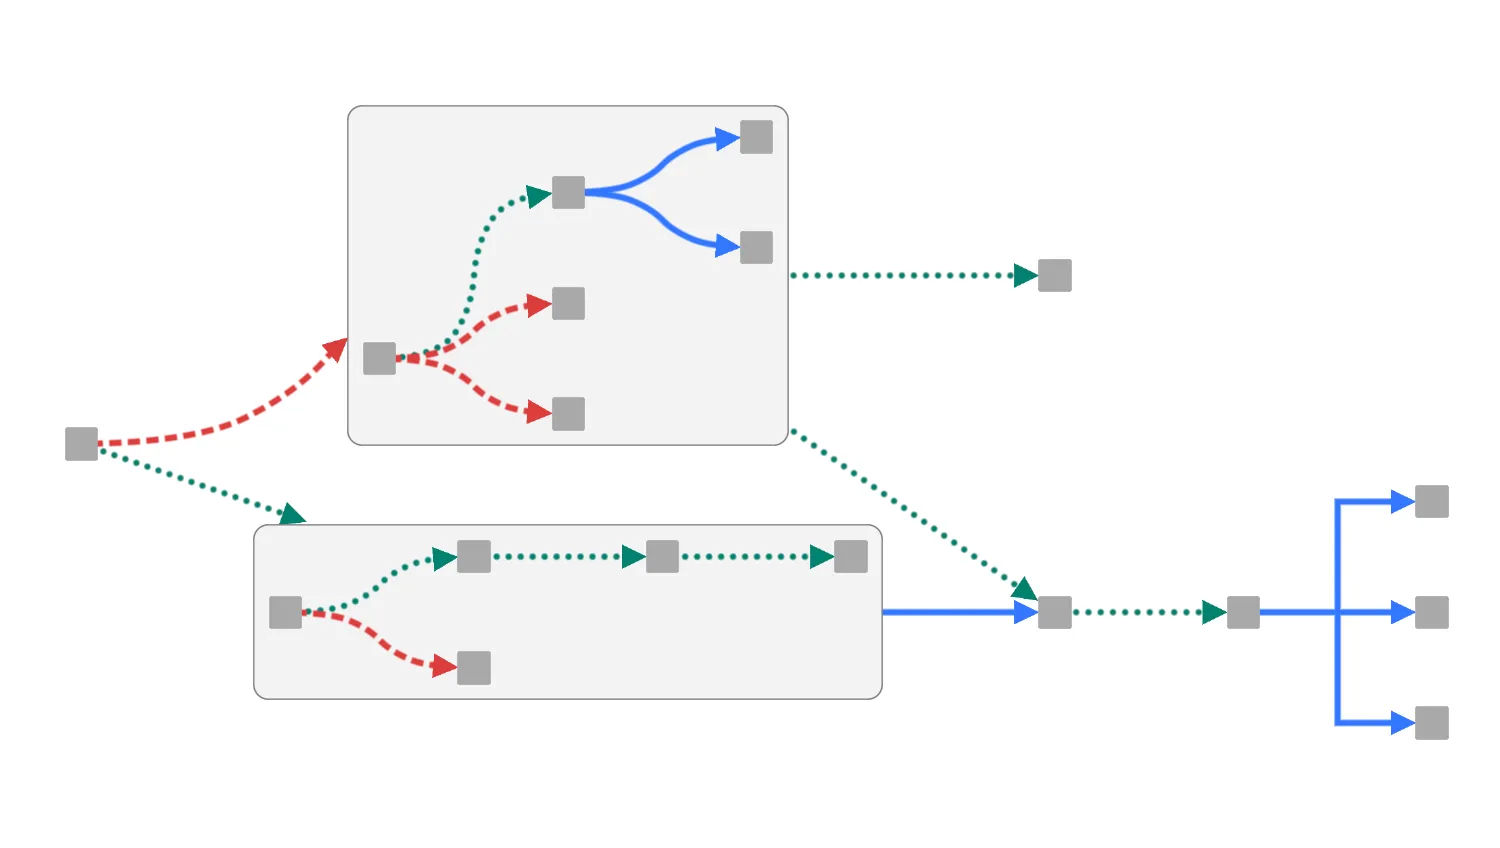
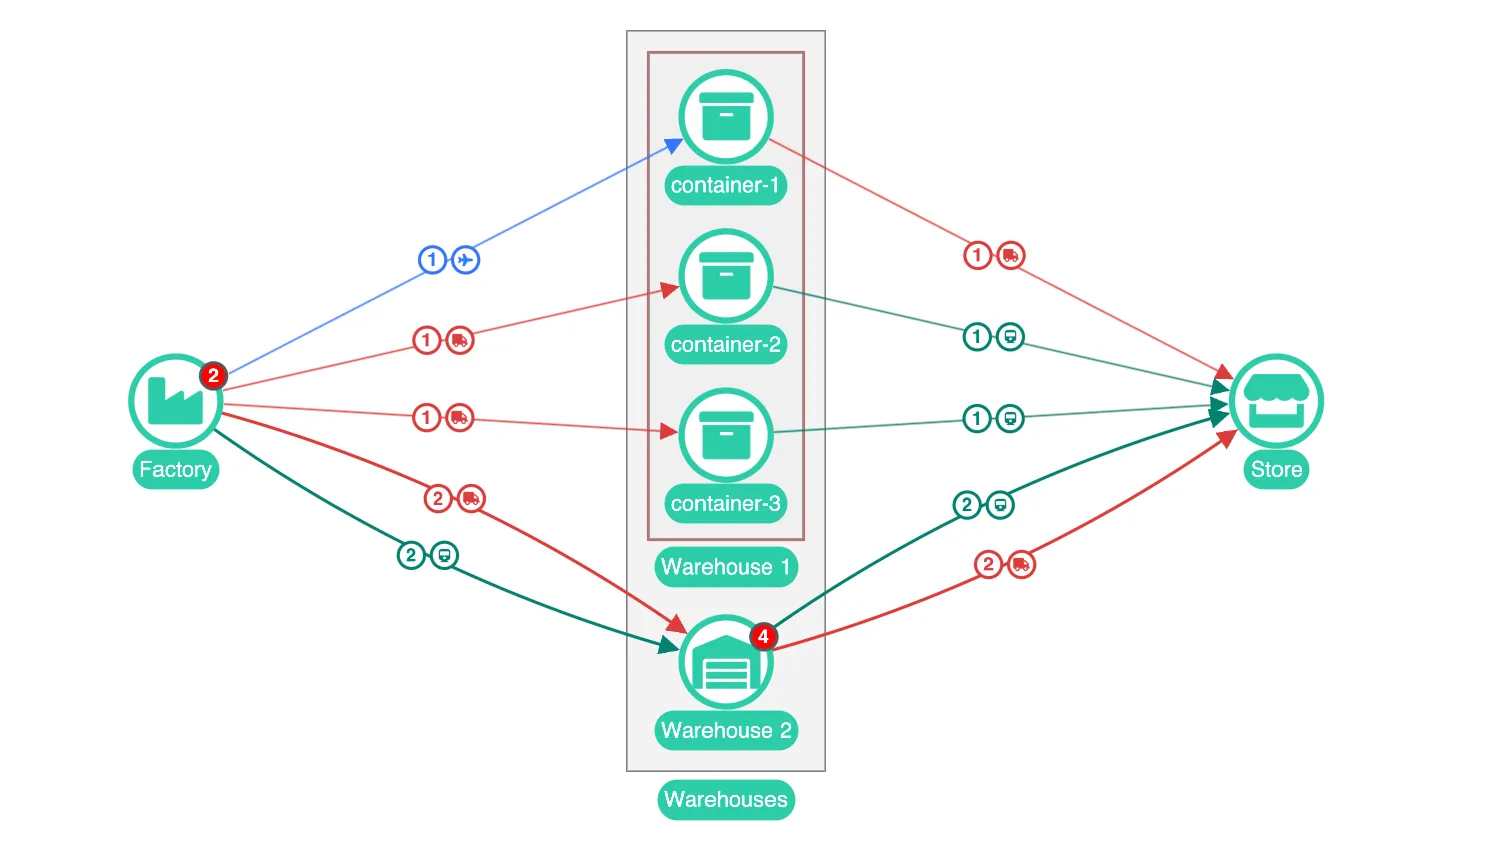
Annotations
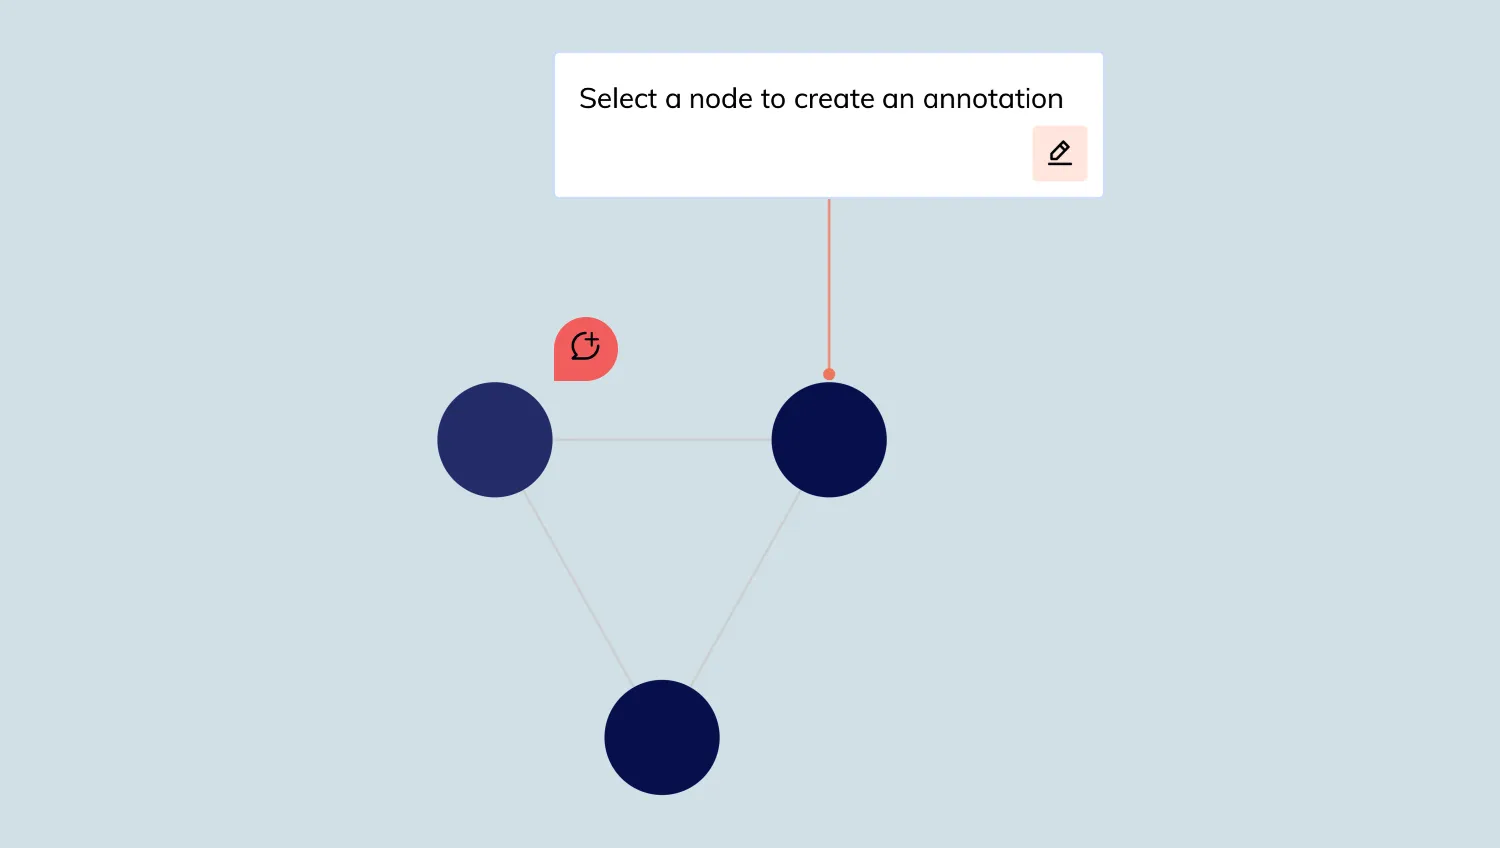
User-Created Annotations
Create and edit annotations on nodes.
See example
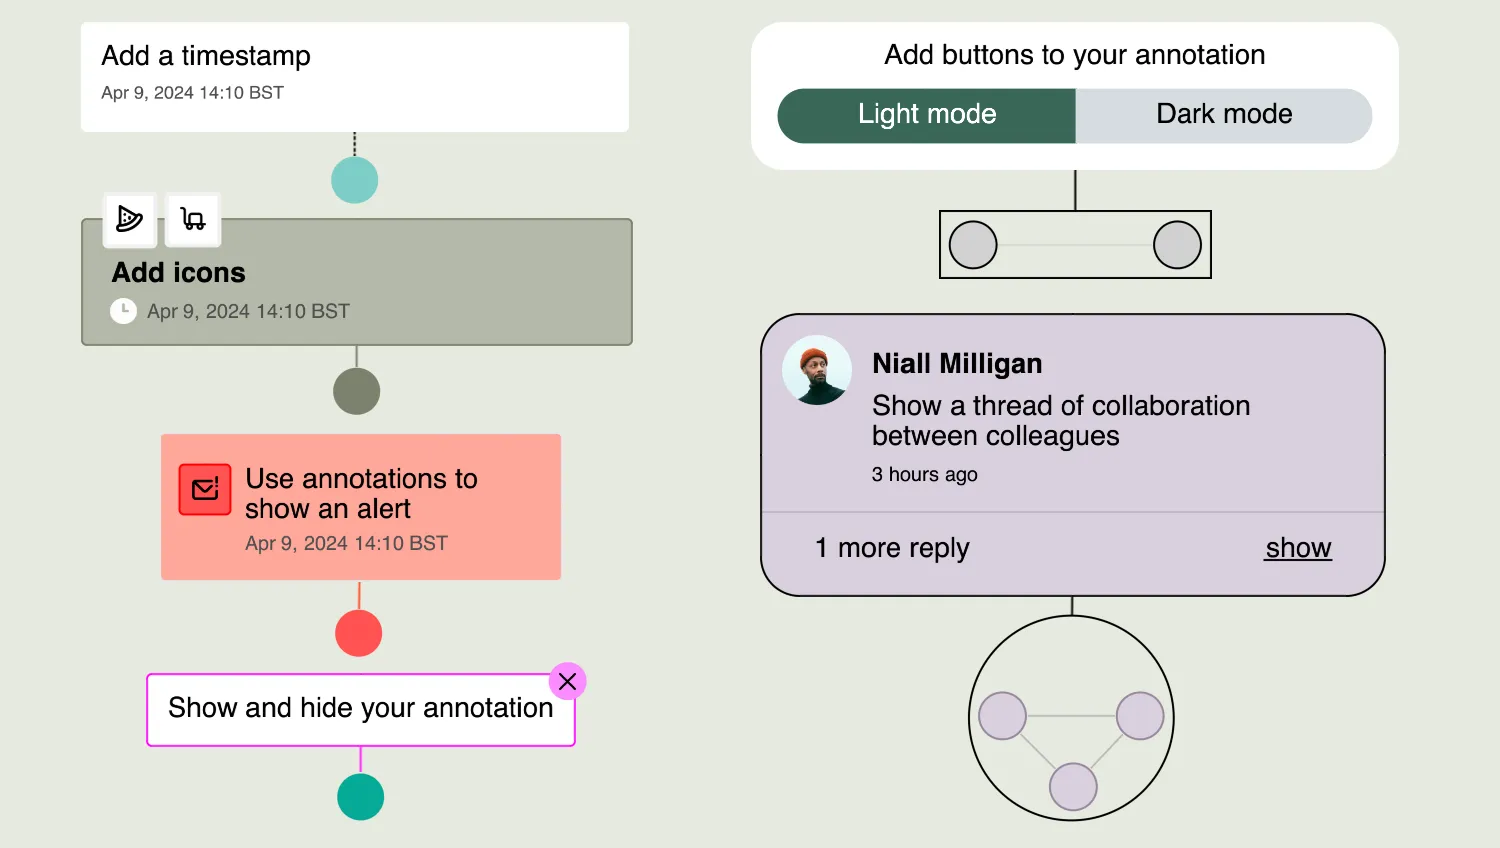
Advanced Annotation Styles
Create annotations with labels, buttons and interactive controls.
See example
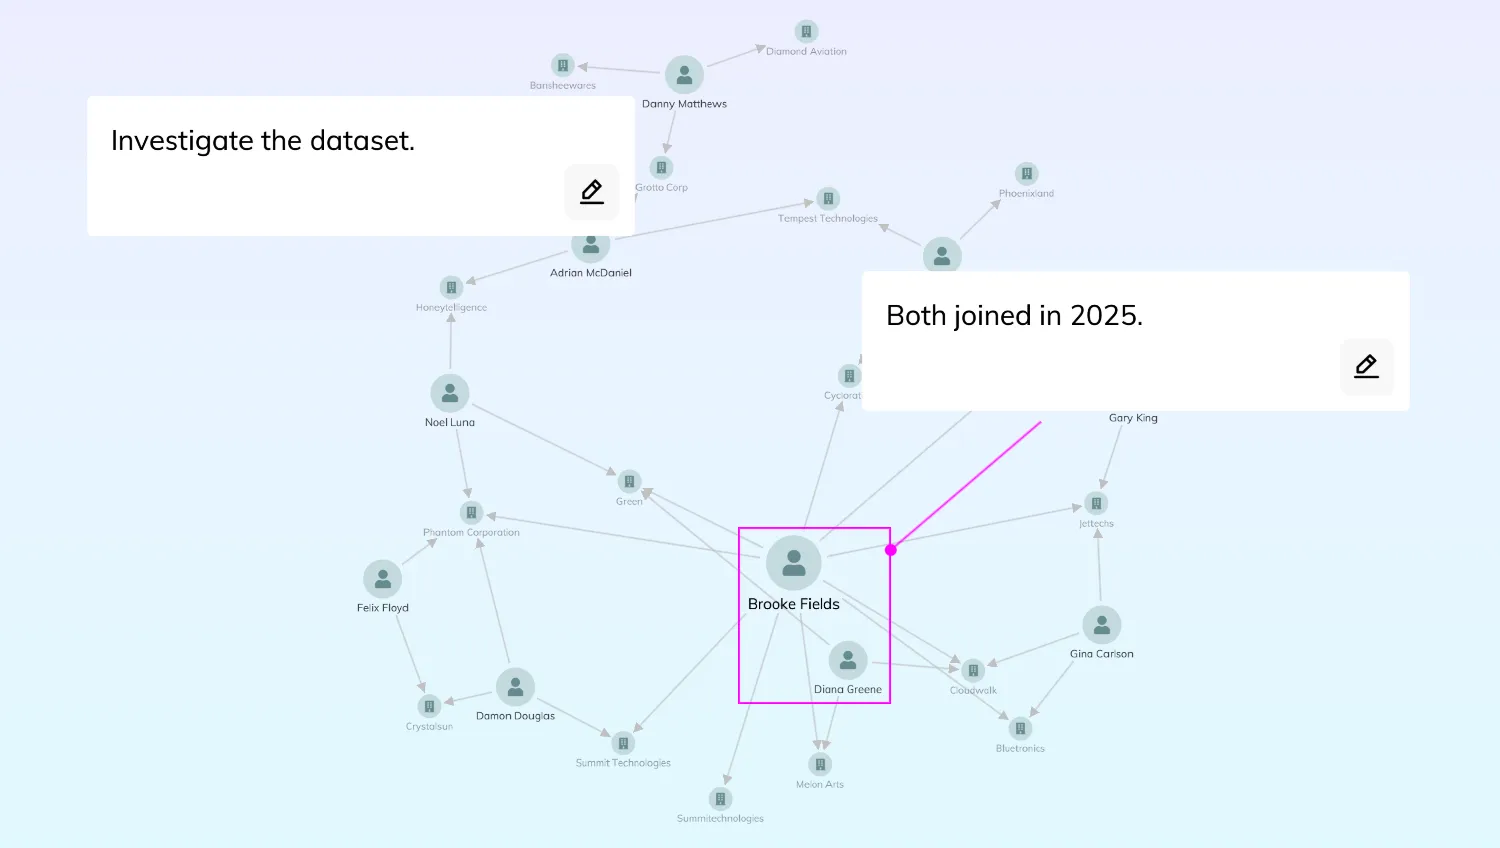
Annotating Charts
Create and edit annotations in your chart.
See example
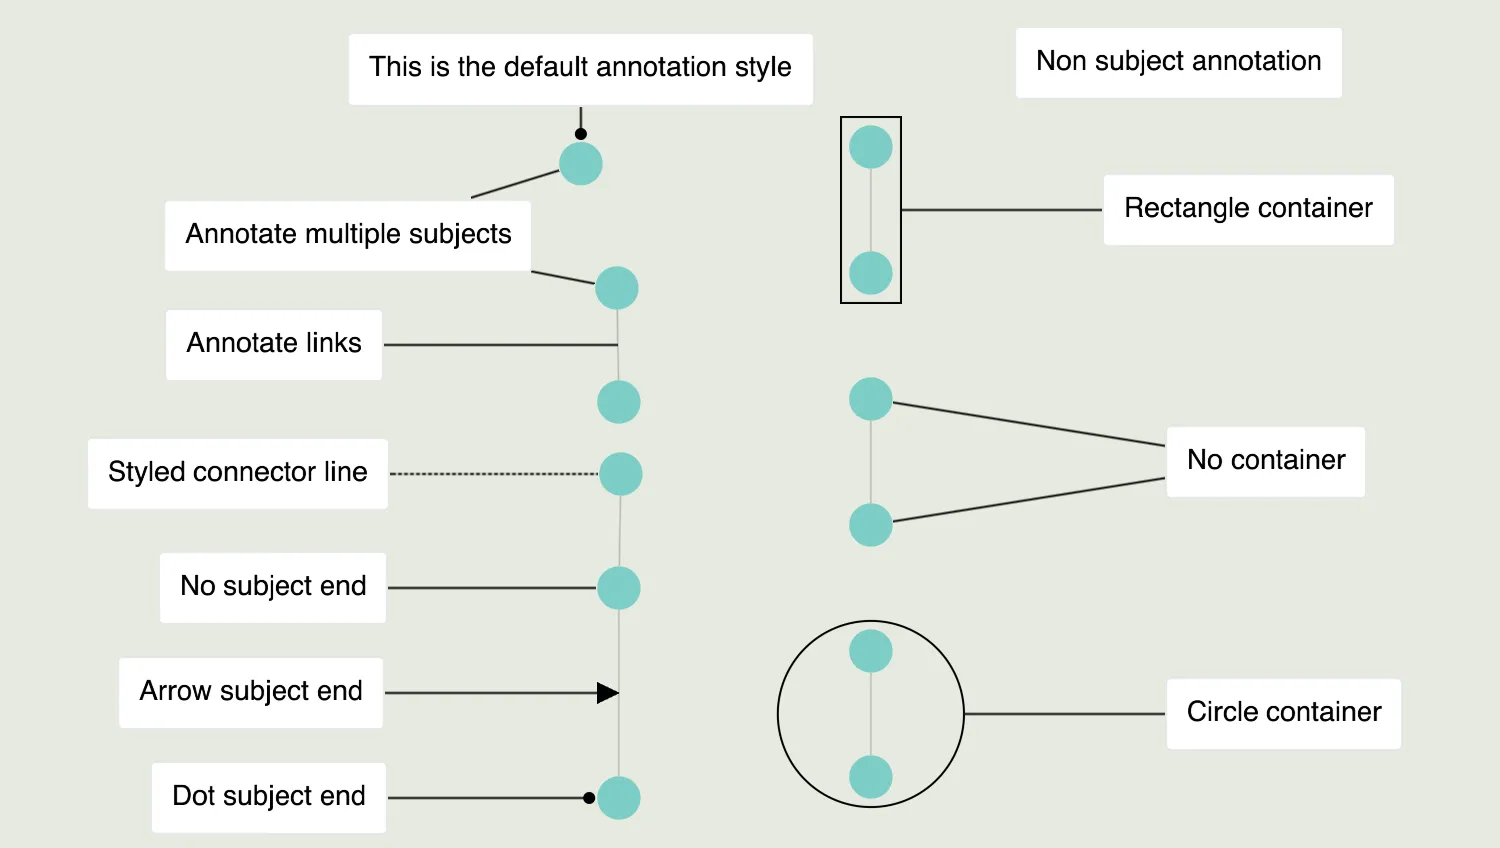
Annotations Basics
Understand the main concepts behind KeyLines annotations.
See example
Interactions
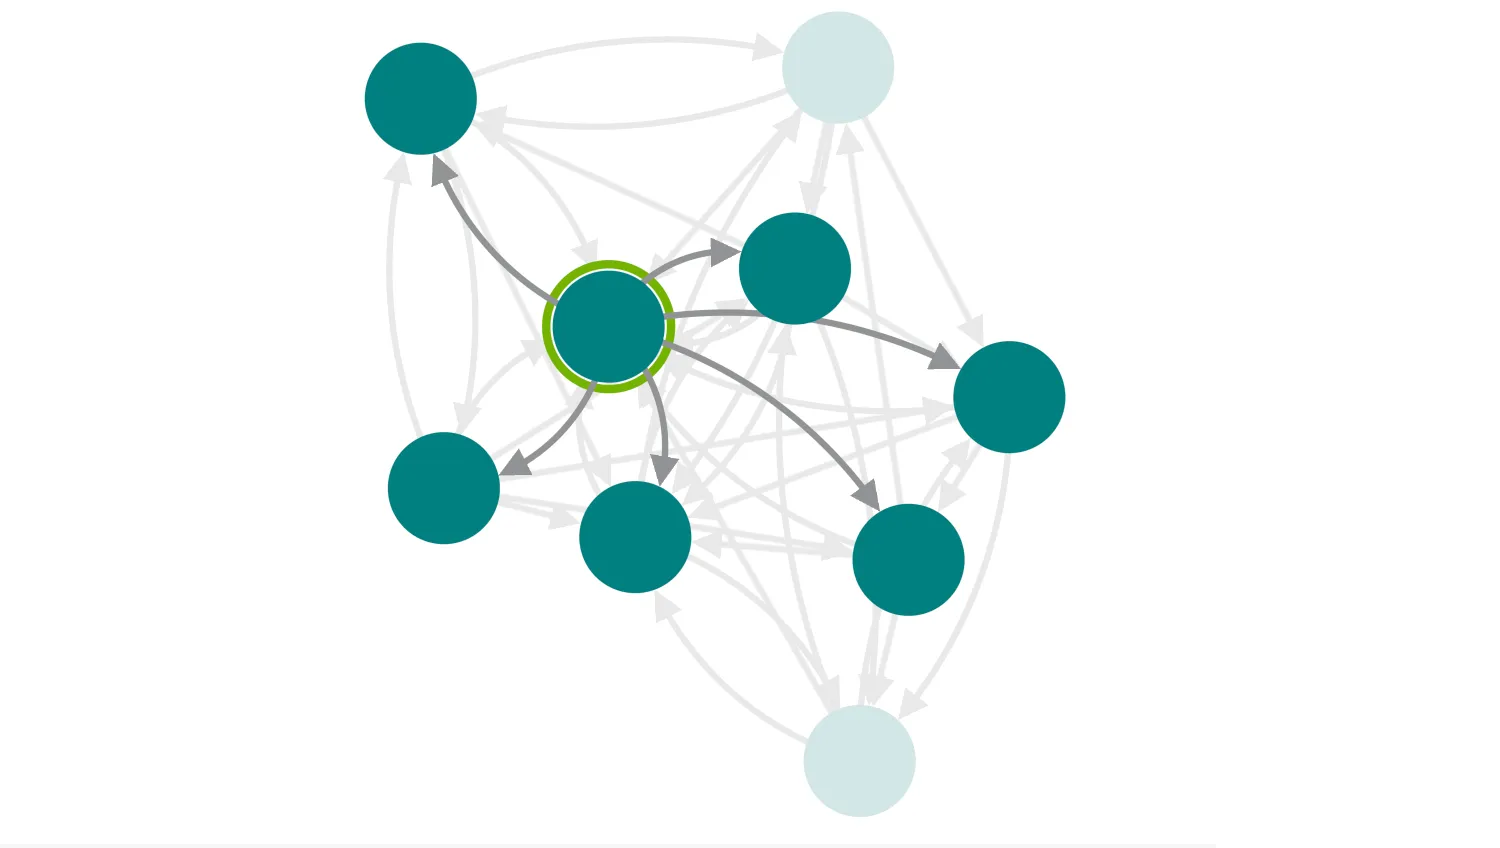
Selecting Items
Highlight key items by sending others to the background.
See example
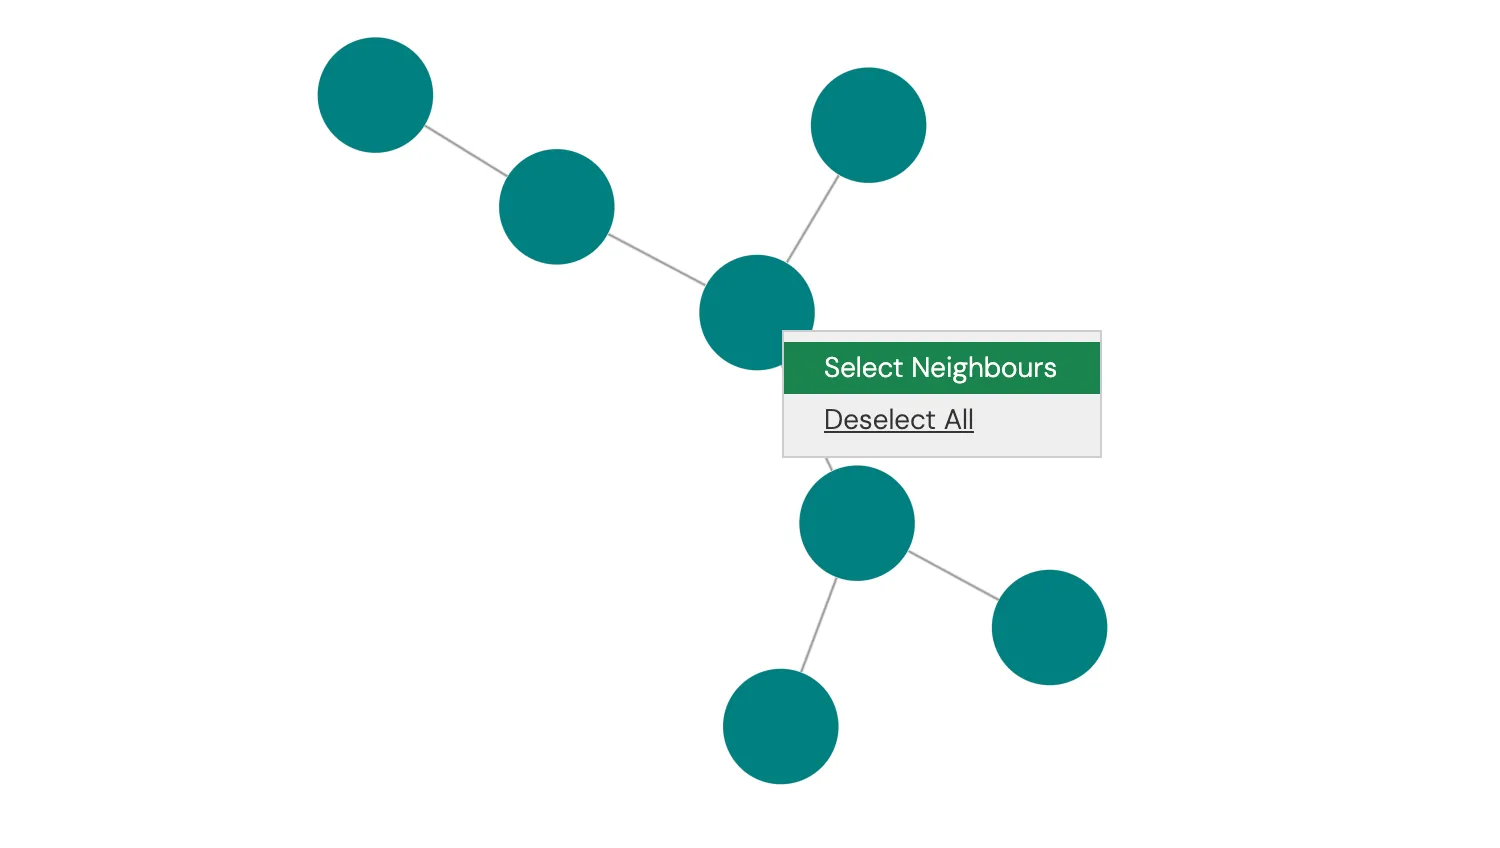
Context Menus
Include a context menu that provides element-specific options.
See example
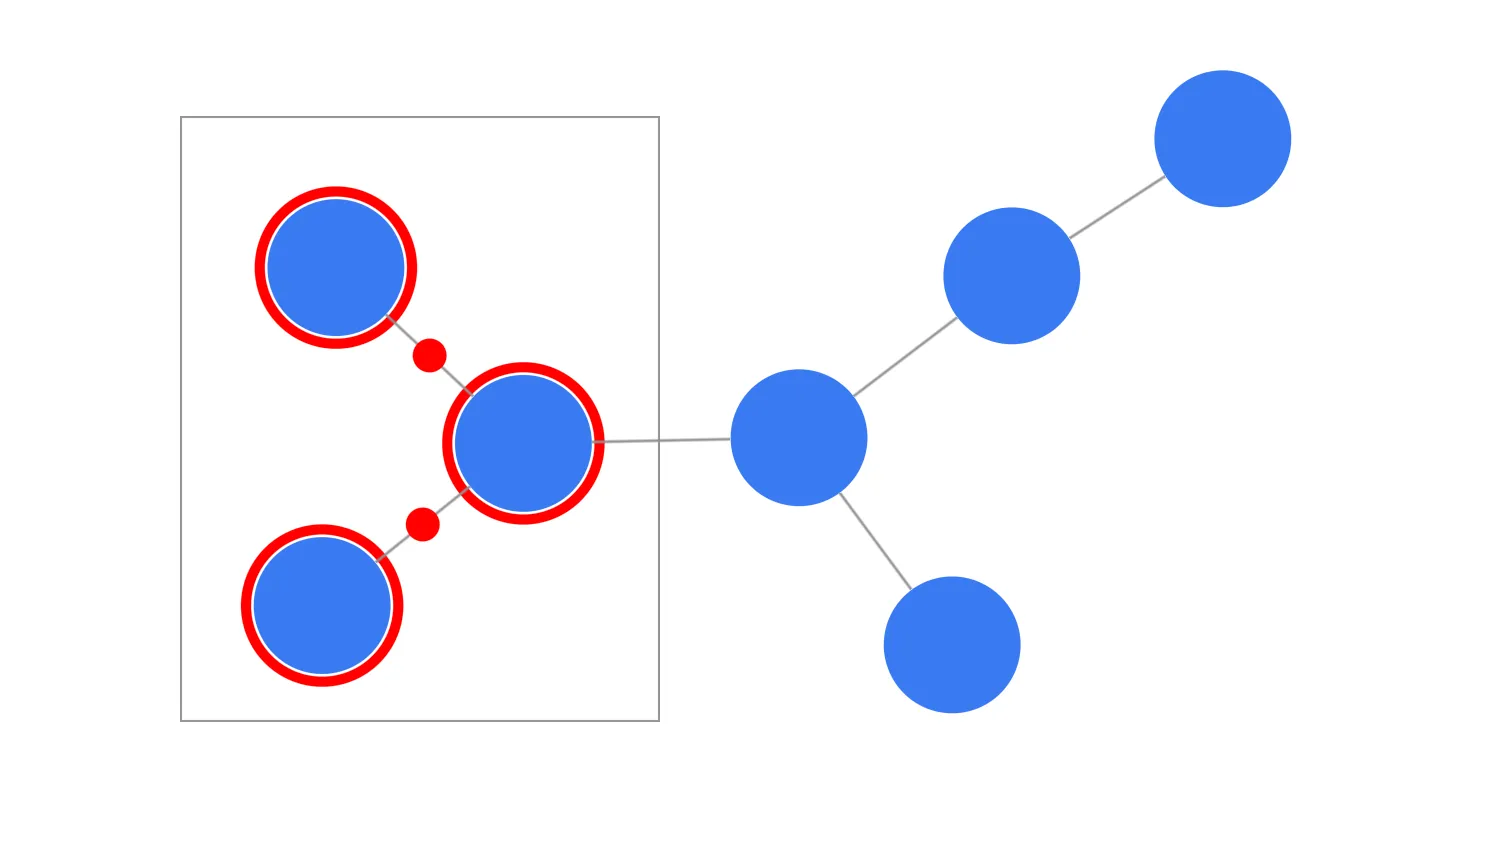
Custom Dragging
Customise dragging and panning behaviour.
See example
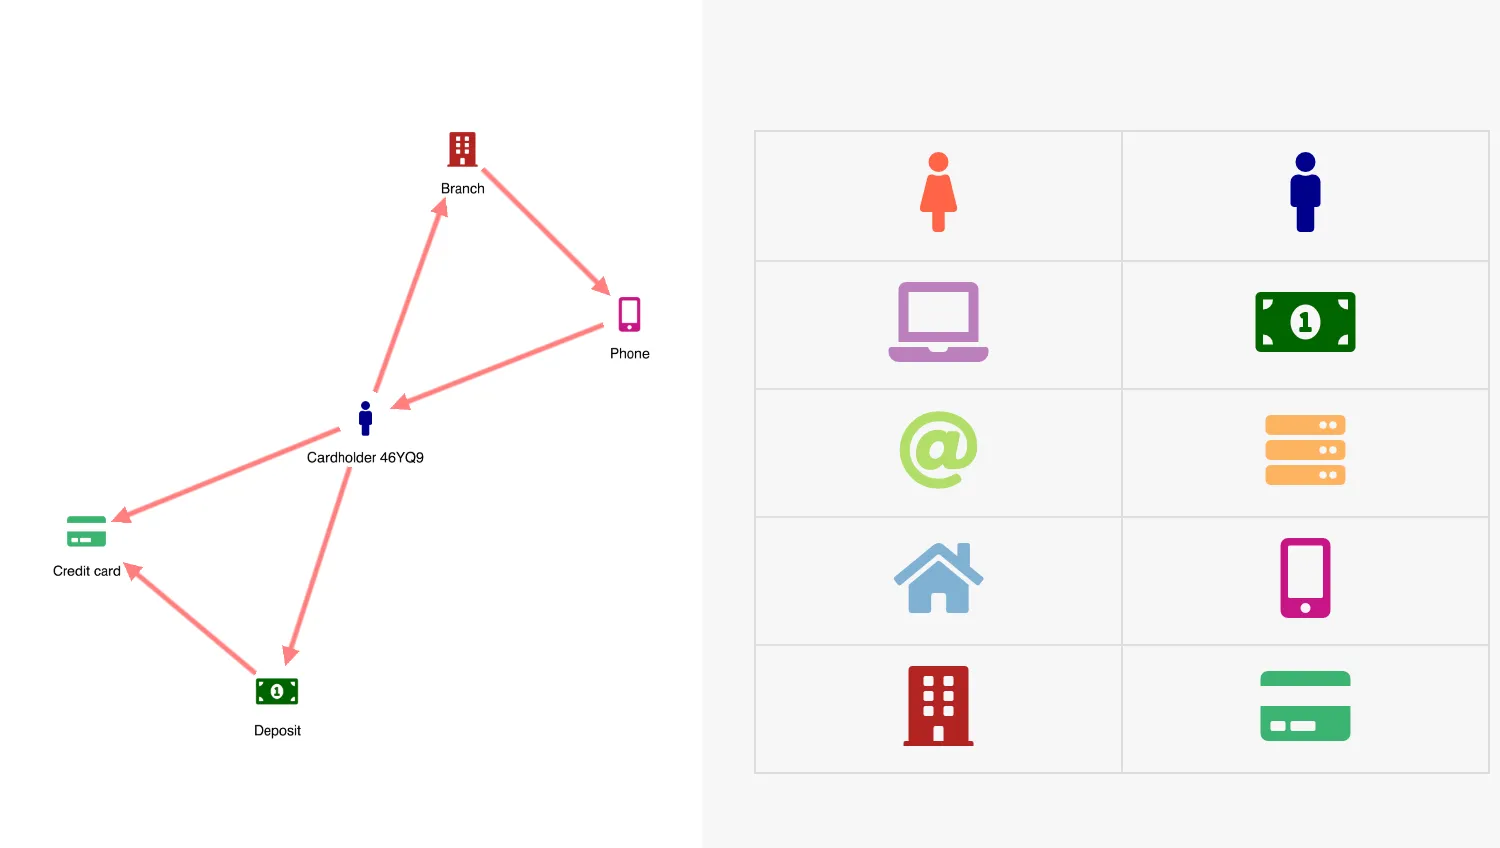
Drag and Drop Items
Drag nodes onto the chart to create a network.
See example
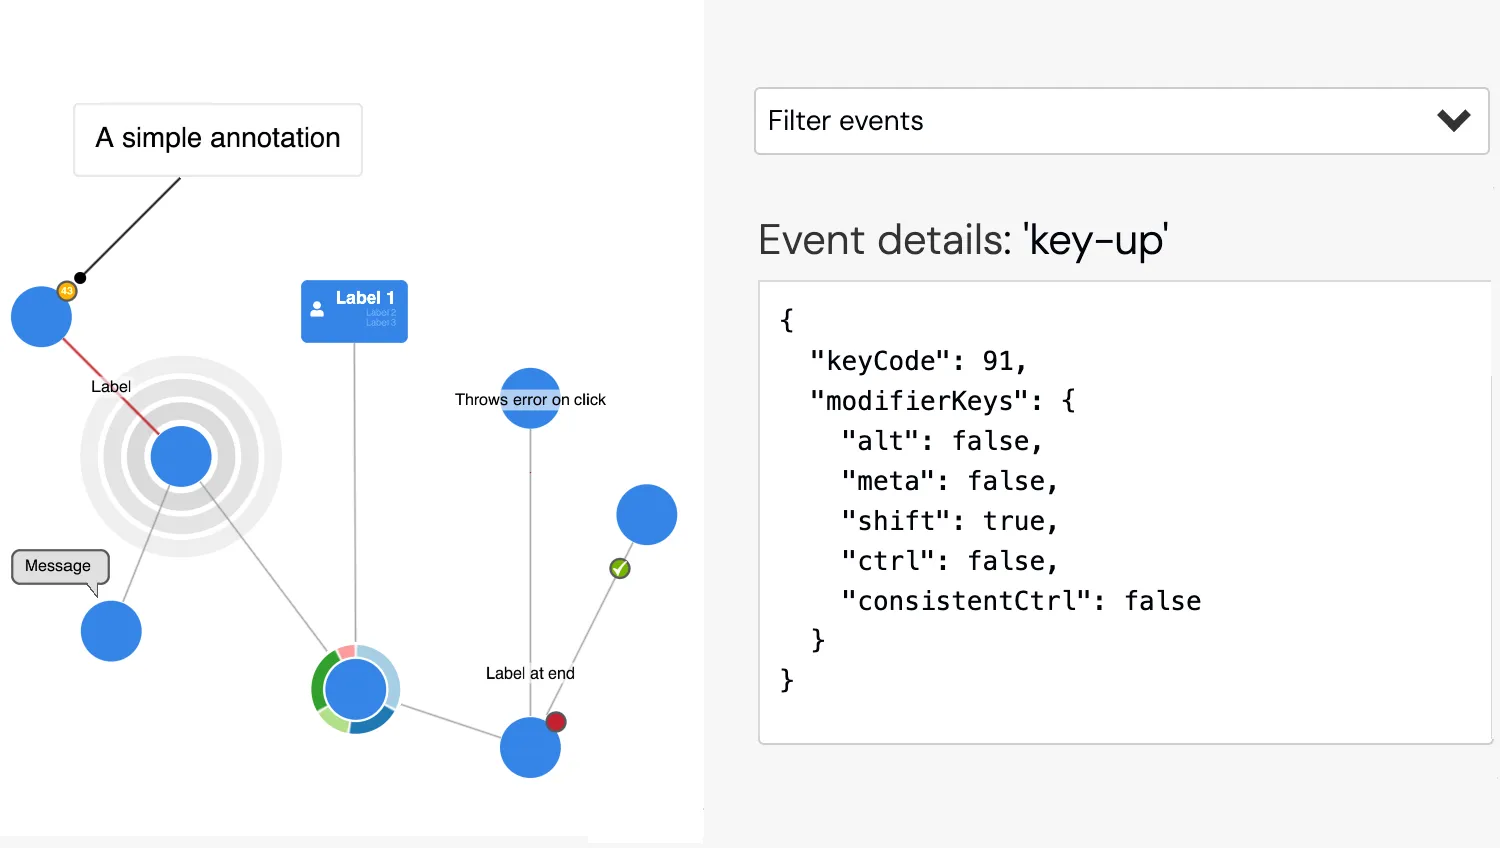
Interaction Events
Interact with the chart to explore keyboard, mouse and touch events.
See example
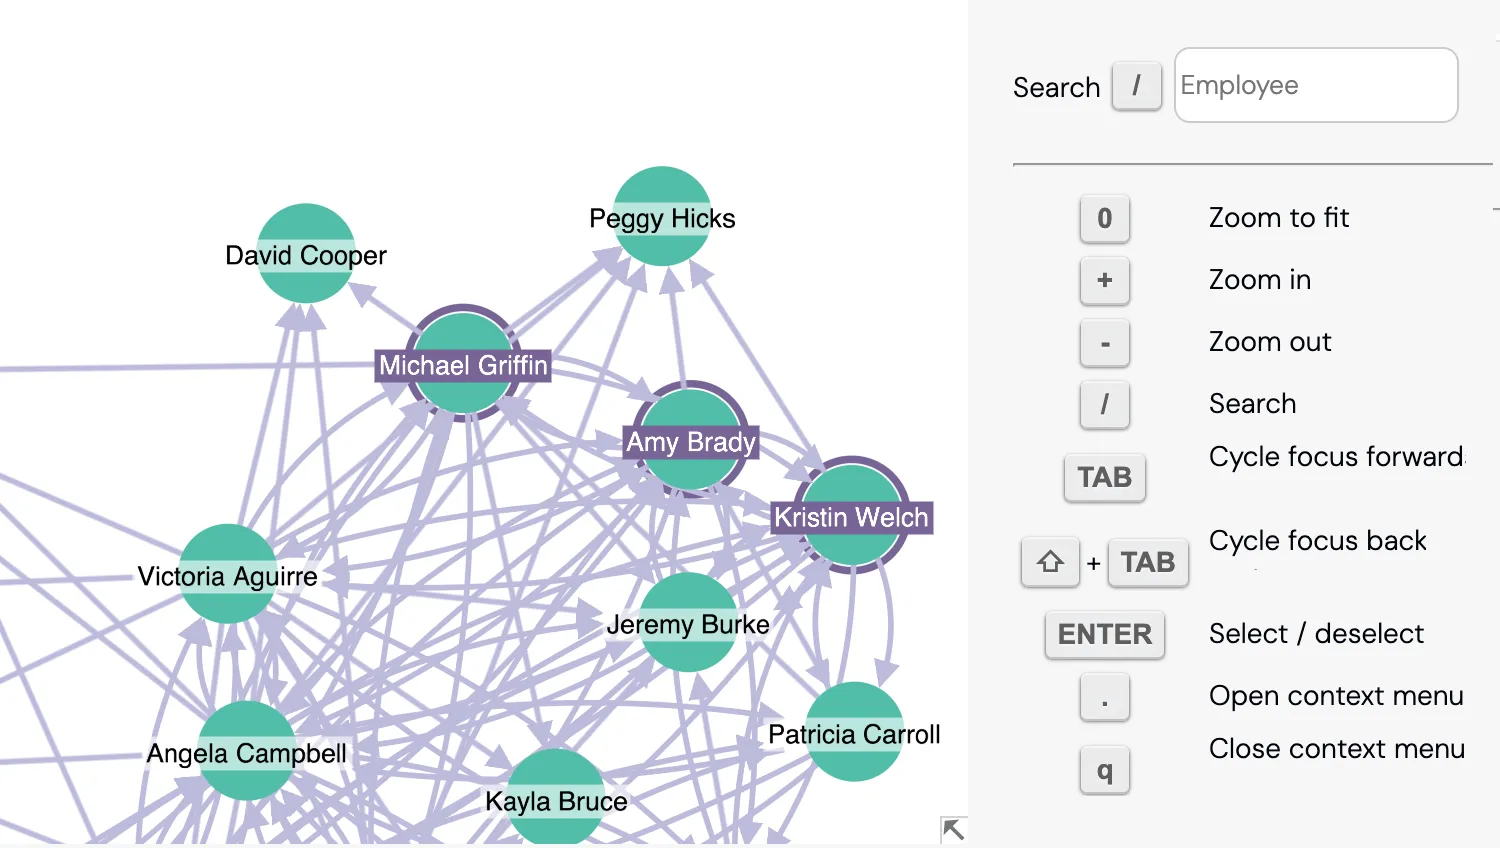
Keyboard Shortcuts
Interact with KeyLines using just the keyboard.
See example
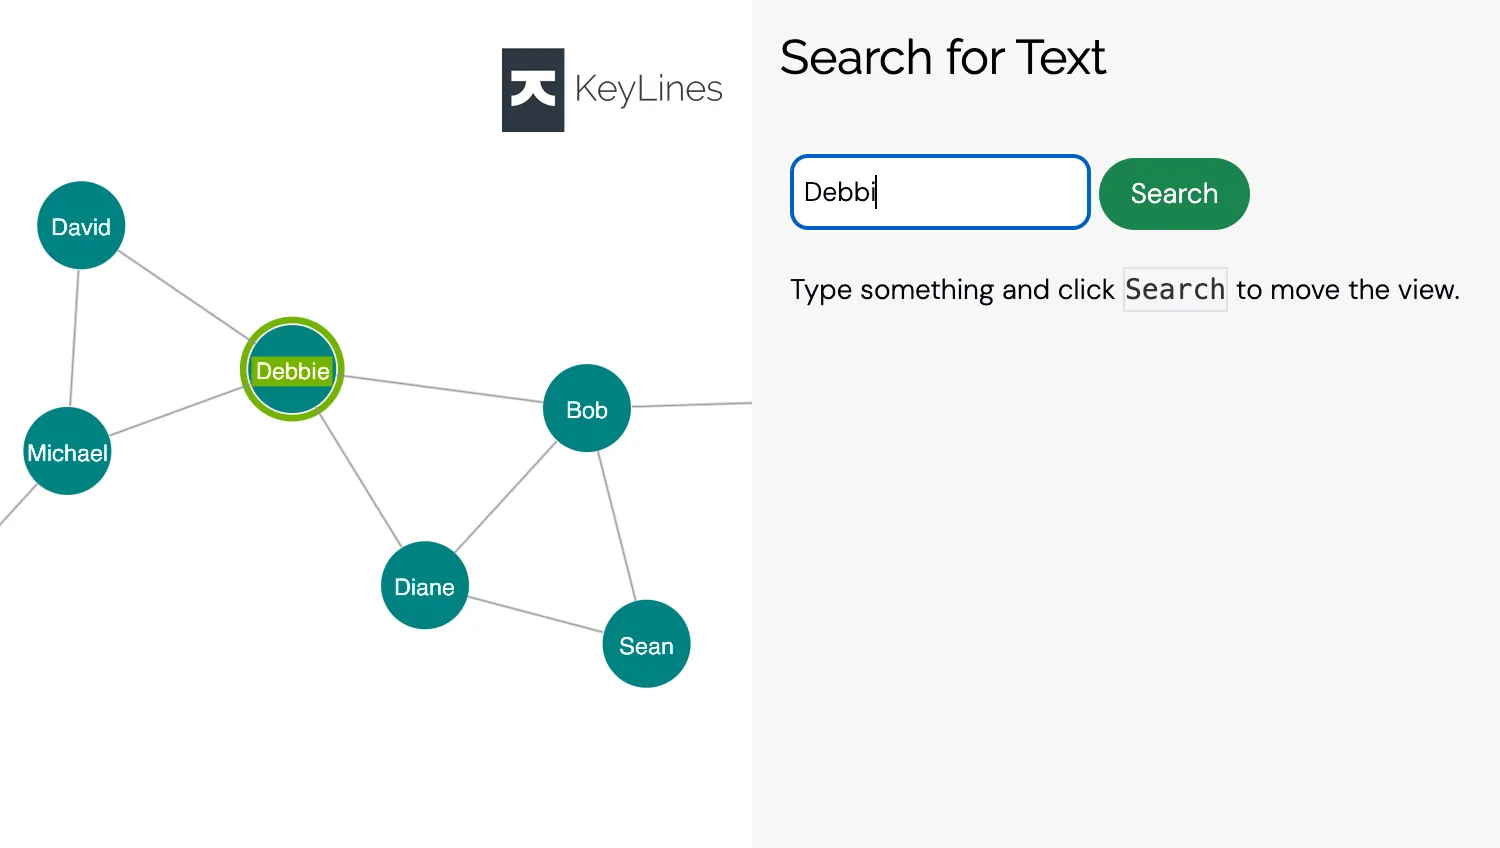
Search for Text
Search for text in a chart.
See example
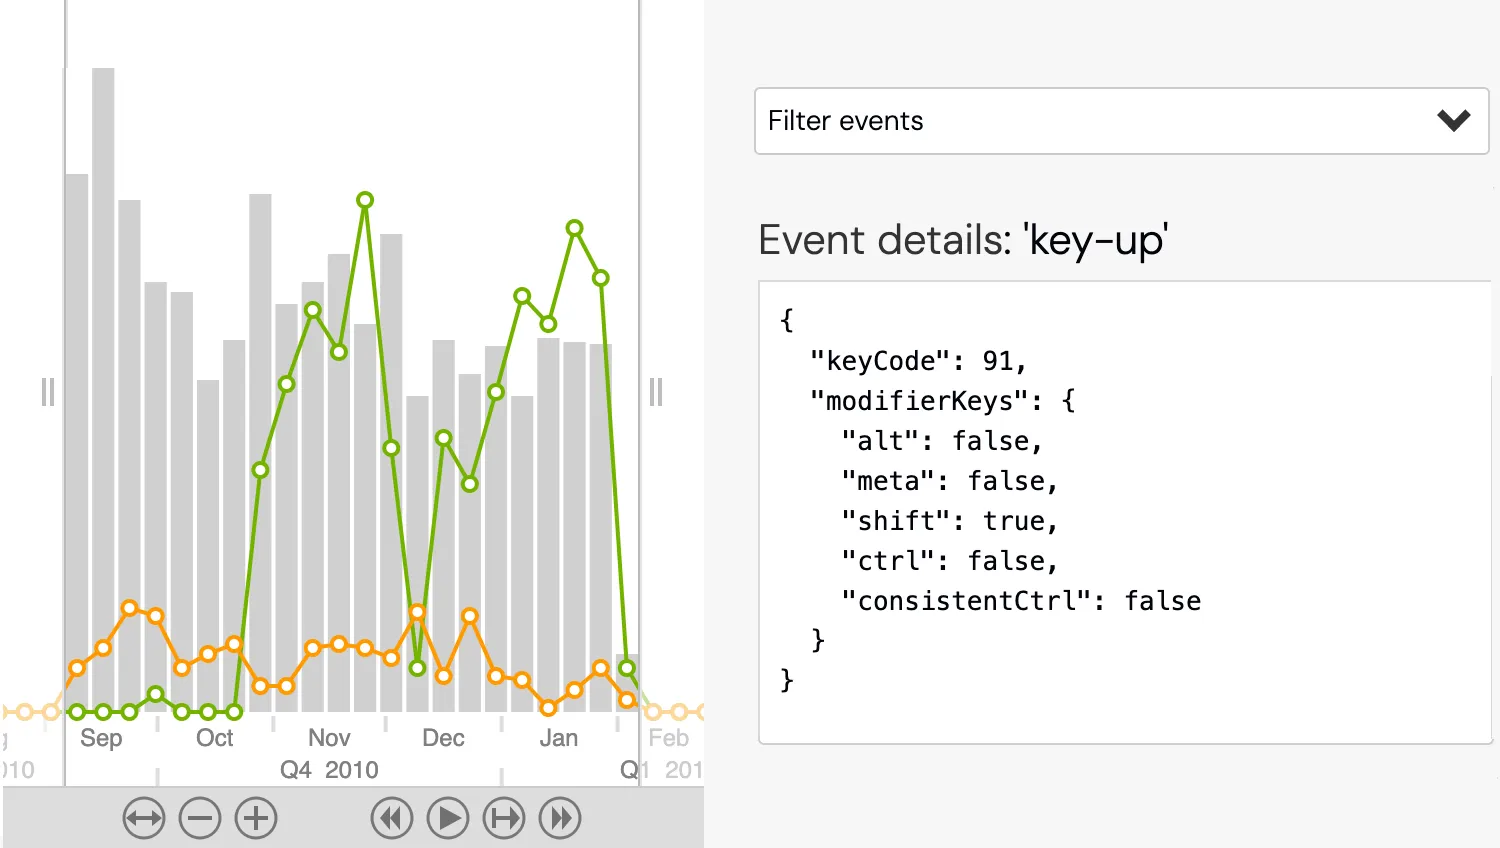
Time Bar Events
Interact with the time bar to explore keyboard, mouse and touch events.
See example
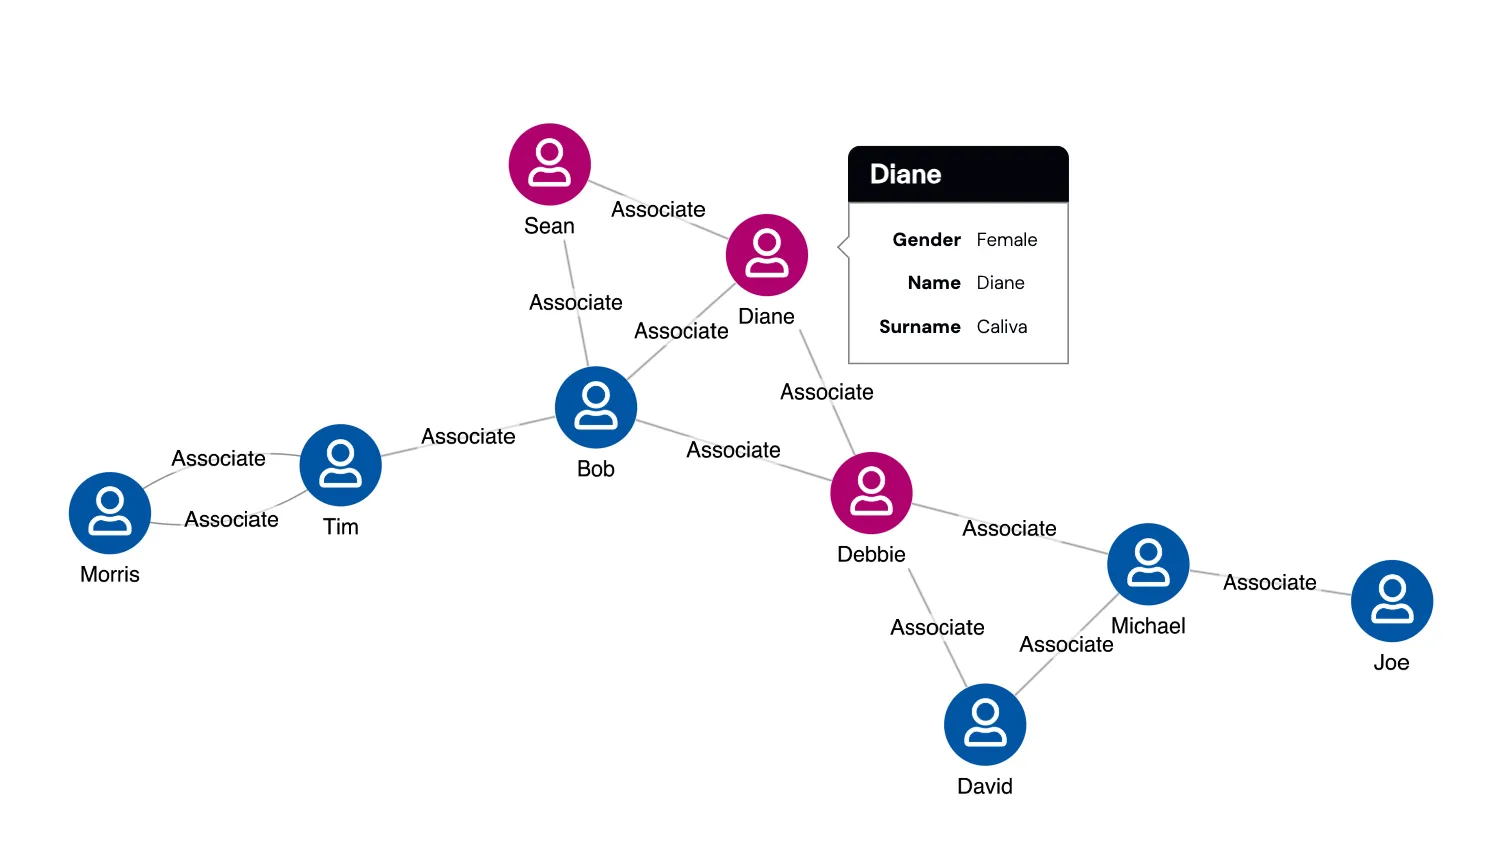
Tooltips on Items
Use tooltips to display useful information about nodes and links.
See example
Undo/Redo
Add a stack to give users unlimited undo/redo options.
See example
Layouts
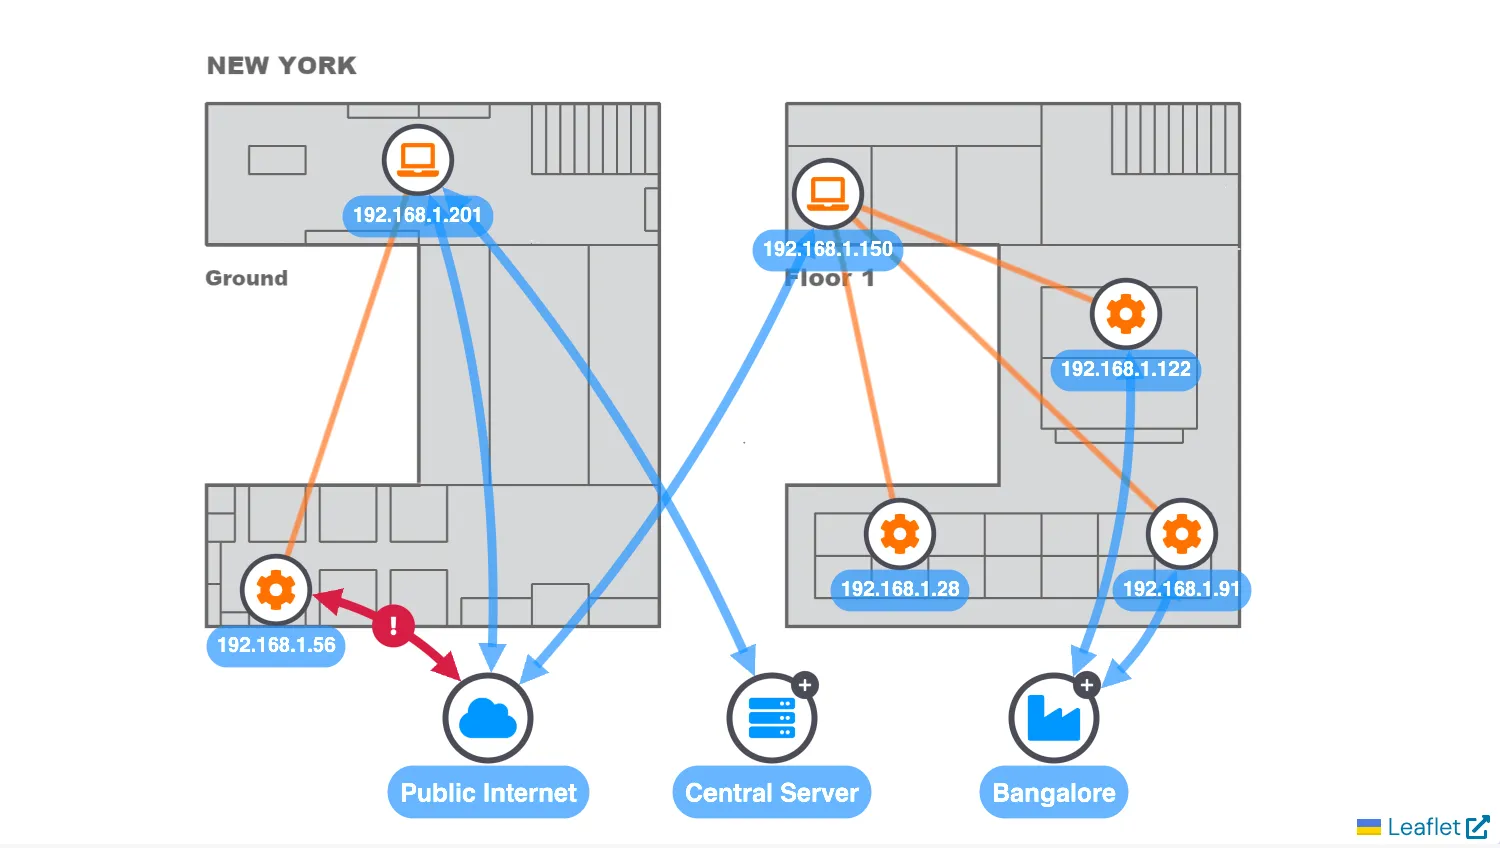
Using Images with Leaflet
Create floorplans or projections with images and CRS.
See example
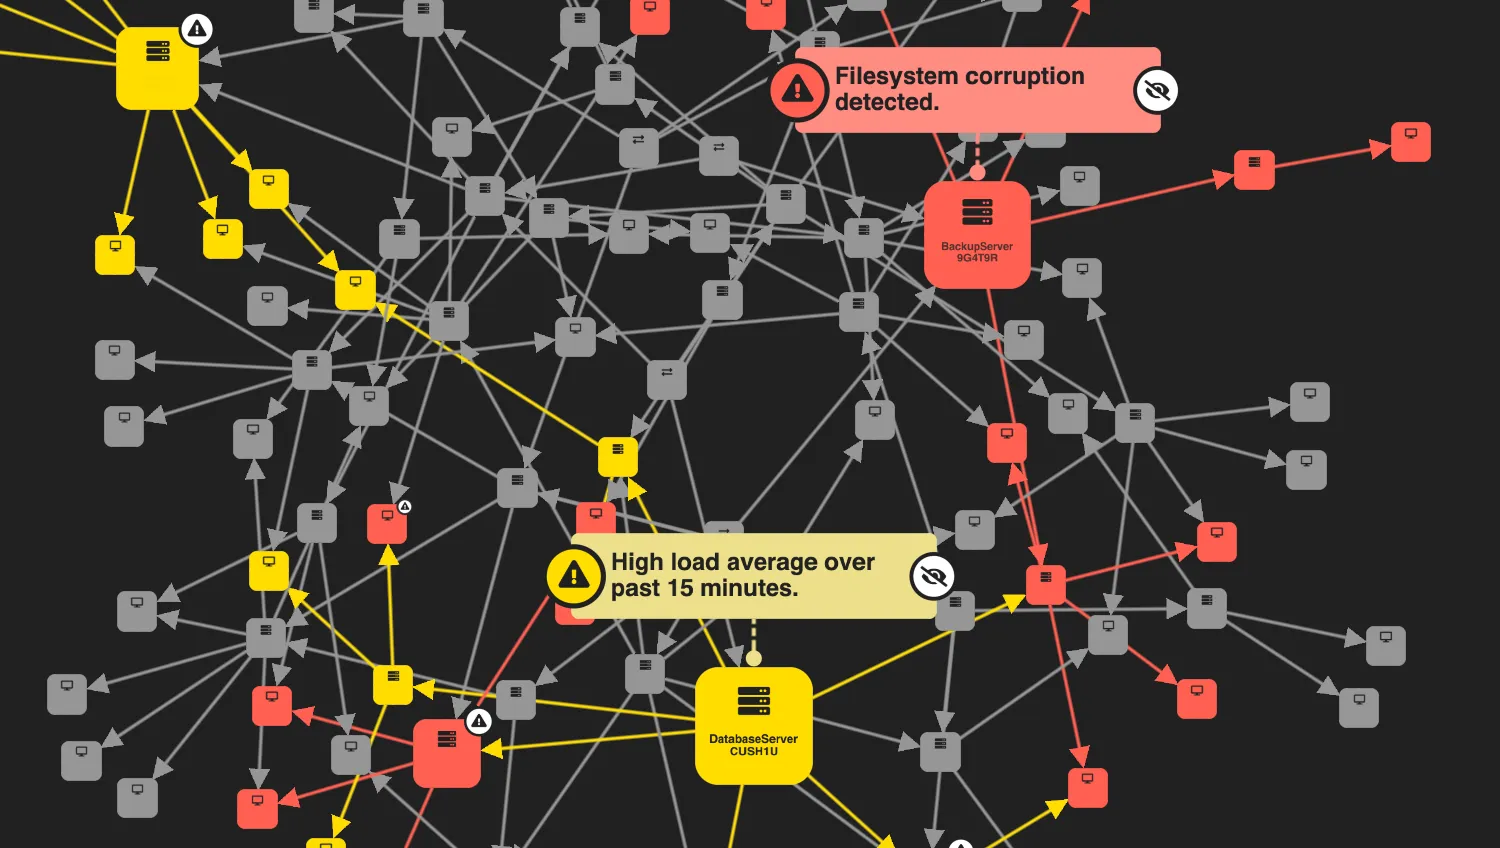
Impact Analysis
Reveal the dependencies and significance of nodes.
See example
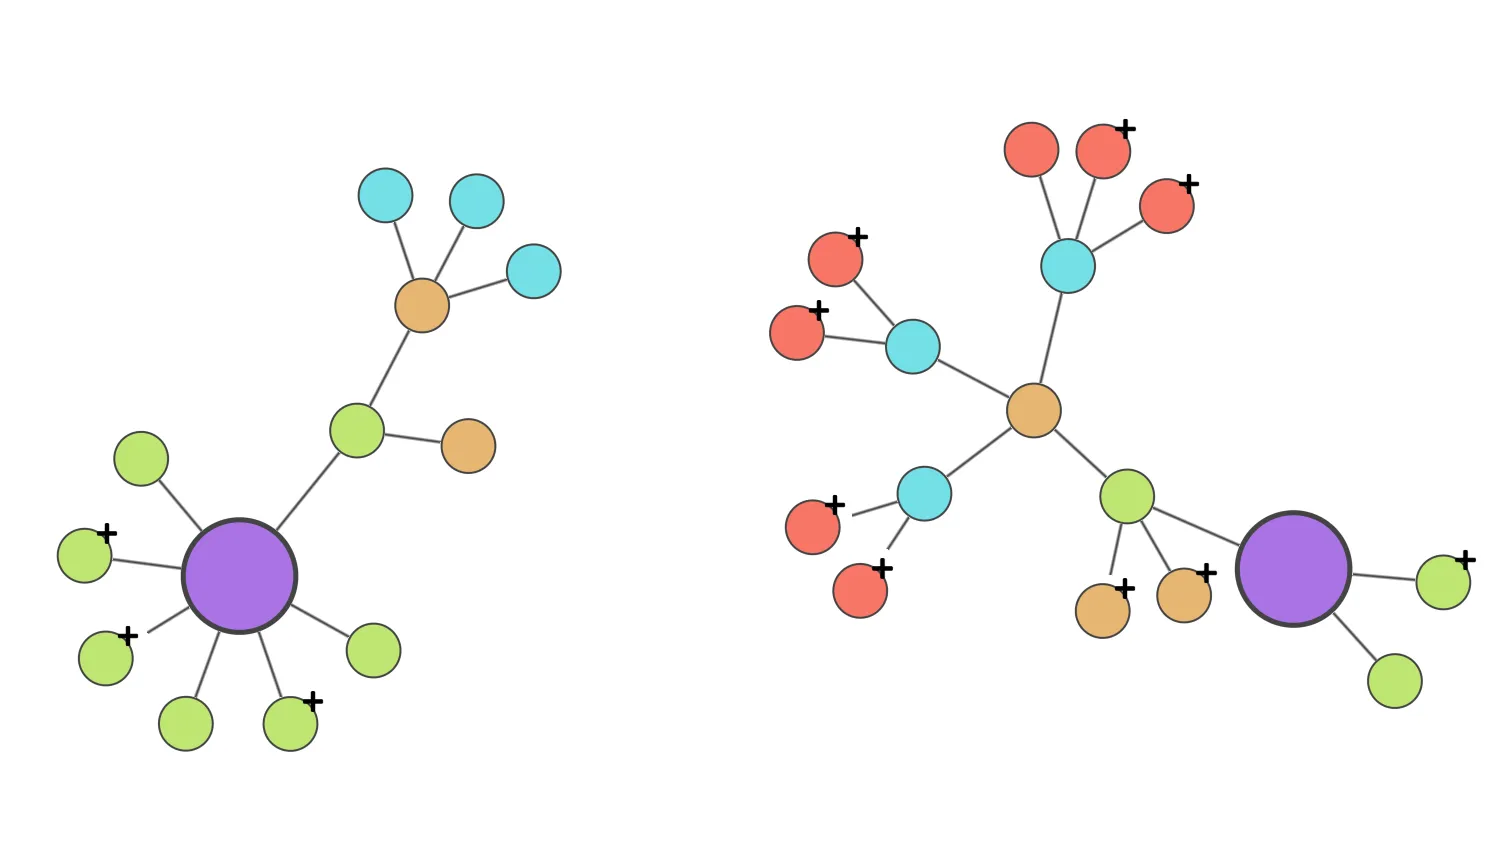
Adaptive Layouts
Expand existing nodes to reveal new connections.
See example
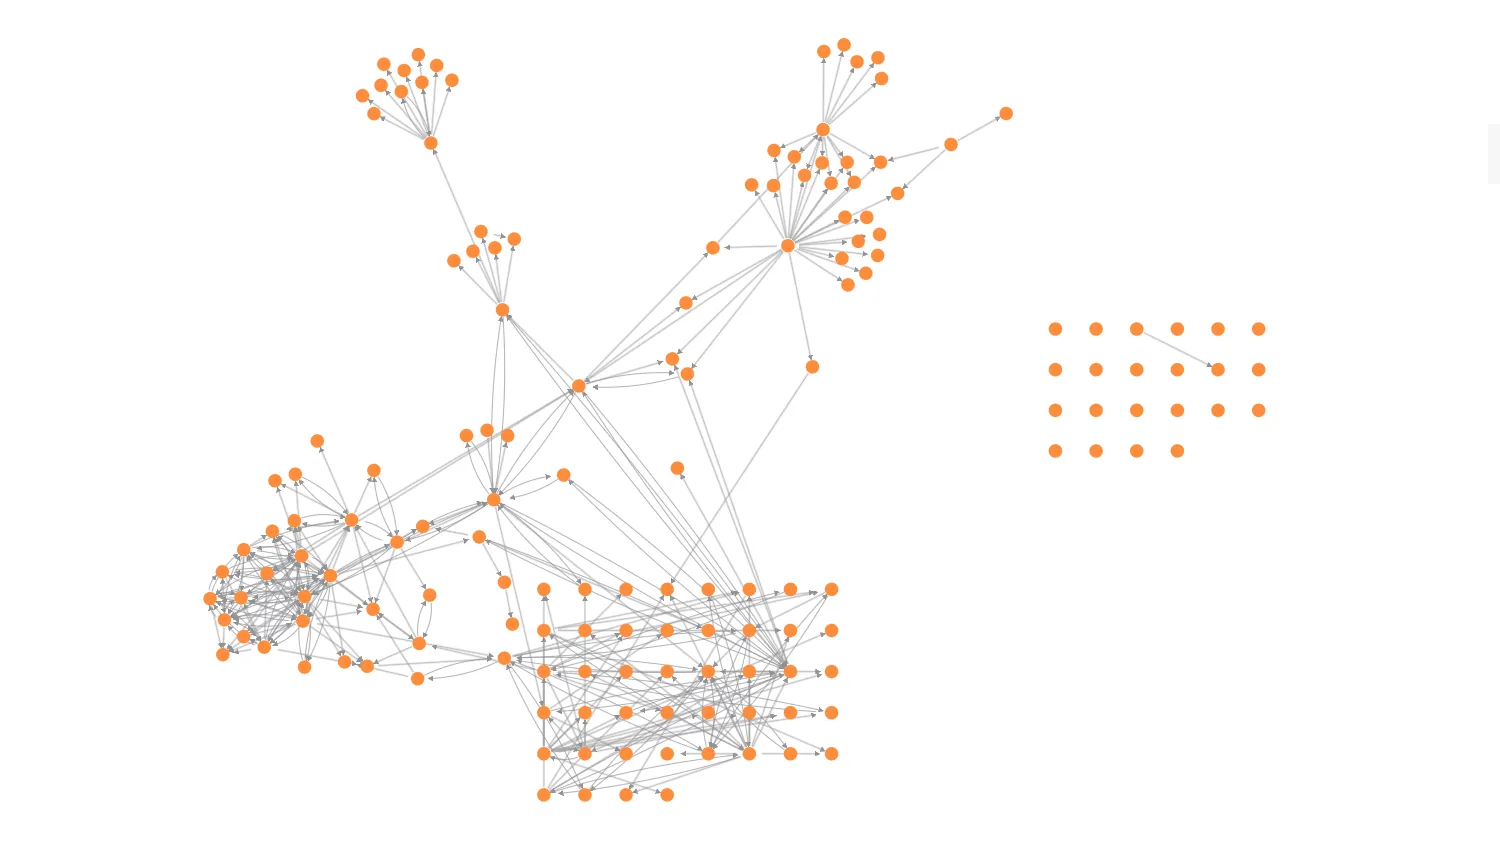
Arrange Items
Rearrange selected nodes to improve clarity.
See example
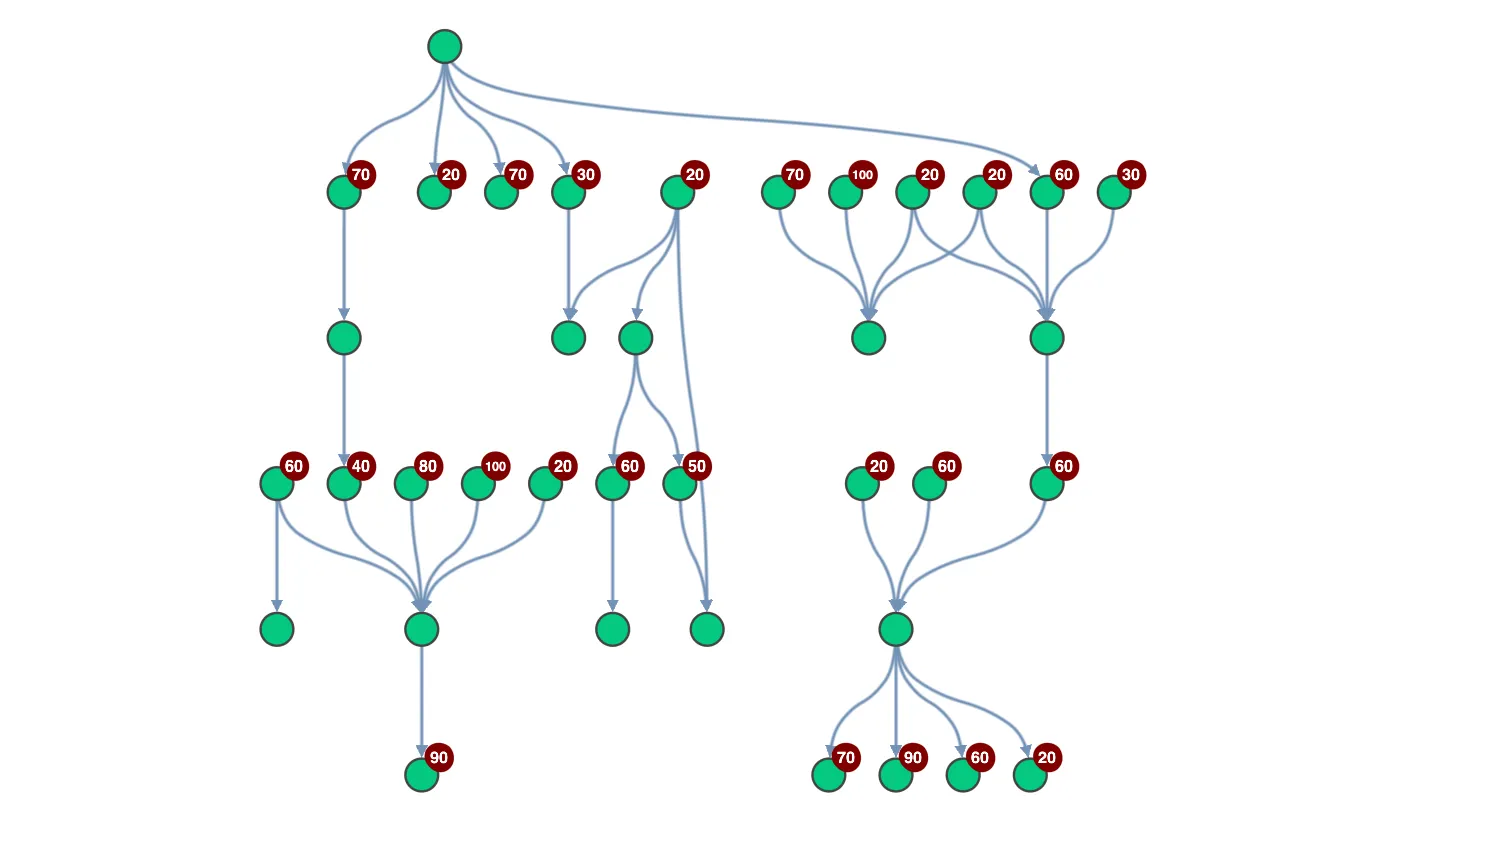
Display Hierarchies
Work with data spanning multiple levels.
See example
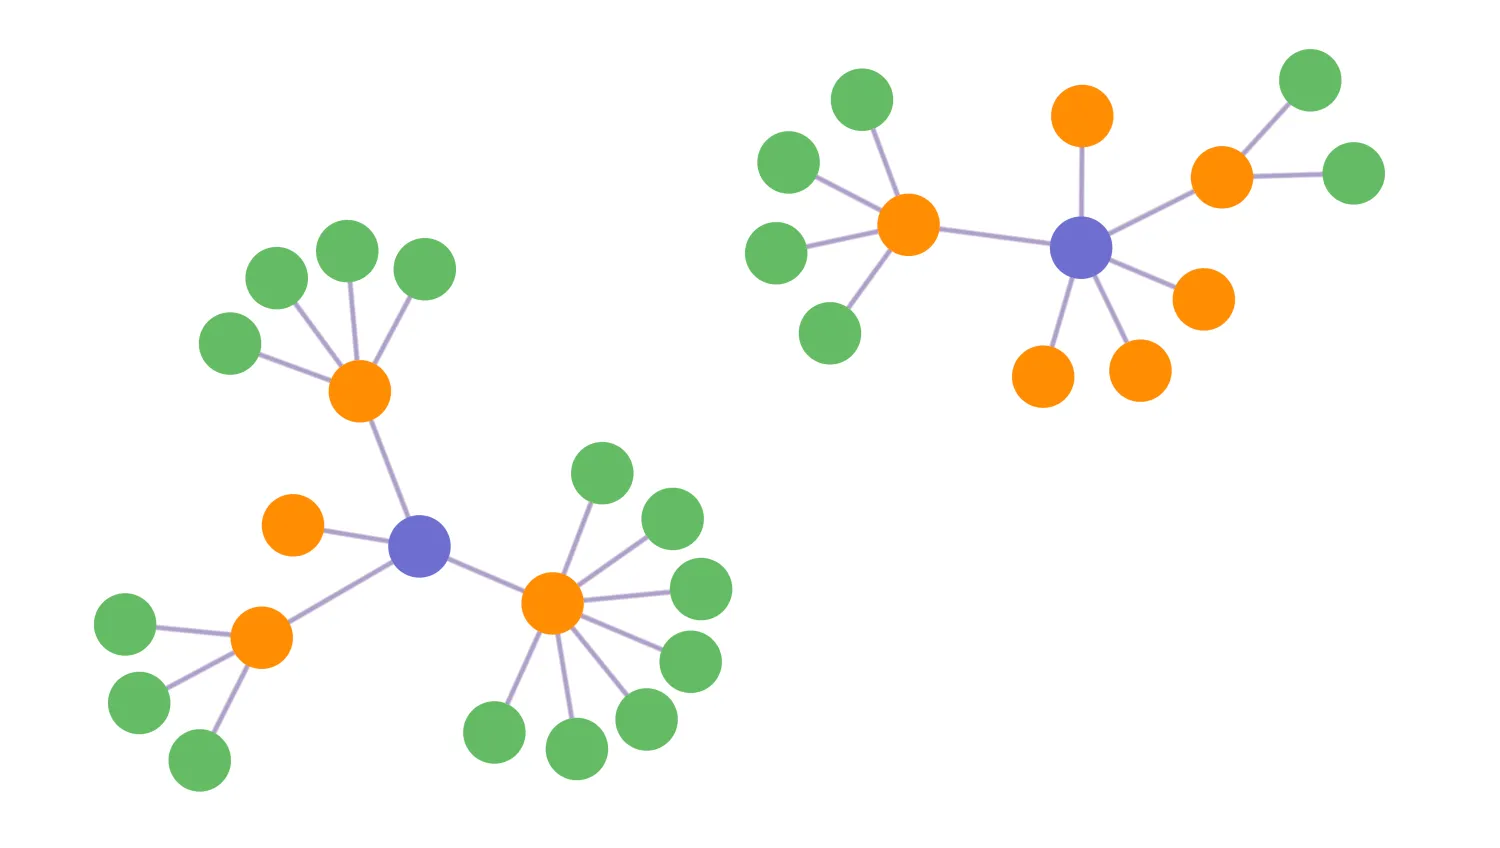
Layouts
Explore different layout options for displaying data.
See example
Combos
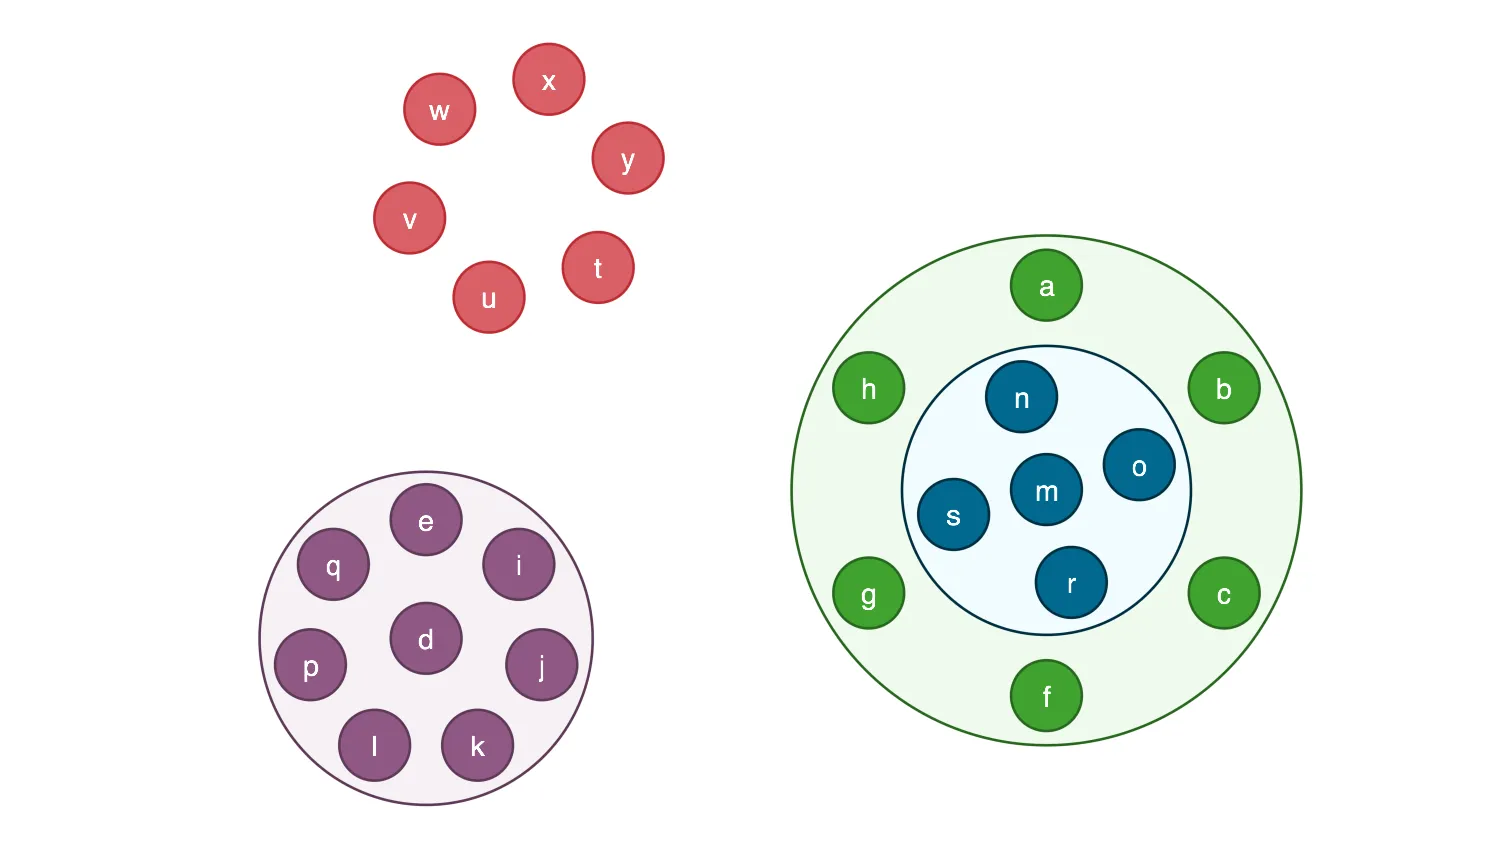
Combo Dragging
Drag items to and from combos.
See example
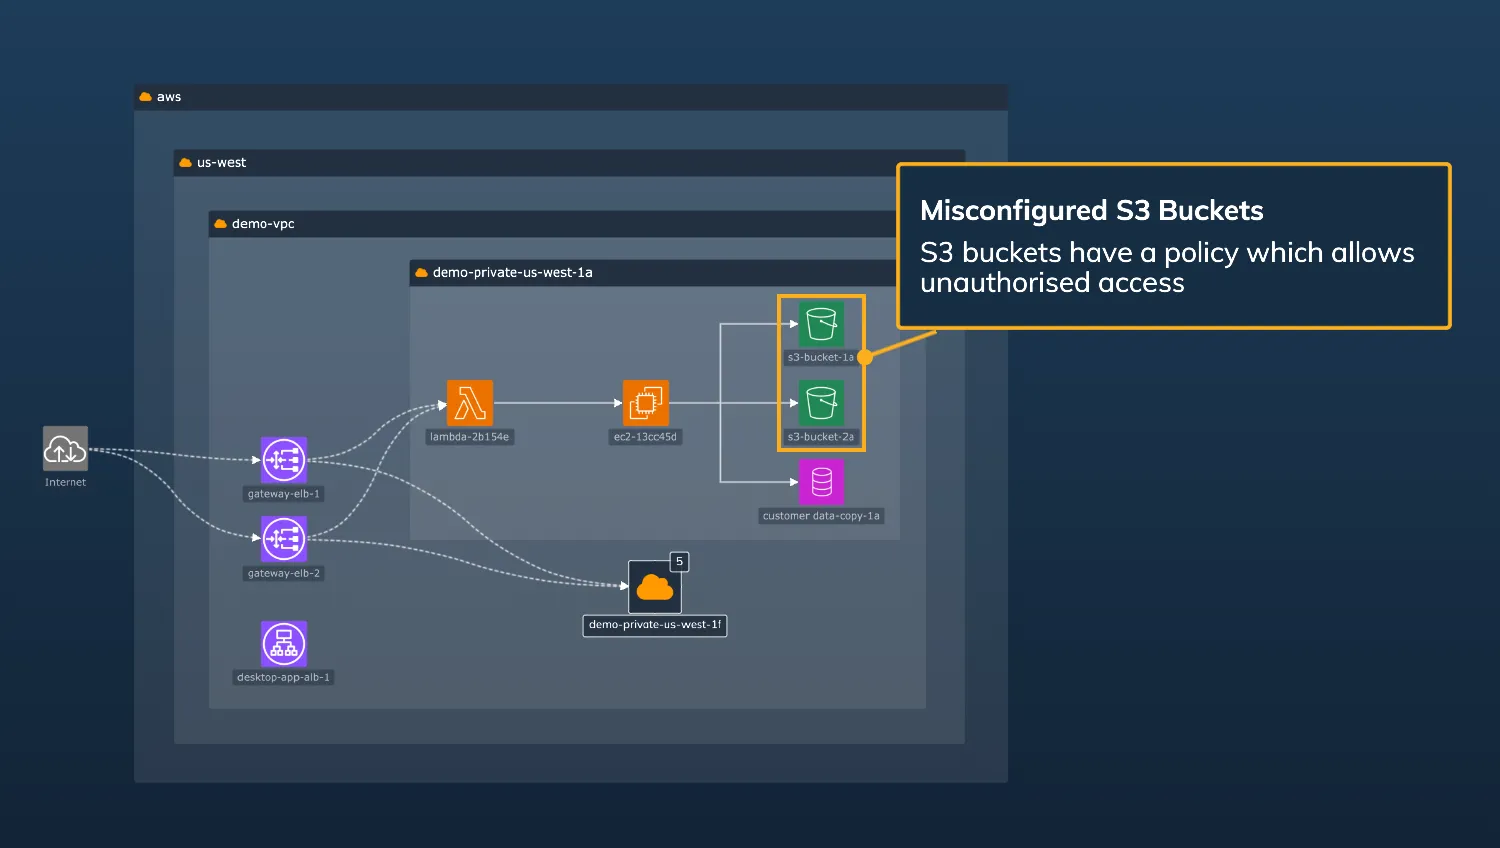
Cloud Security
Explore attack paths and alerts on a cloud infrastructure.
See example
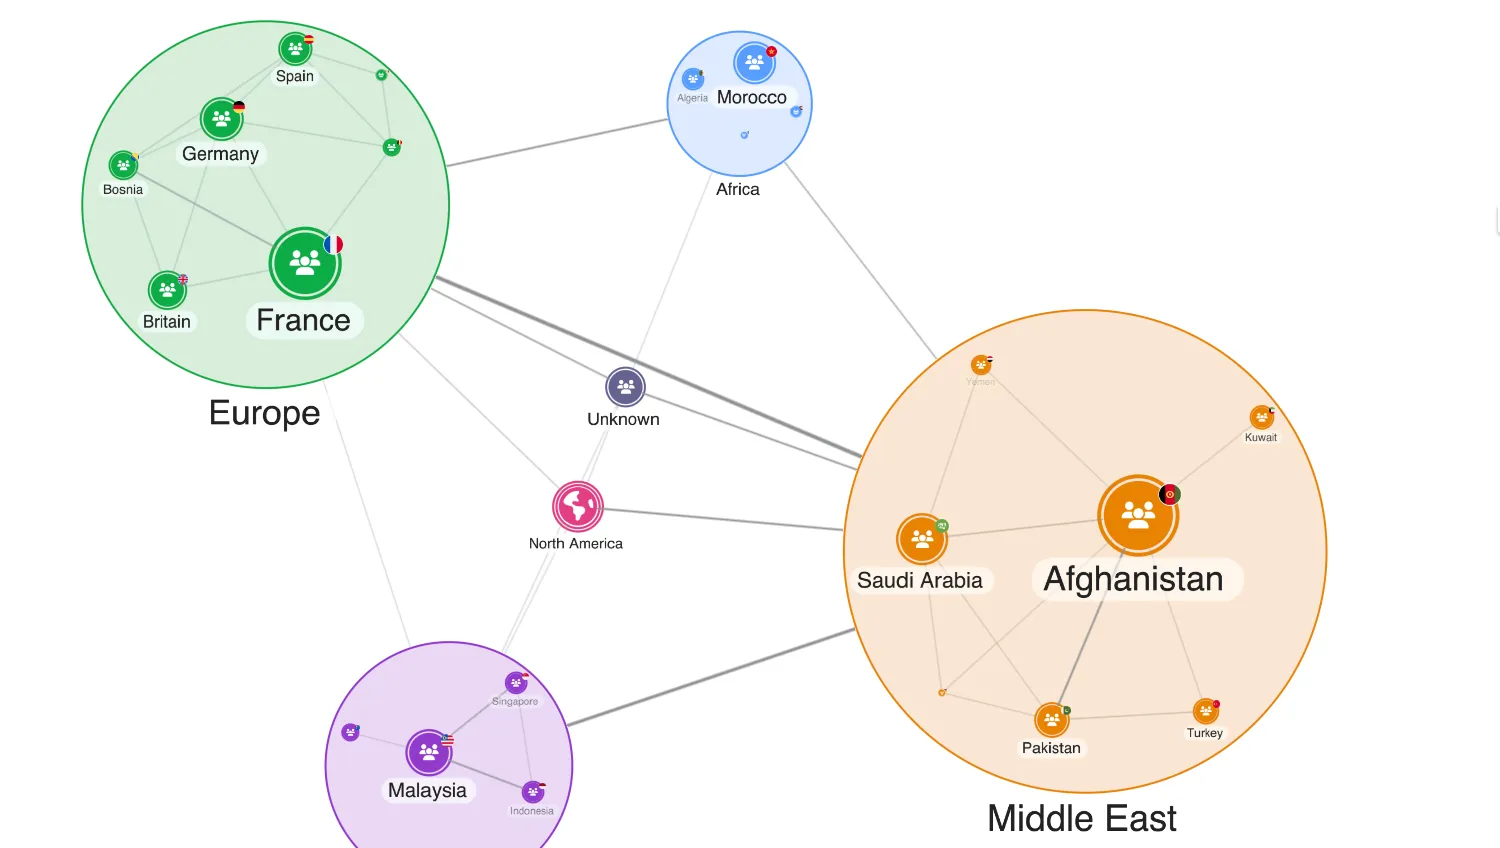
Combining Nodes
Combine nodes to reveal patterns in complex networks.
See example
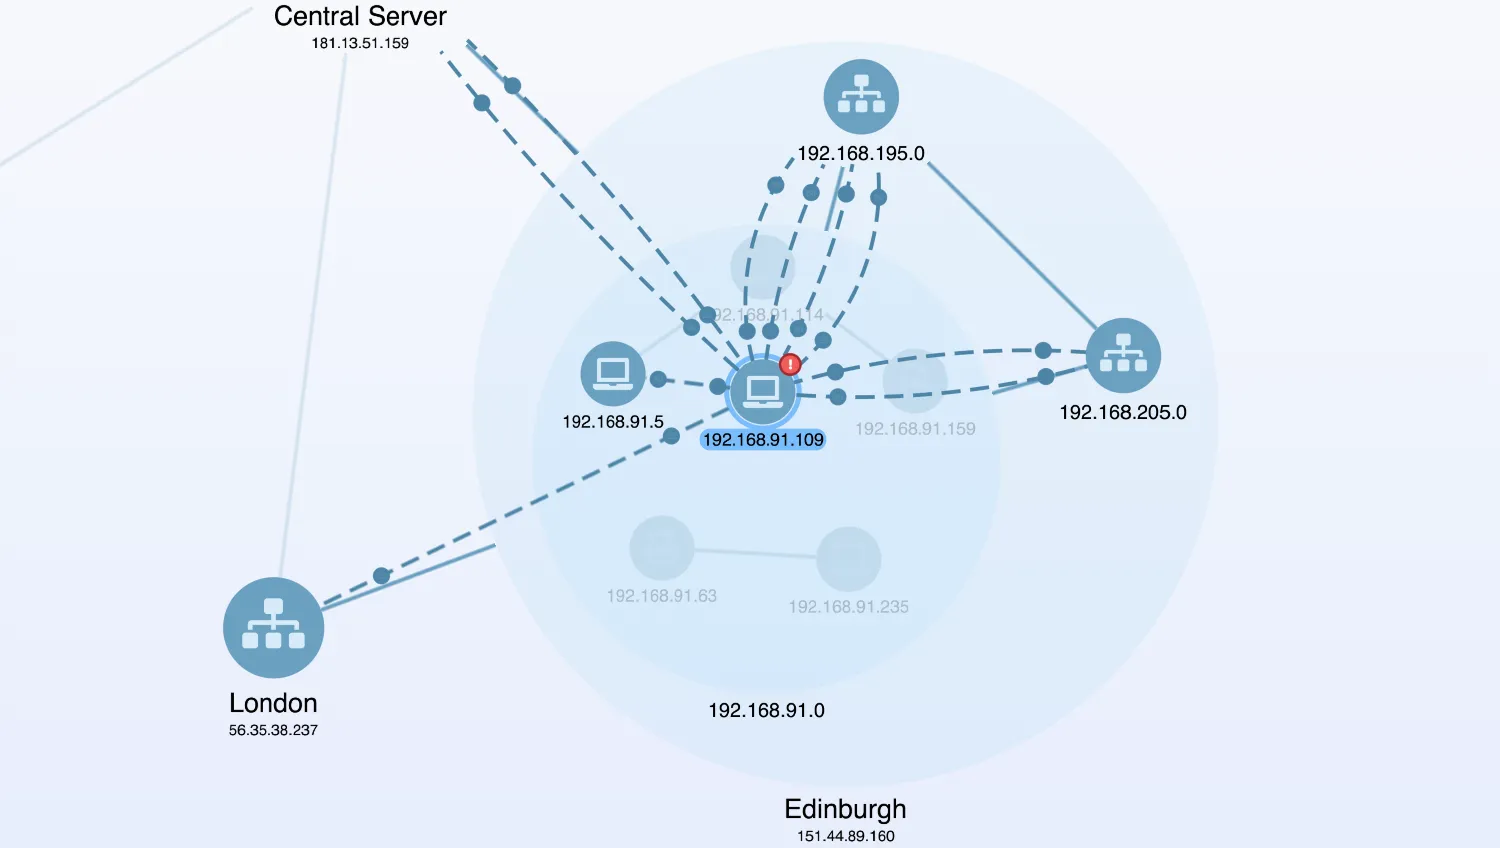
Network Alerts
Help users identify and understand alerts in your networks.
See example
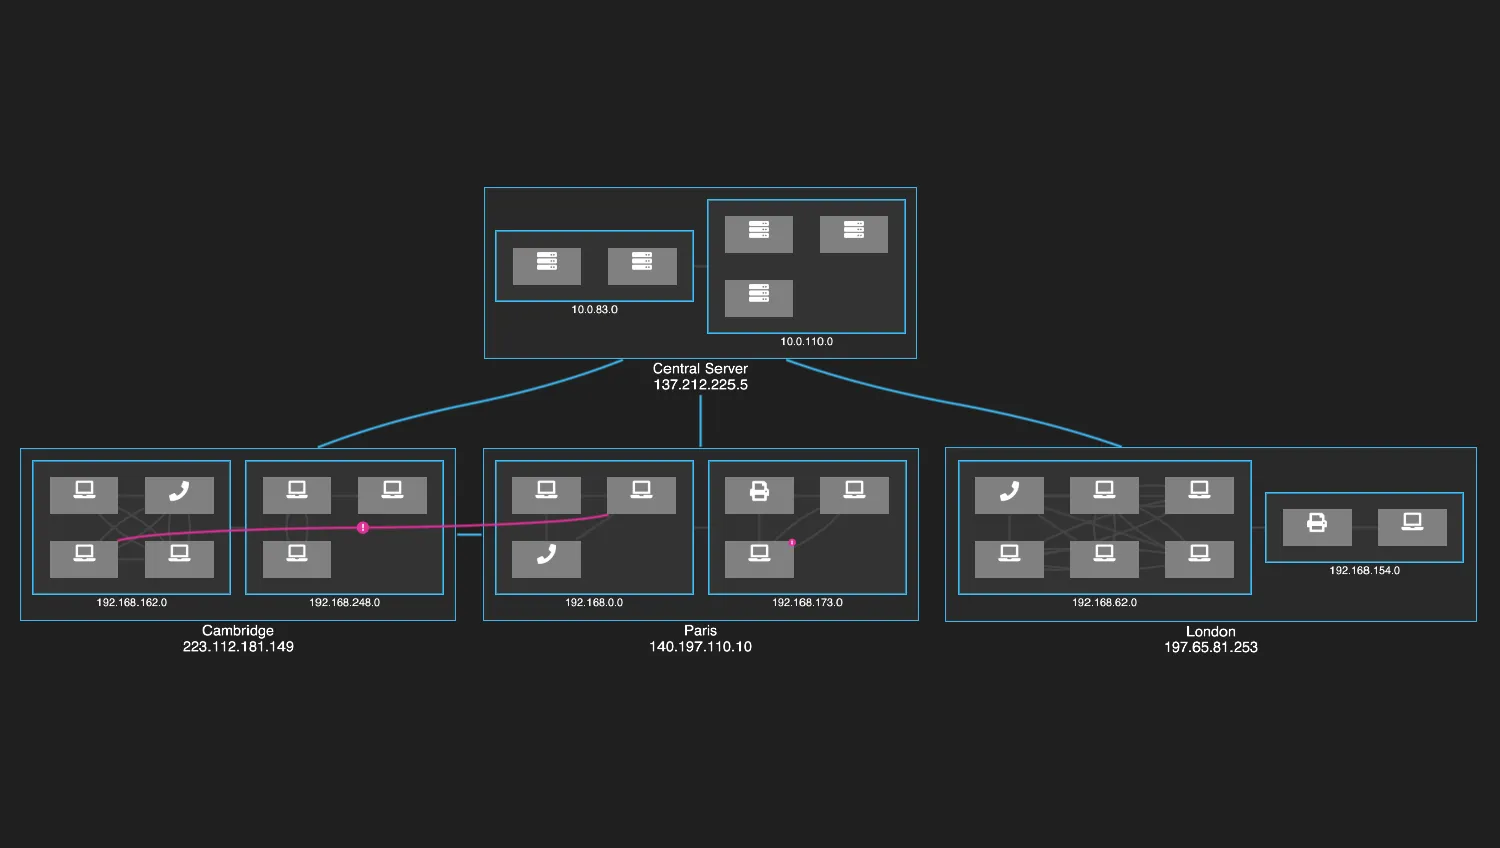
Arranging IT Networks
Use rectangular combos to visualise IT networks.
See example
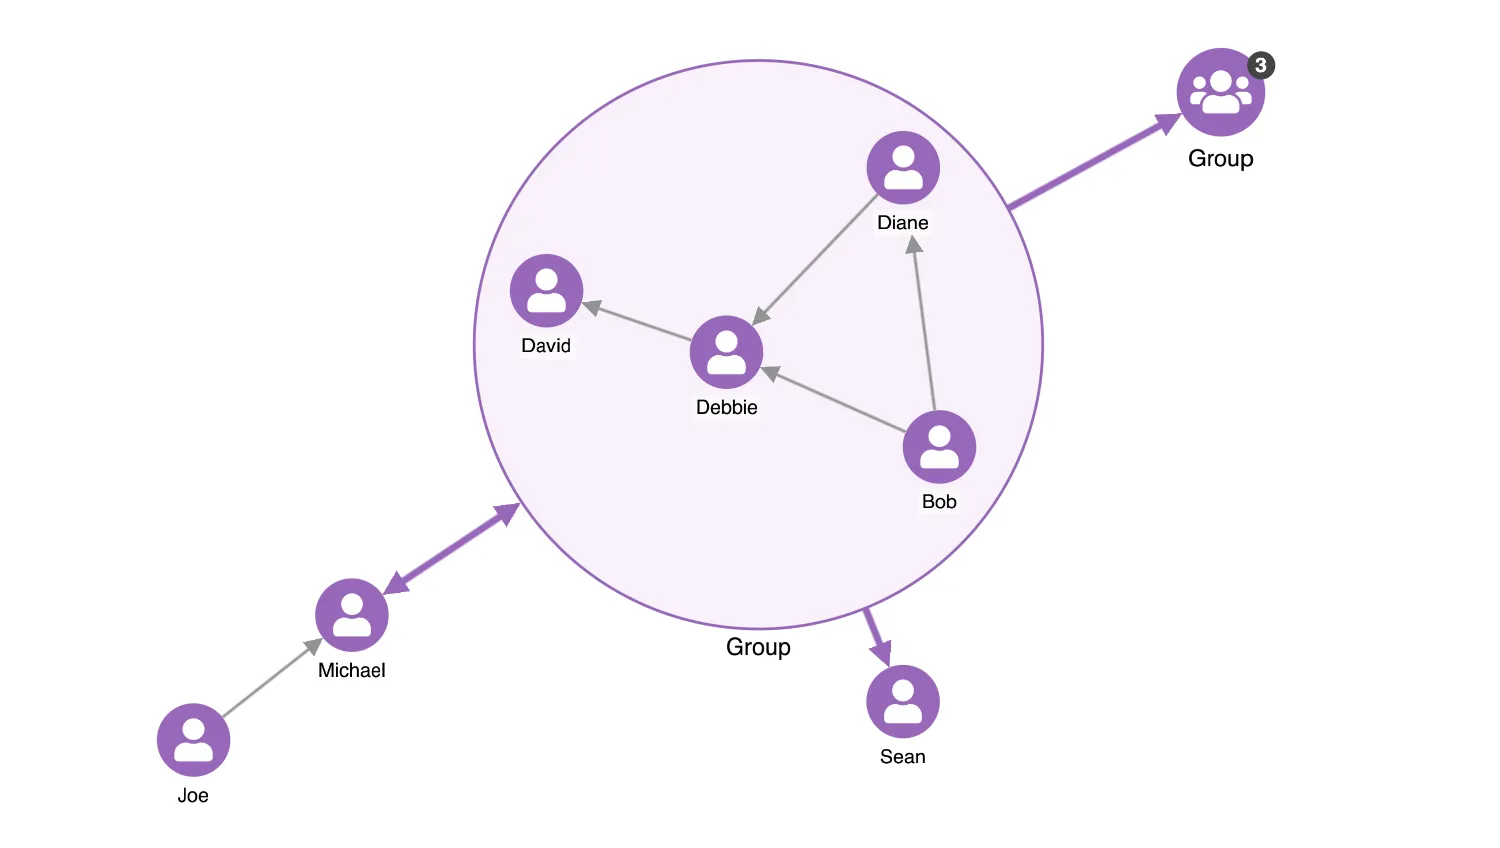
Combo Options
Combine similar nodes to simplify networks.
See example
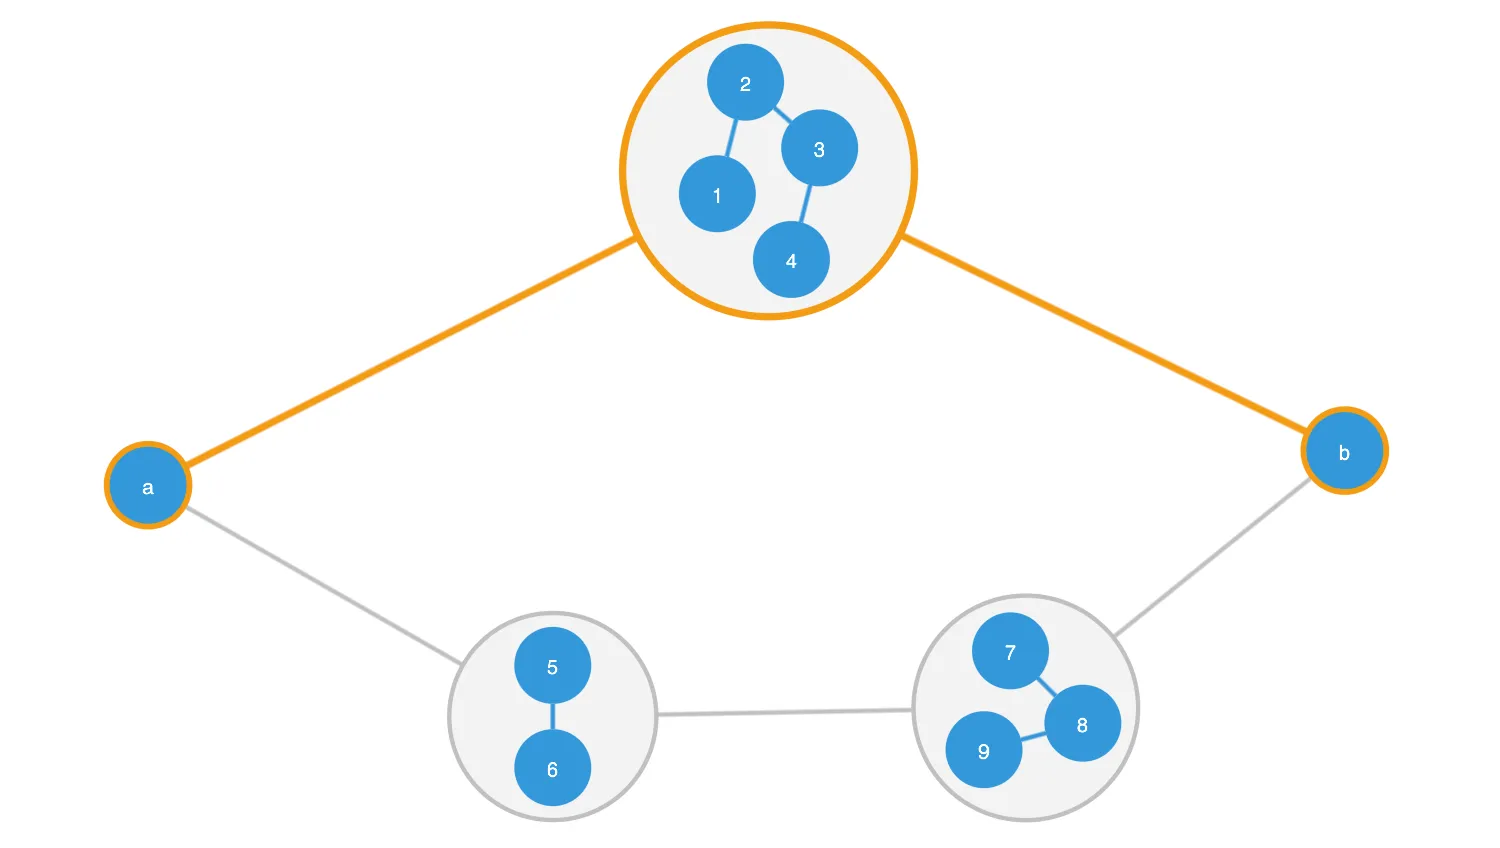
Combos: Find Paths
Explore how combos affect paths between nodes.
See example
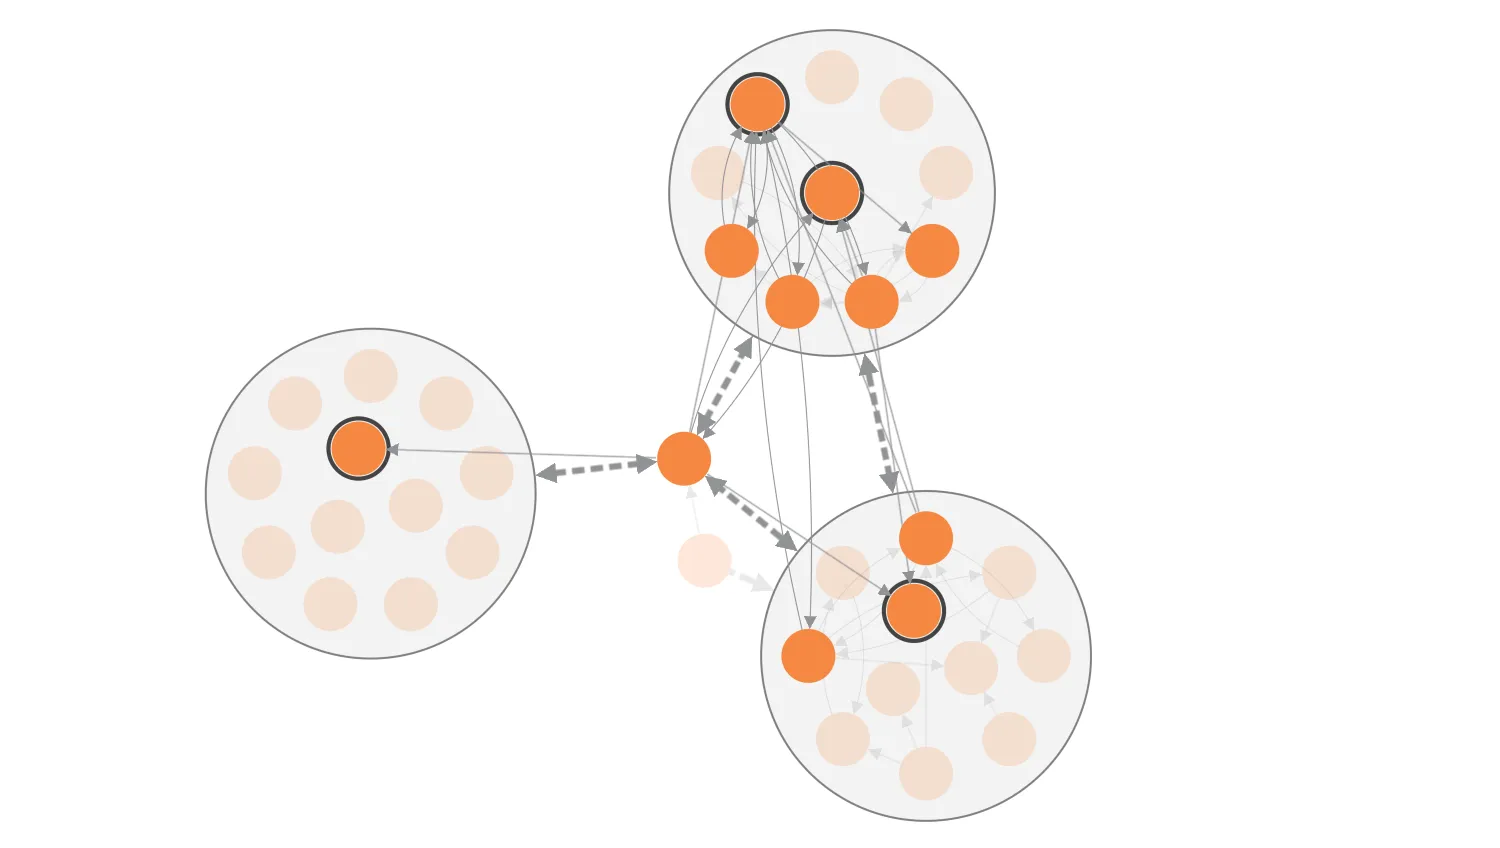
Combos: Reveal Links
Reveal underlying links between combos.
See example
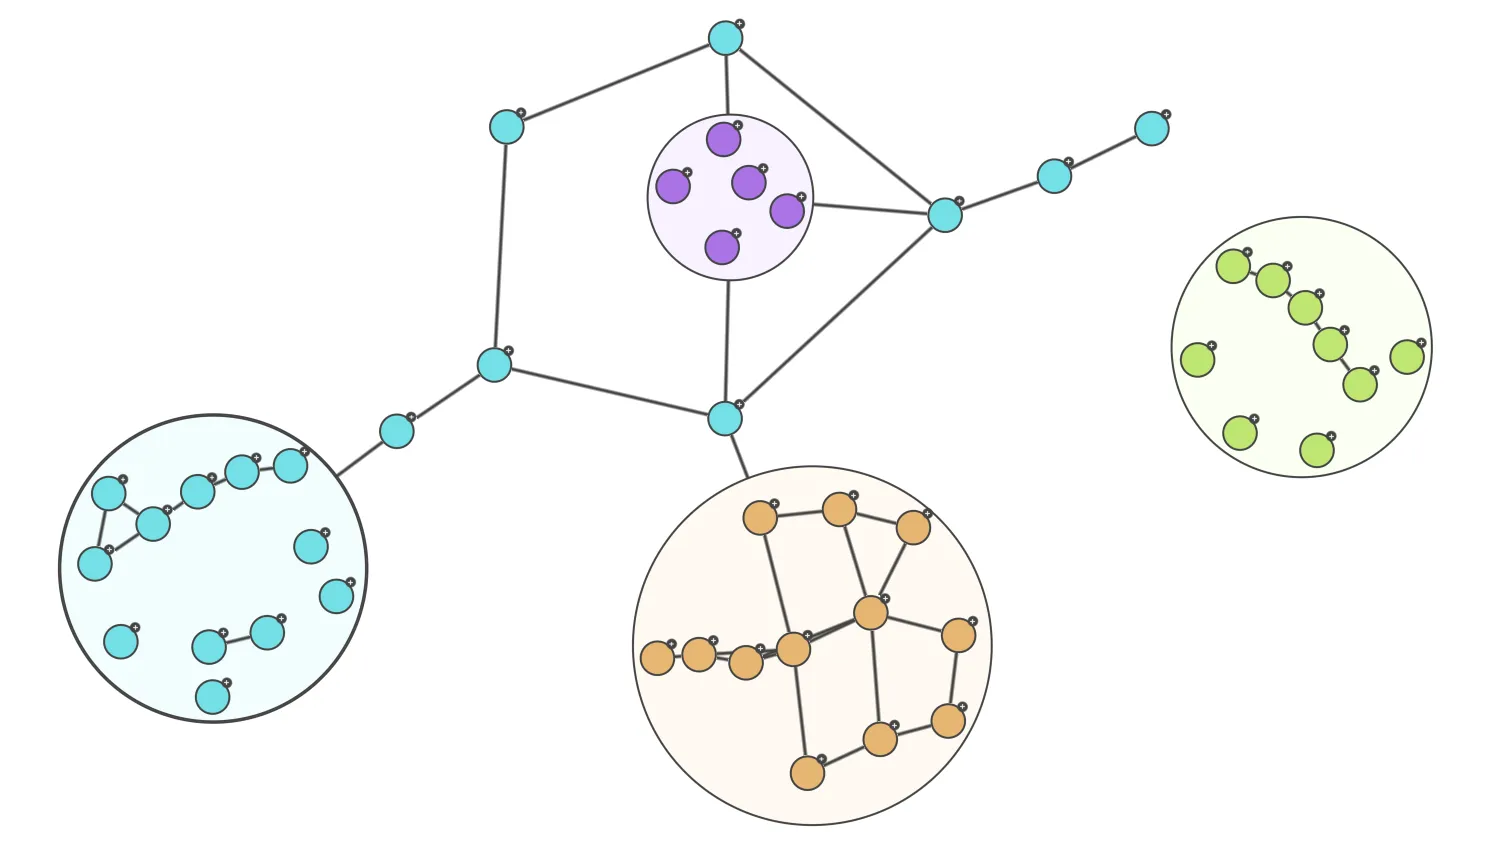
Load Data into Combos
Populate the contents of combos on demand.
See example
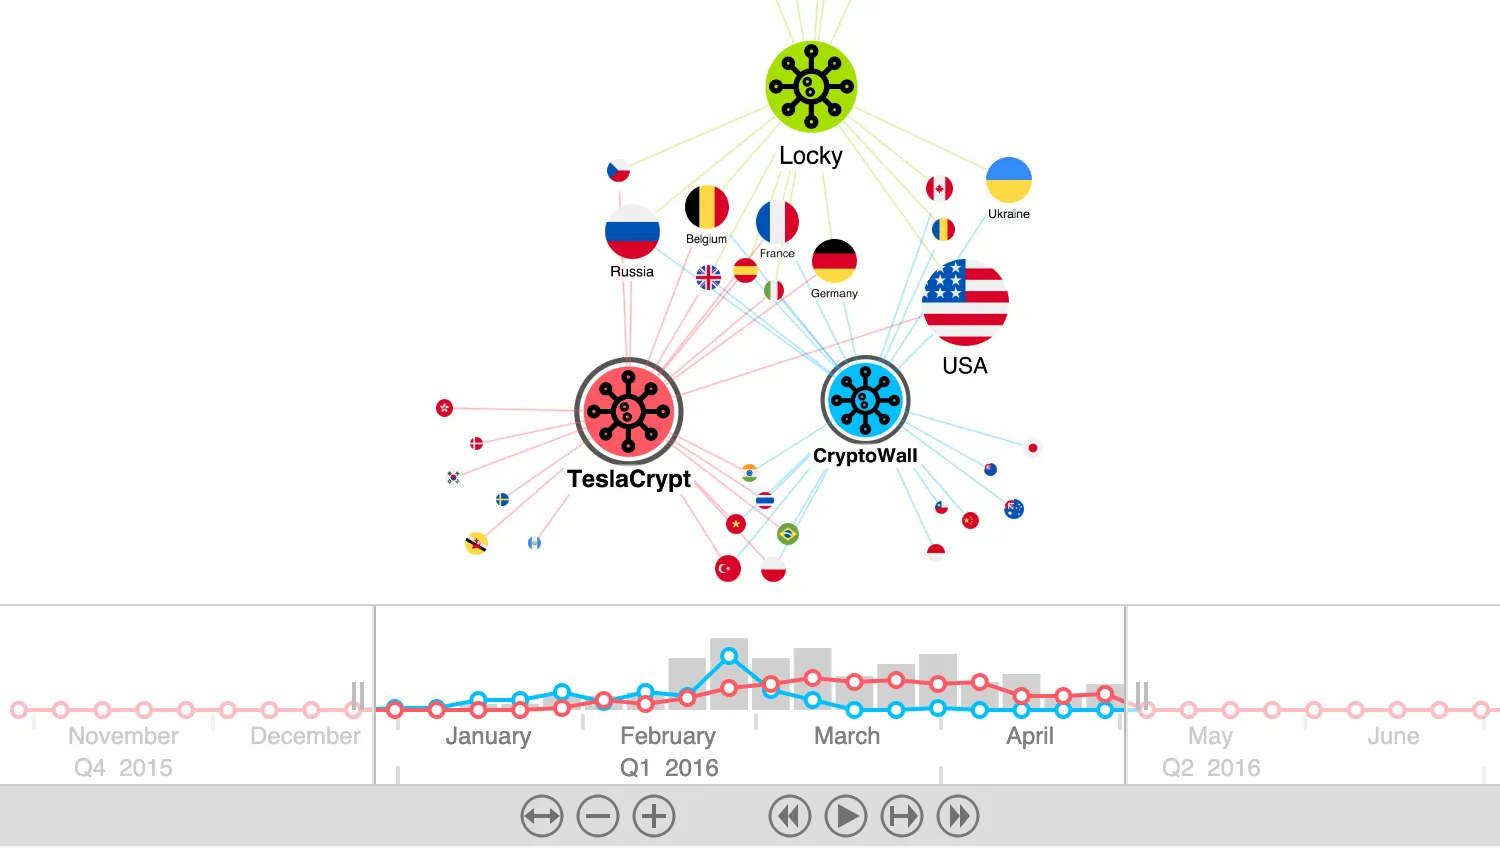
Ransomware Attacks
Explore the source and distribution of ransomware attacks over time.
See example
Filtering
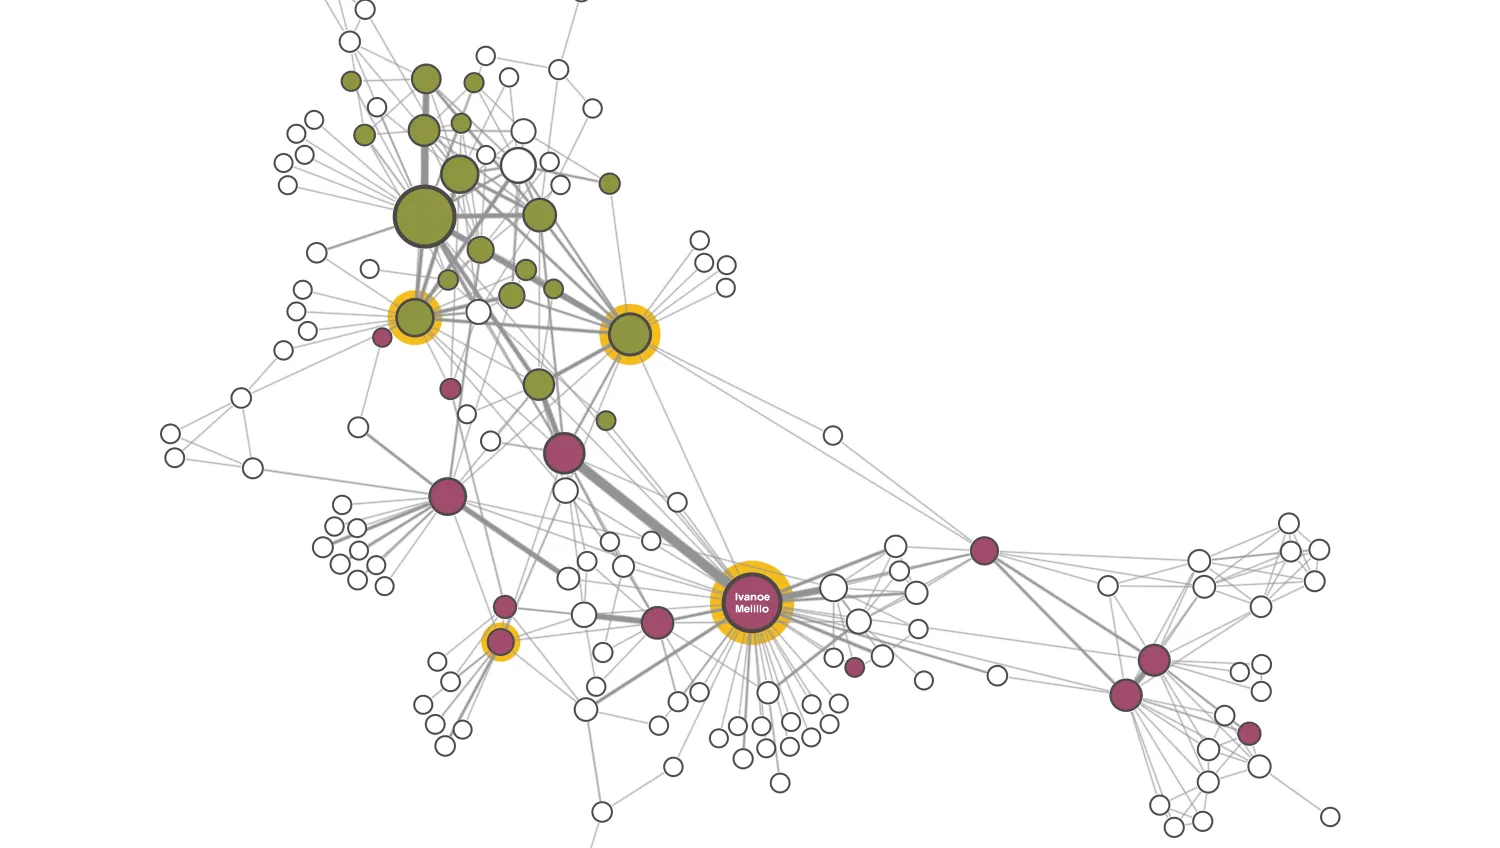
Mafia Network
Disrupt a resilient mafia network through social network analysis.
See example
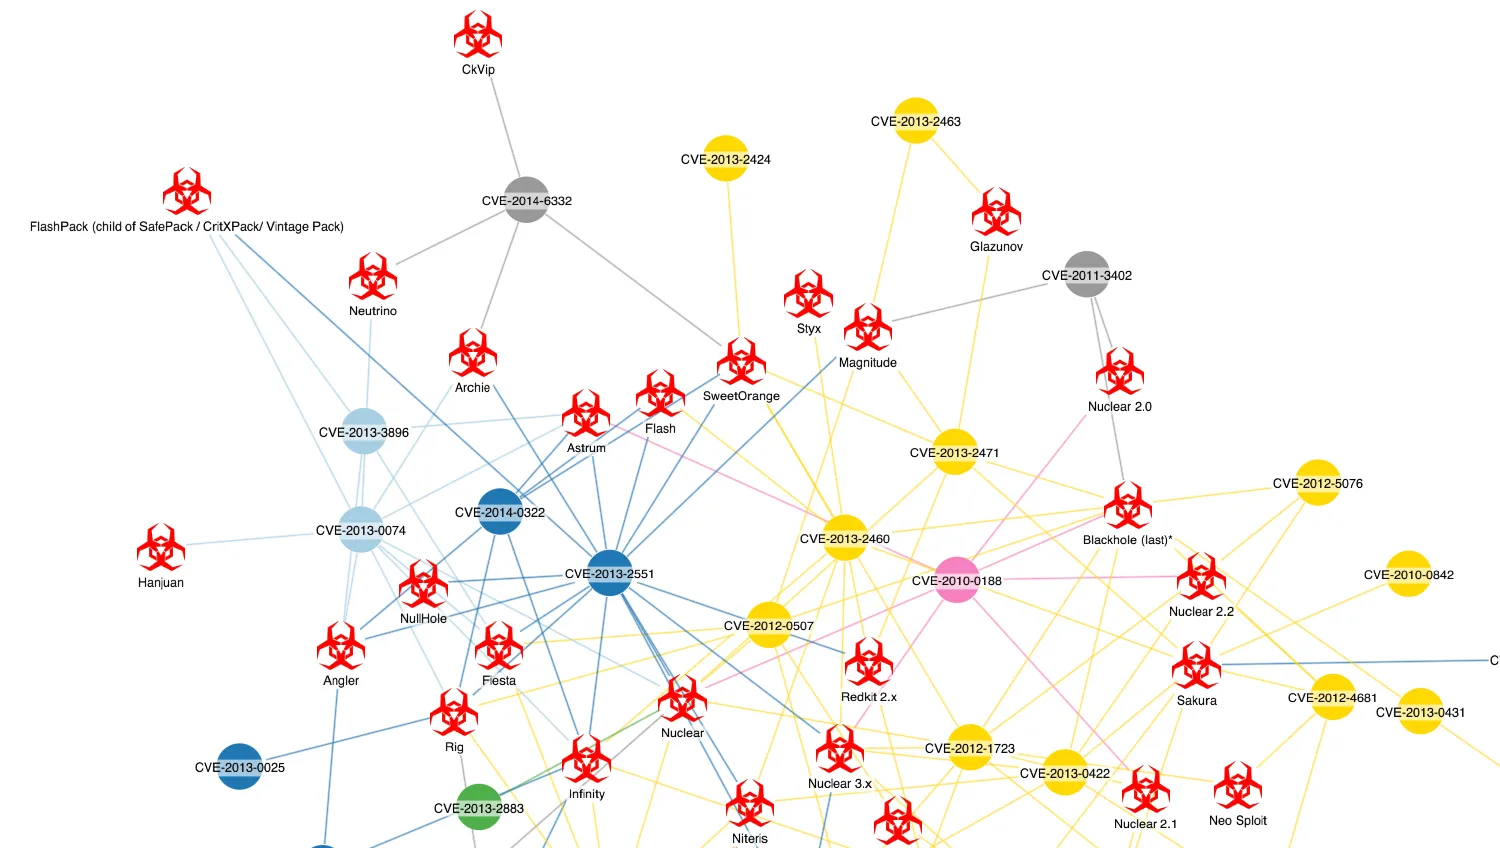
Filtering Basics
Explore relations between malware and their vulnerabilities.
See example
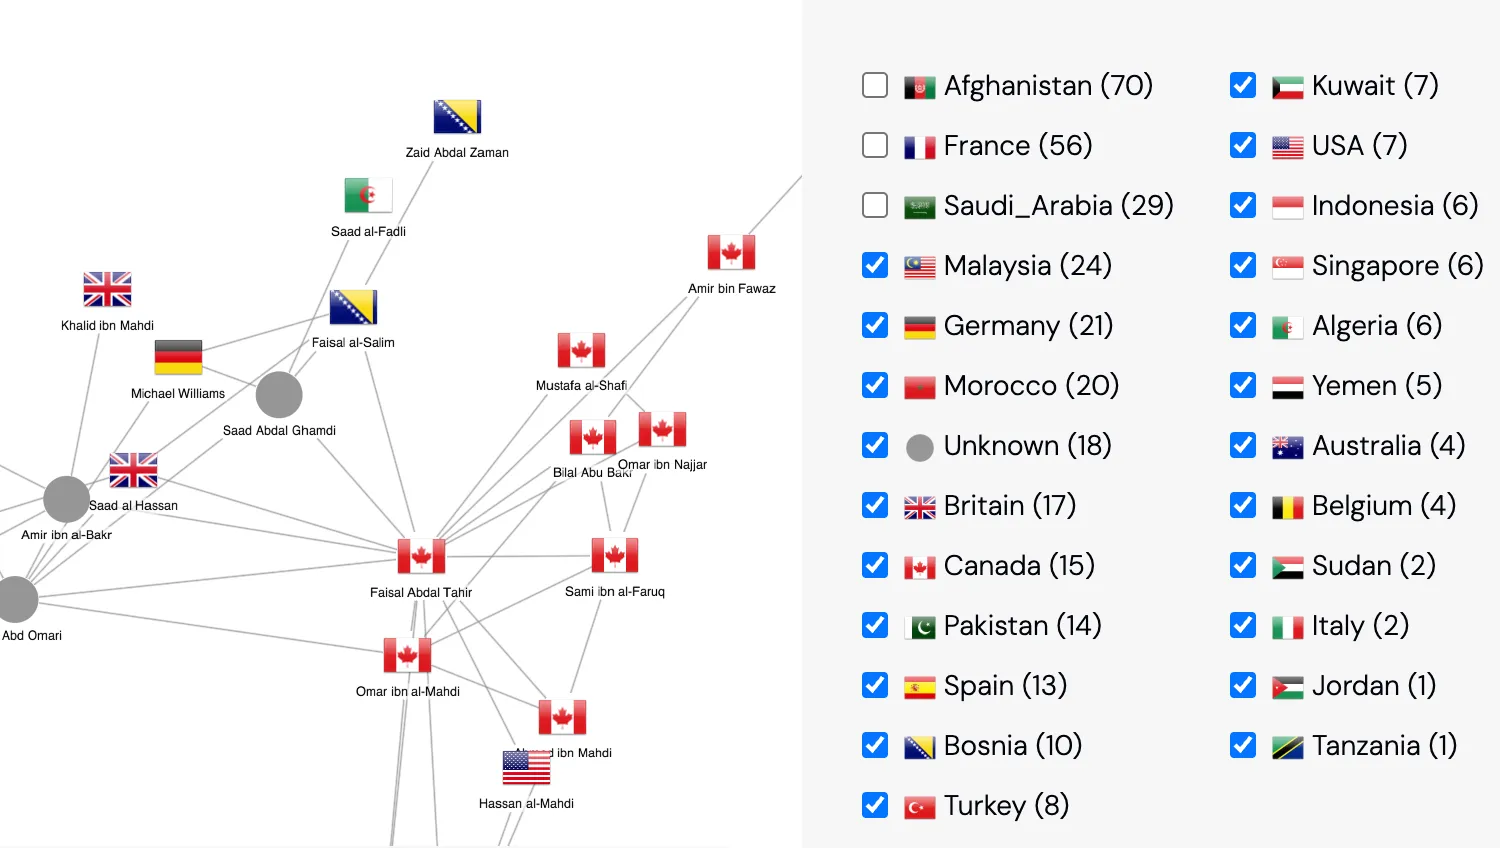
Filtering and kCores
Use combinations of filters to simplify networks.
See example
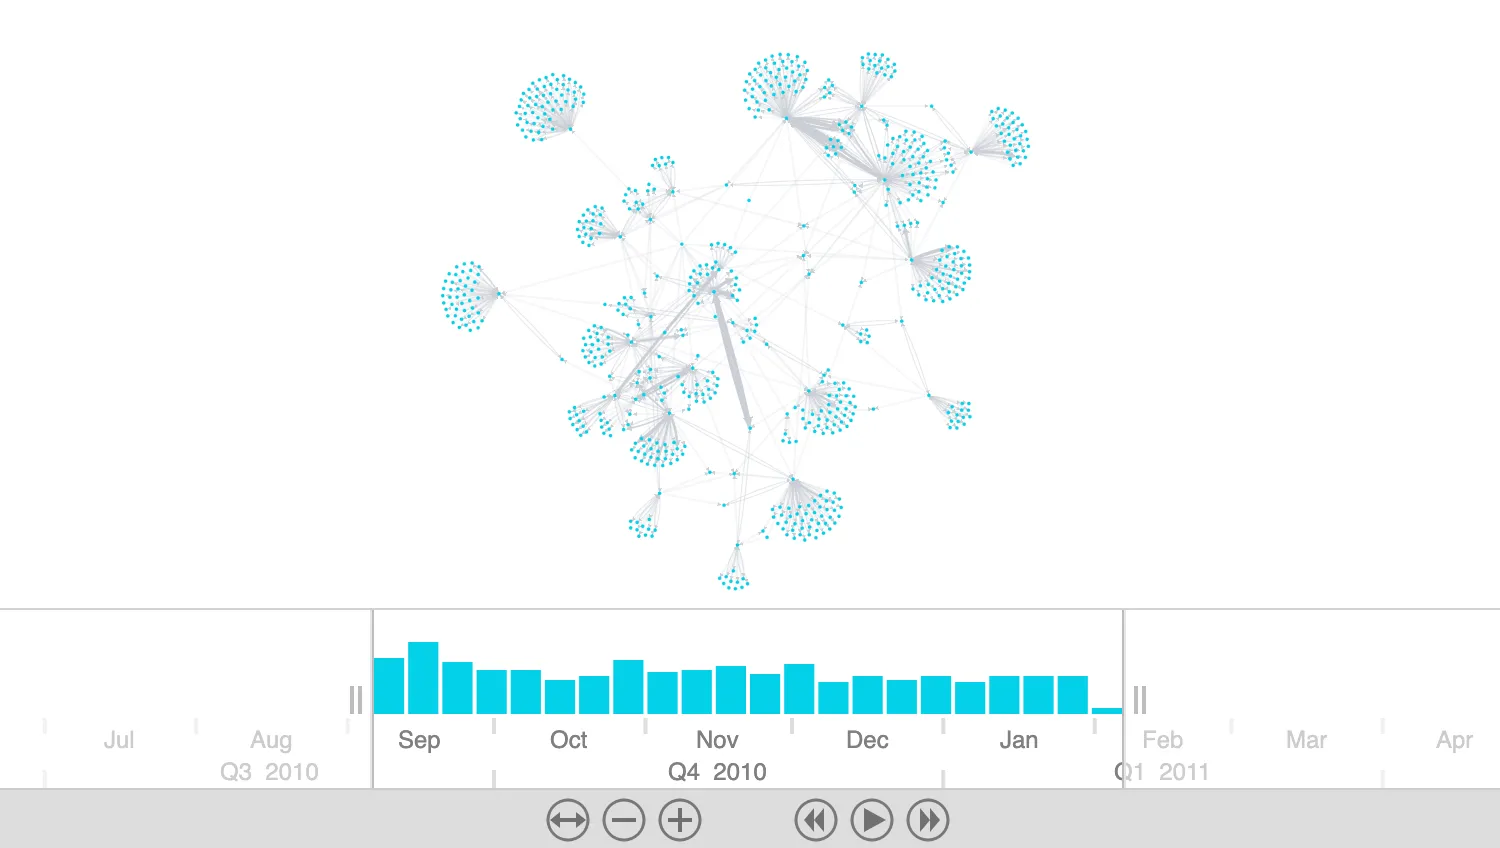
Time Bar Basics
See how a network changes over time.
See example
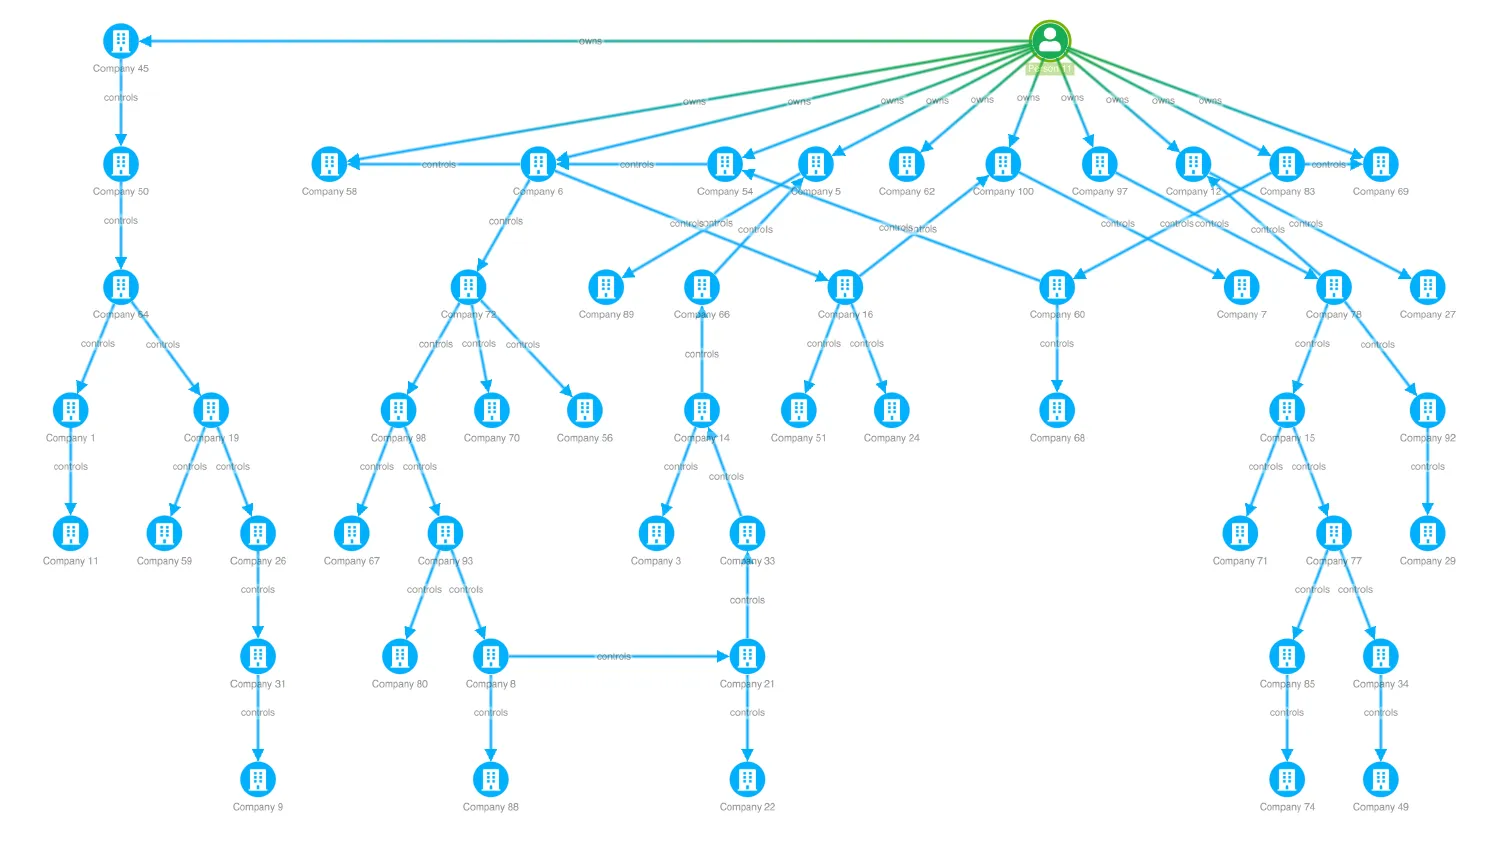
Hierarchical Dependencies
Use dependency analysis to find relations in hierarchies.
See example
Analysis
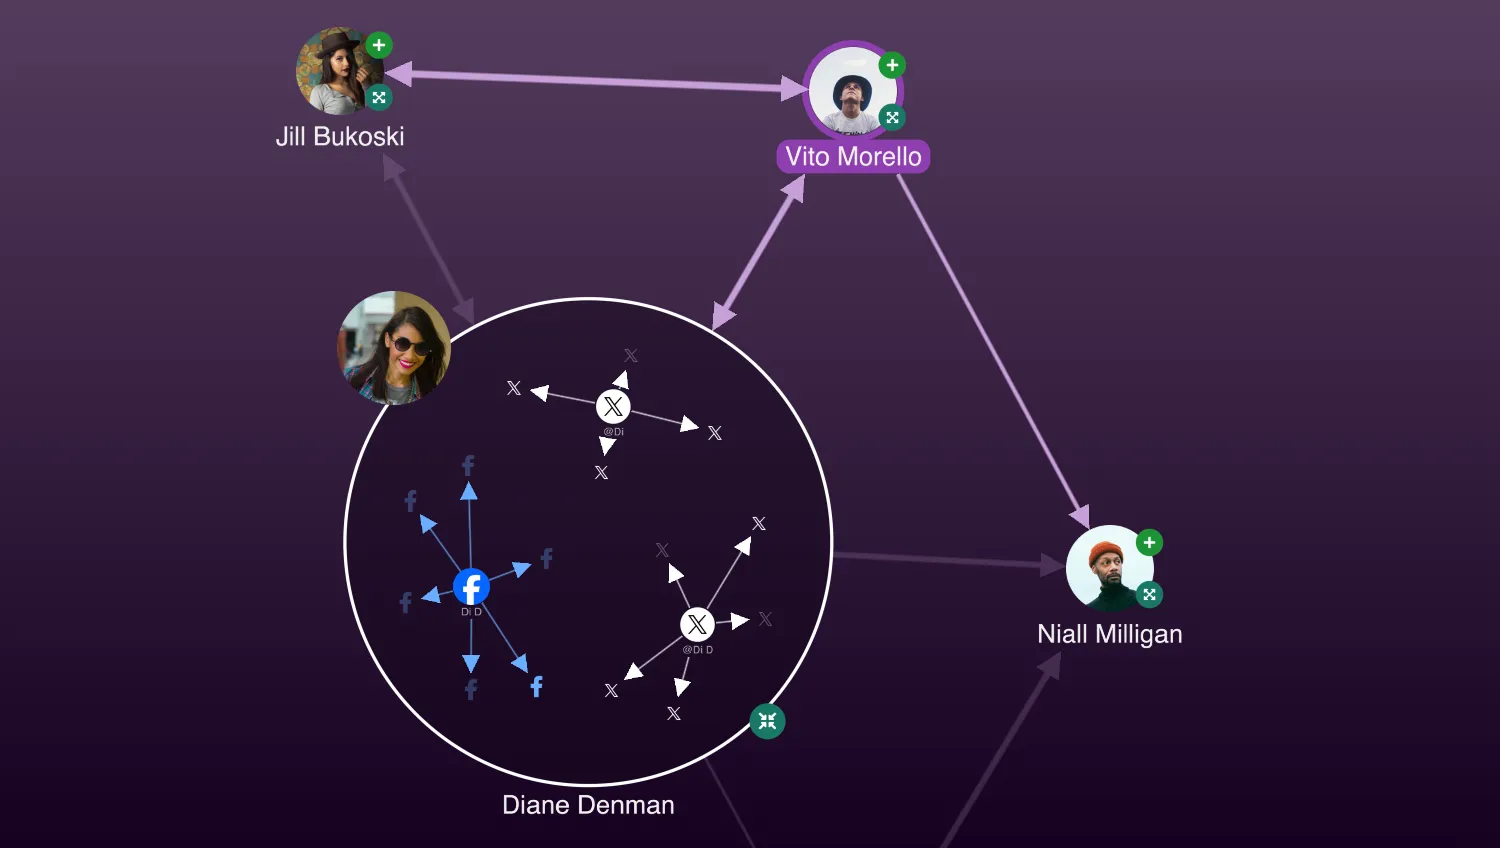
Social Media Analysis
Explore connections between social media accounts.
See example
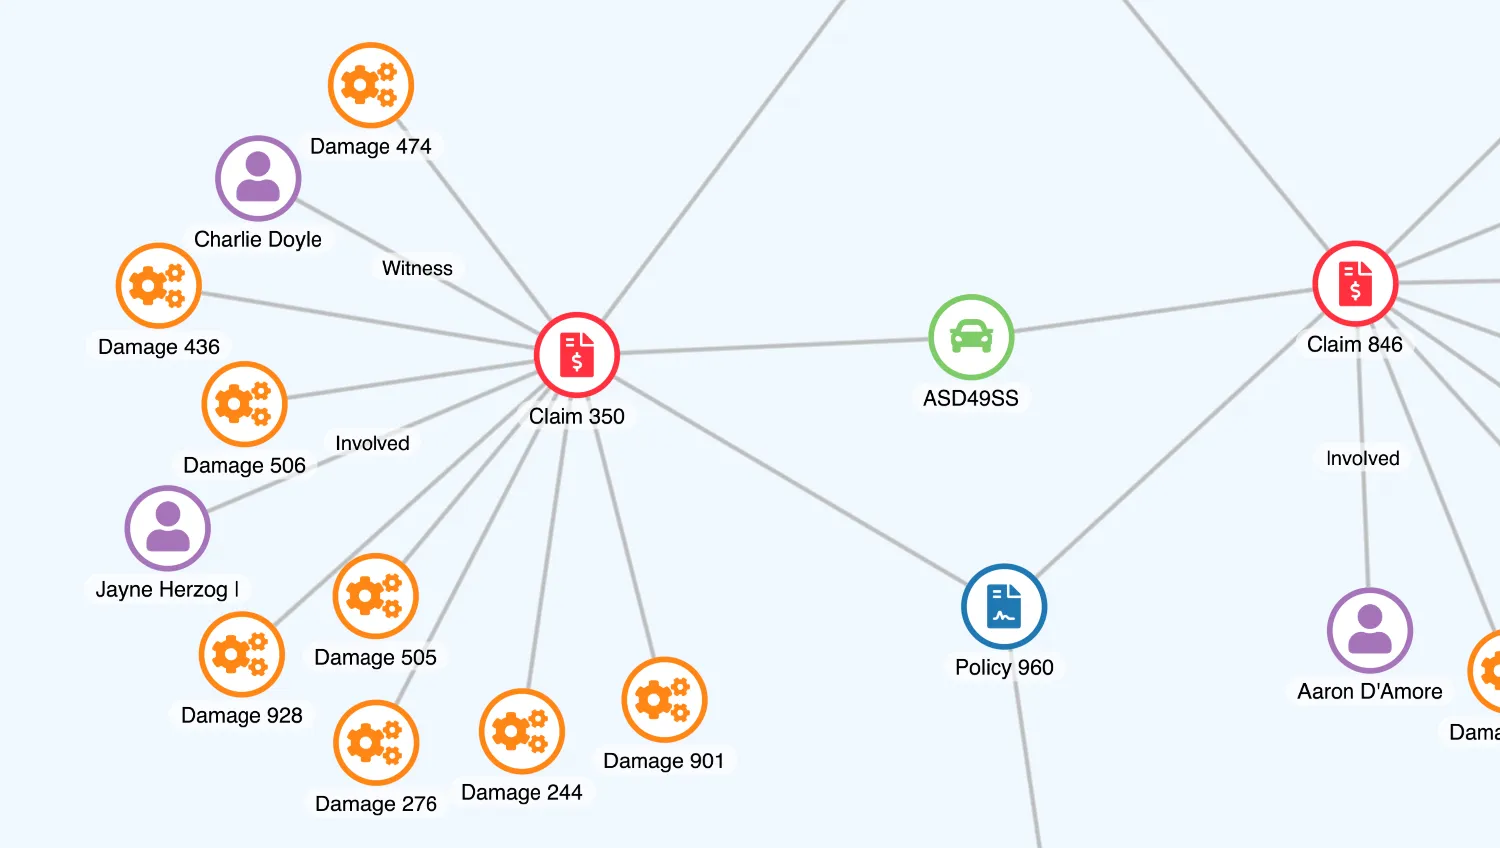
Insurance Fraud Analysis
Explore insurance data for fraudulent activity.
See example
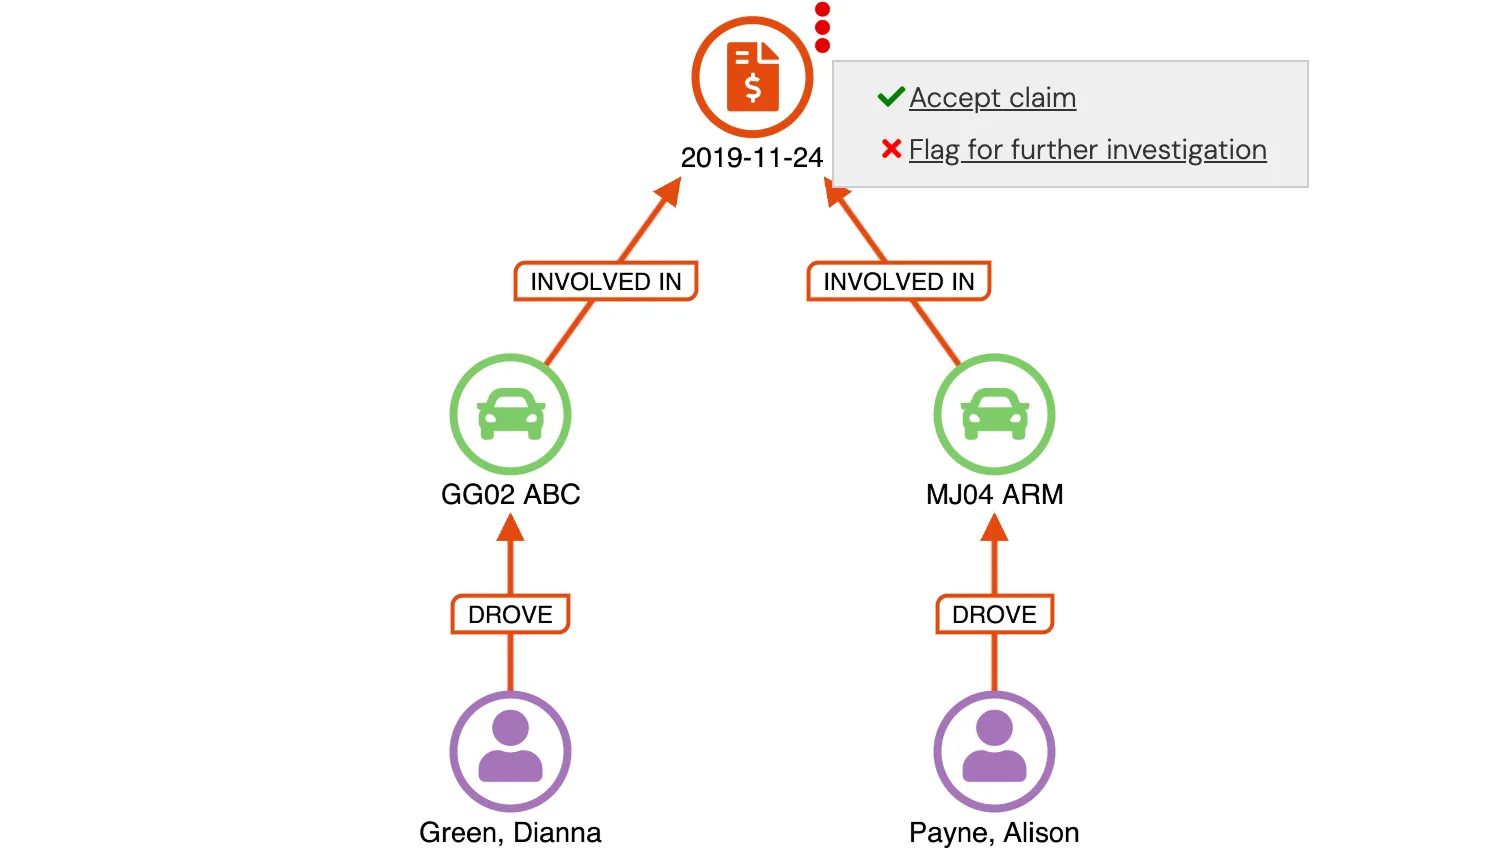
Insurance Claim Workflows
Find matches and flag fraudulent insurance claims.
See example
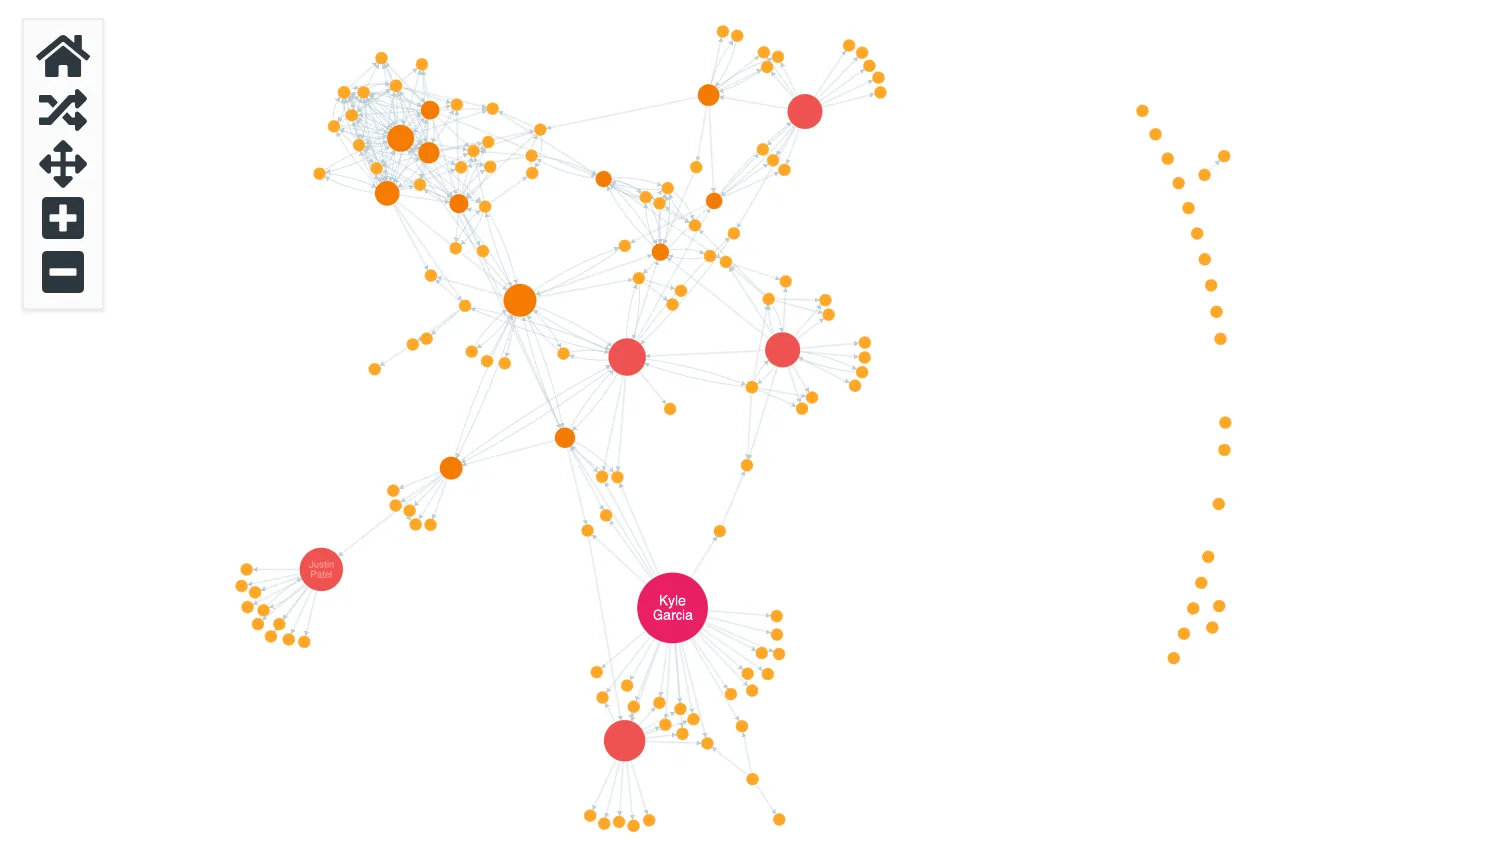
Social Network Analysis
Investigate social structures and relations in complex email data.
See example
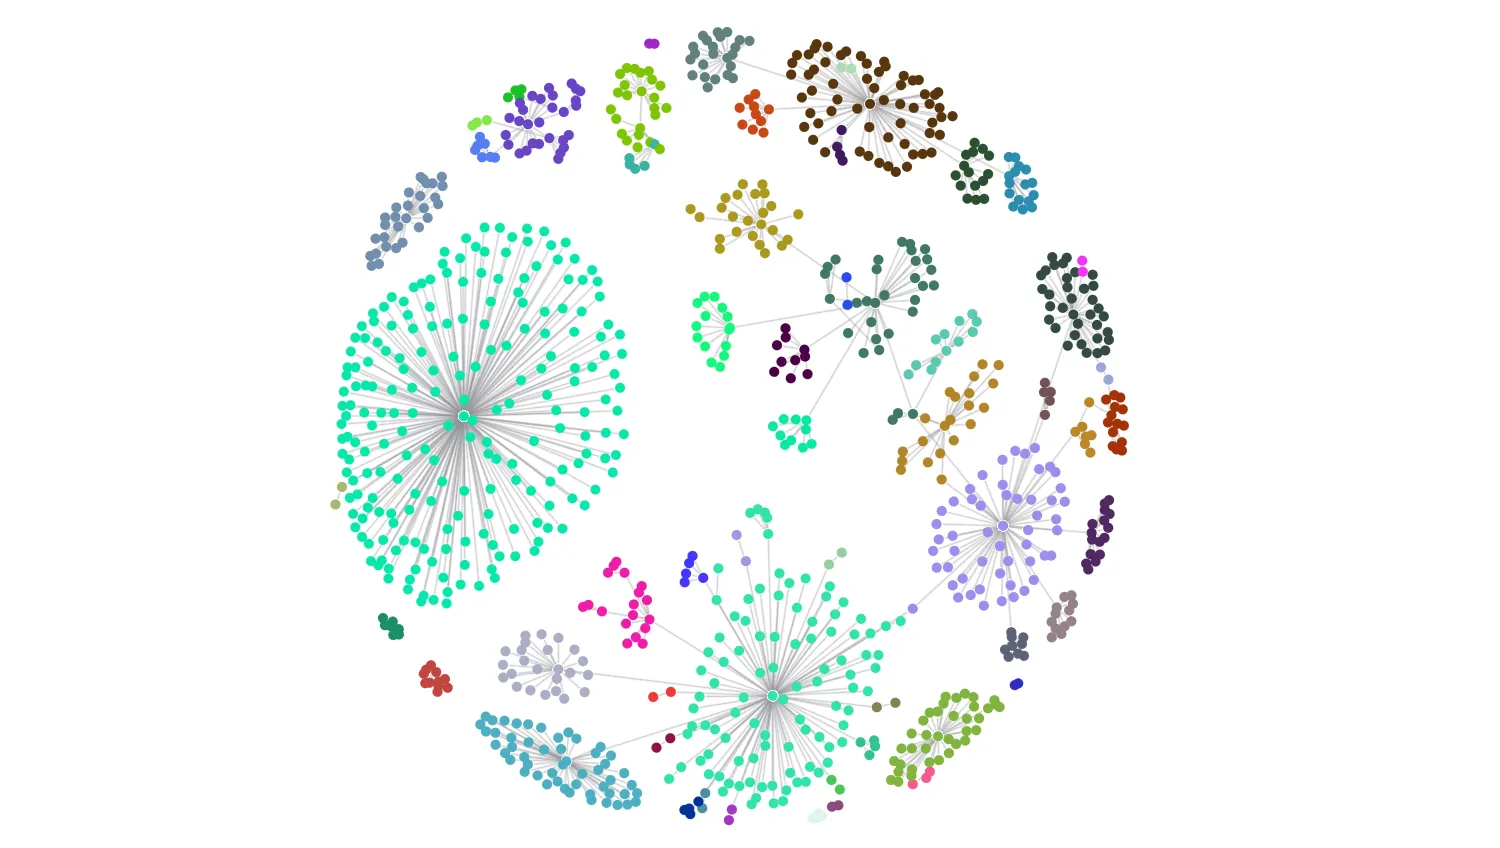
Clusters
Find communities in your network.
See example
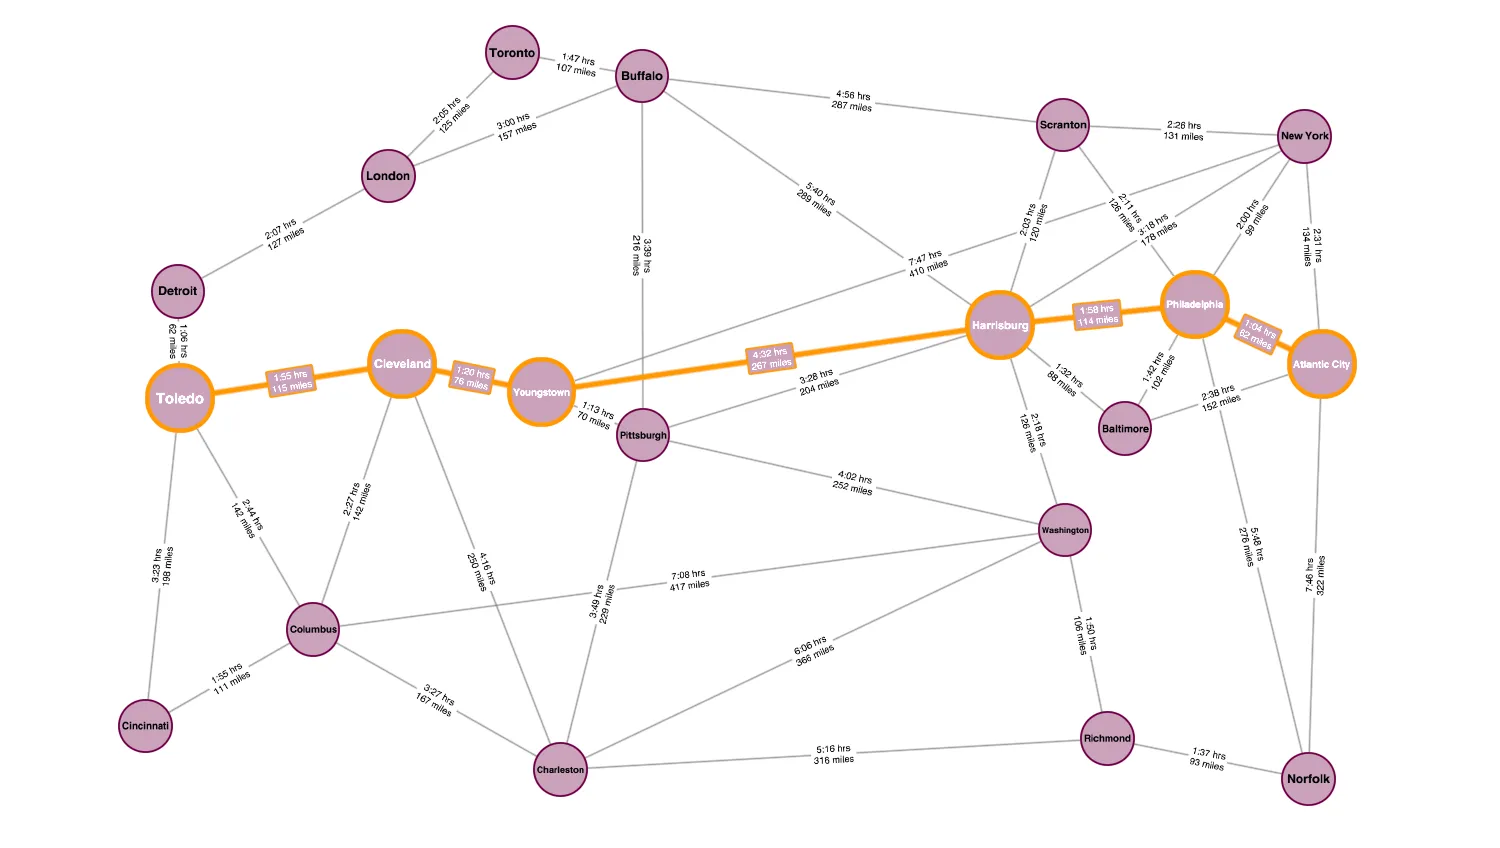
Find Shortest Paths
Find the shortest path between two nodes.
See example
Export
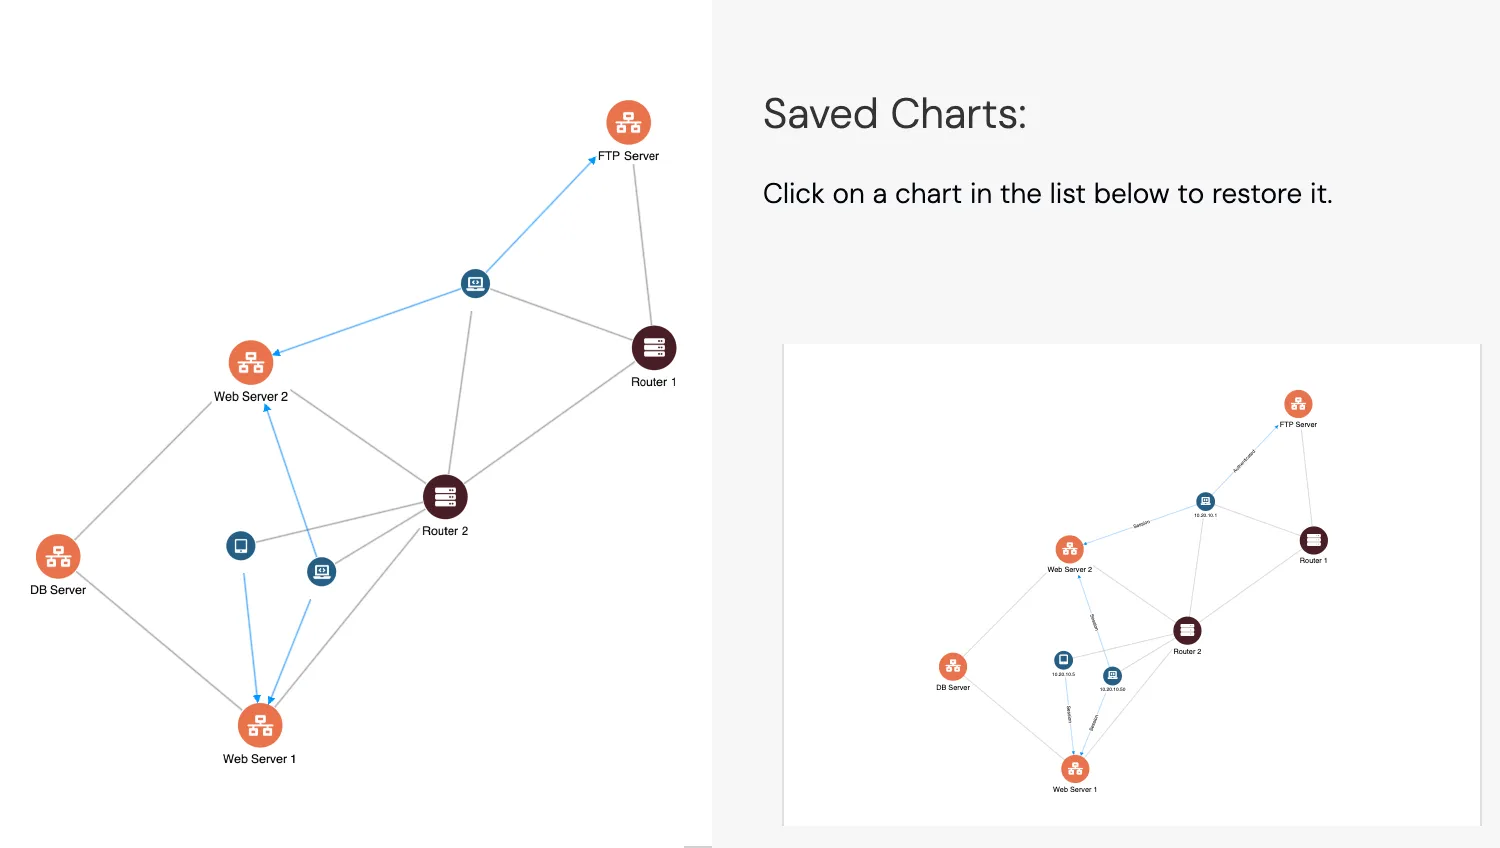
Large Charts
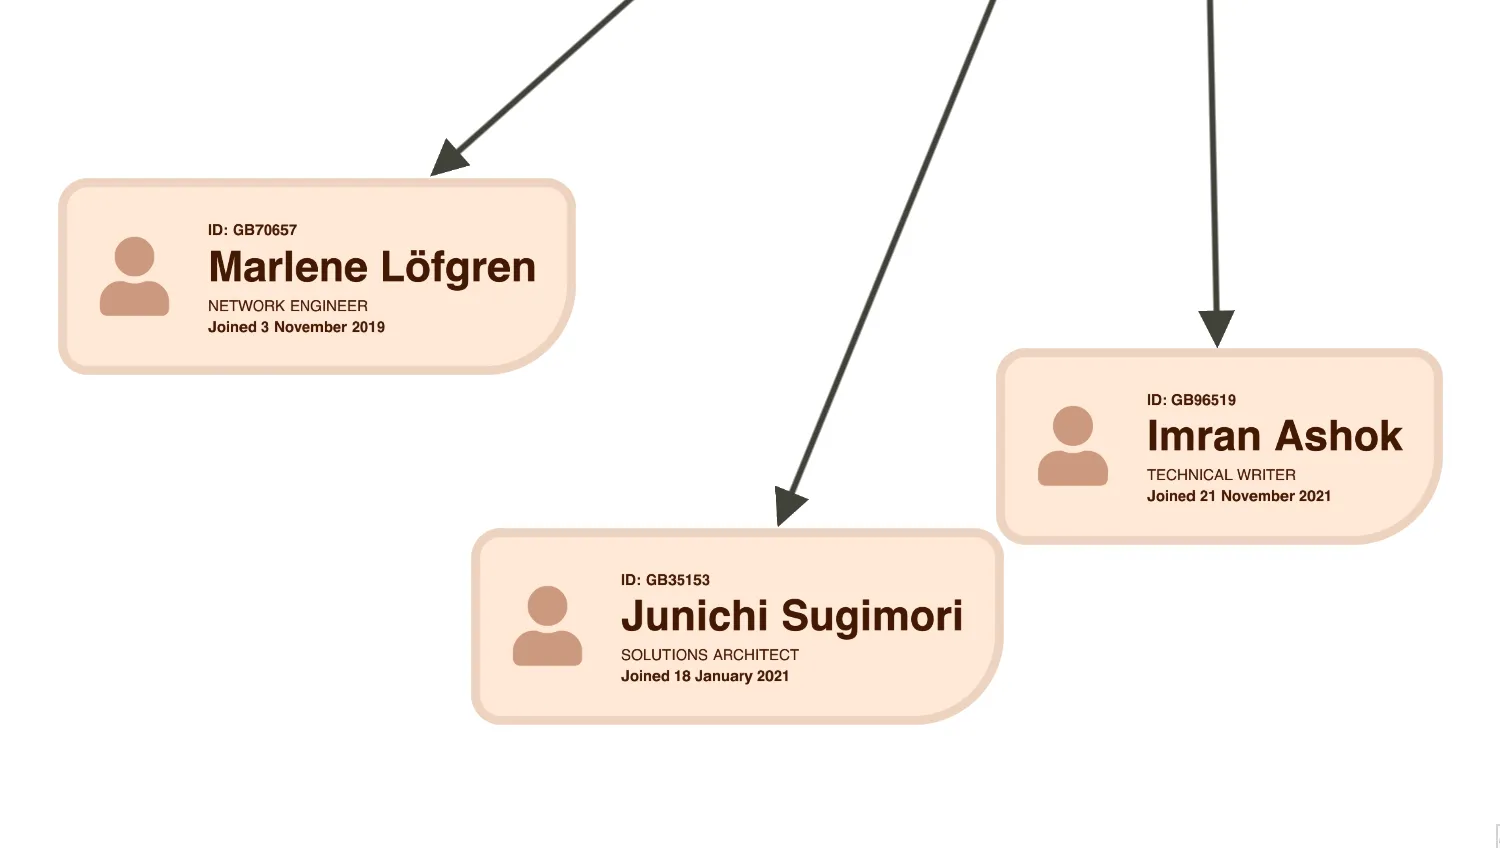
Detail on Zoom
Reveal more details as you zoom in on the badge nodes.
See example
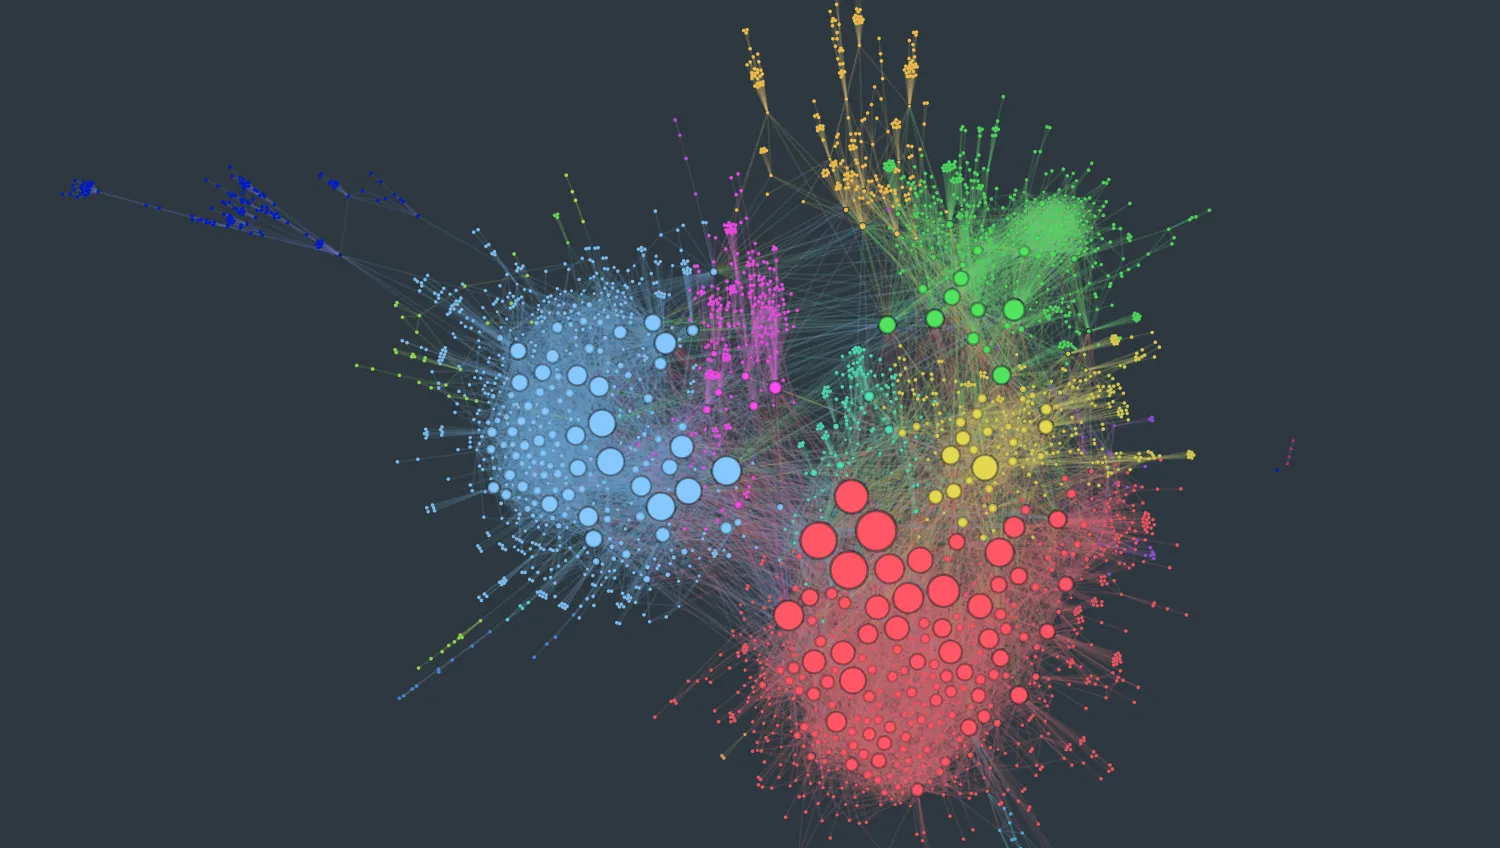
Visualising Big Data
Discover new ways to visualise large networks.
See example
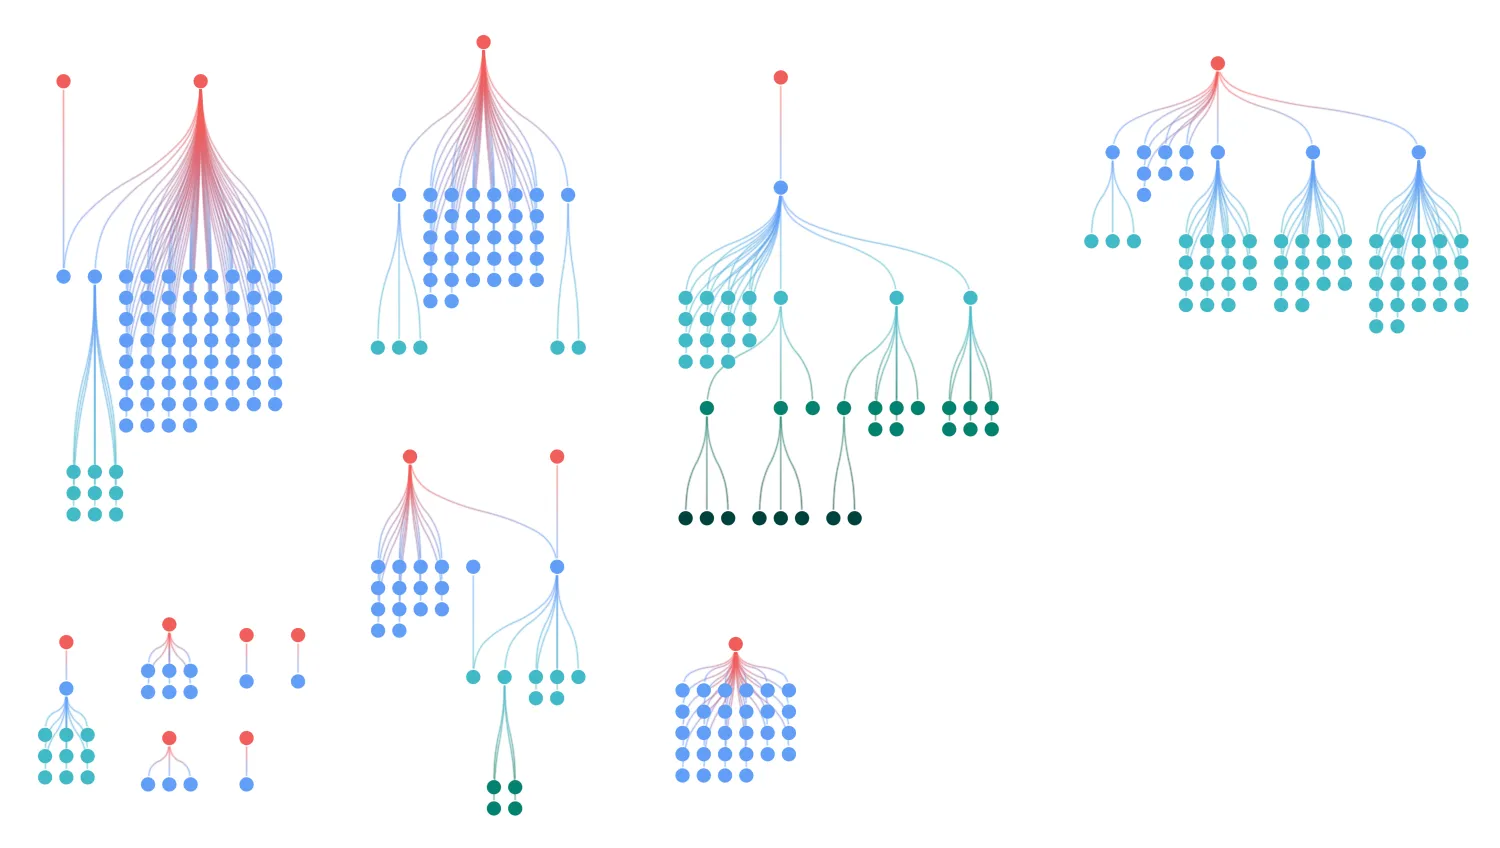
Navigate Large Hierarchies
Arrange large sequences of data into grids to simplify navigation.
See example
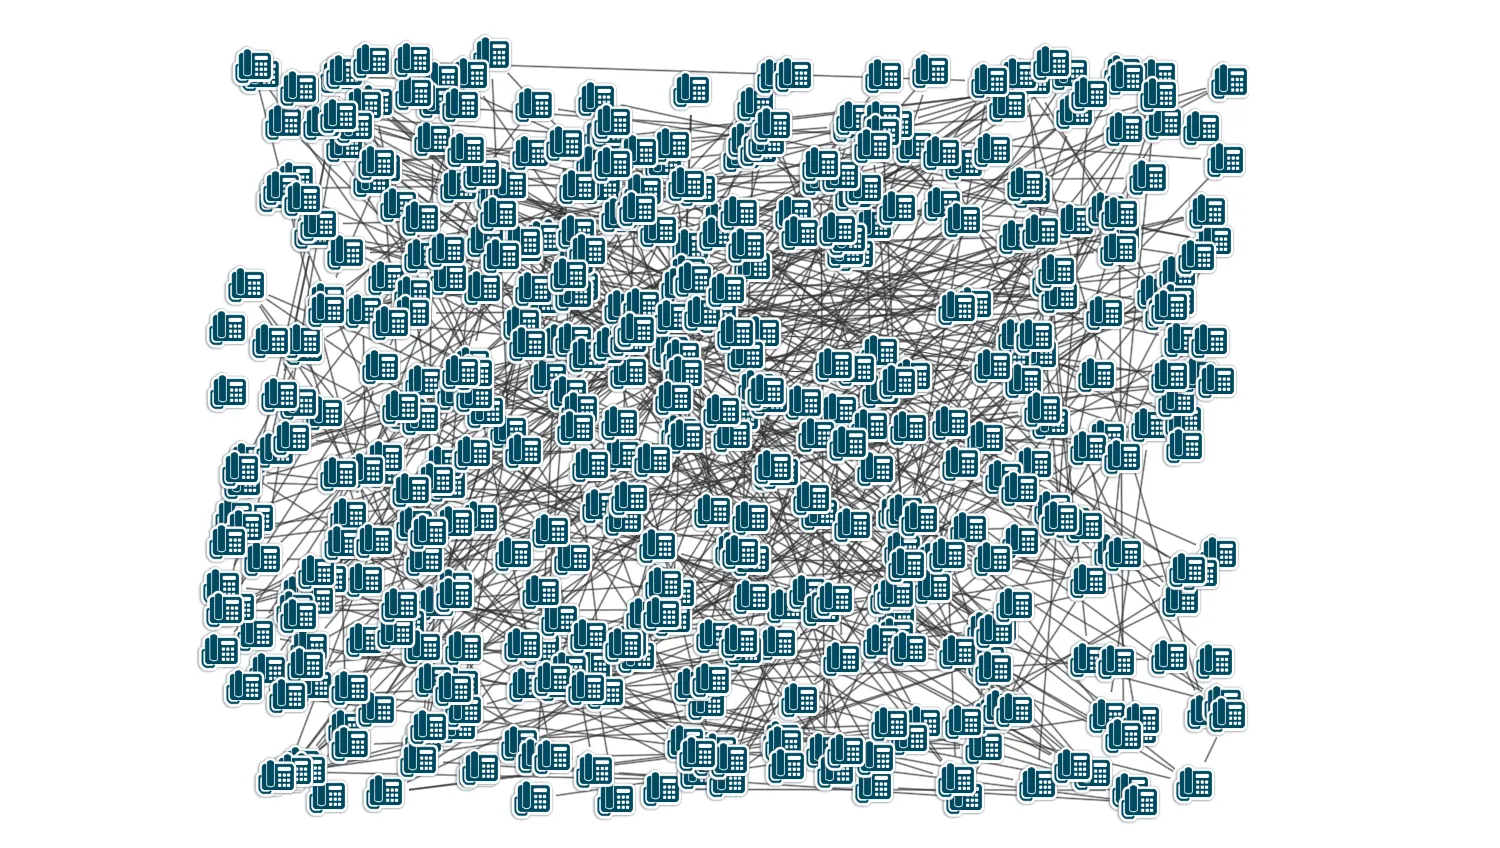
Test Performance
Measure how well KeyLines performs.
See example
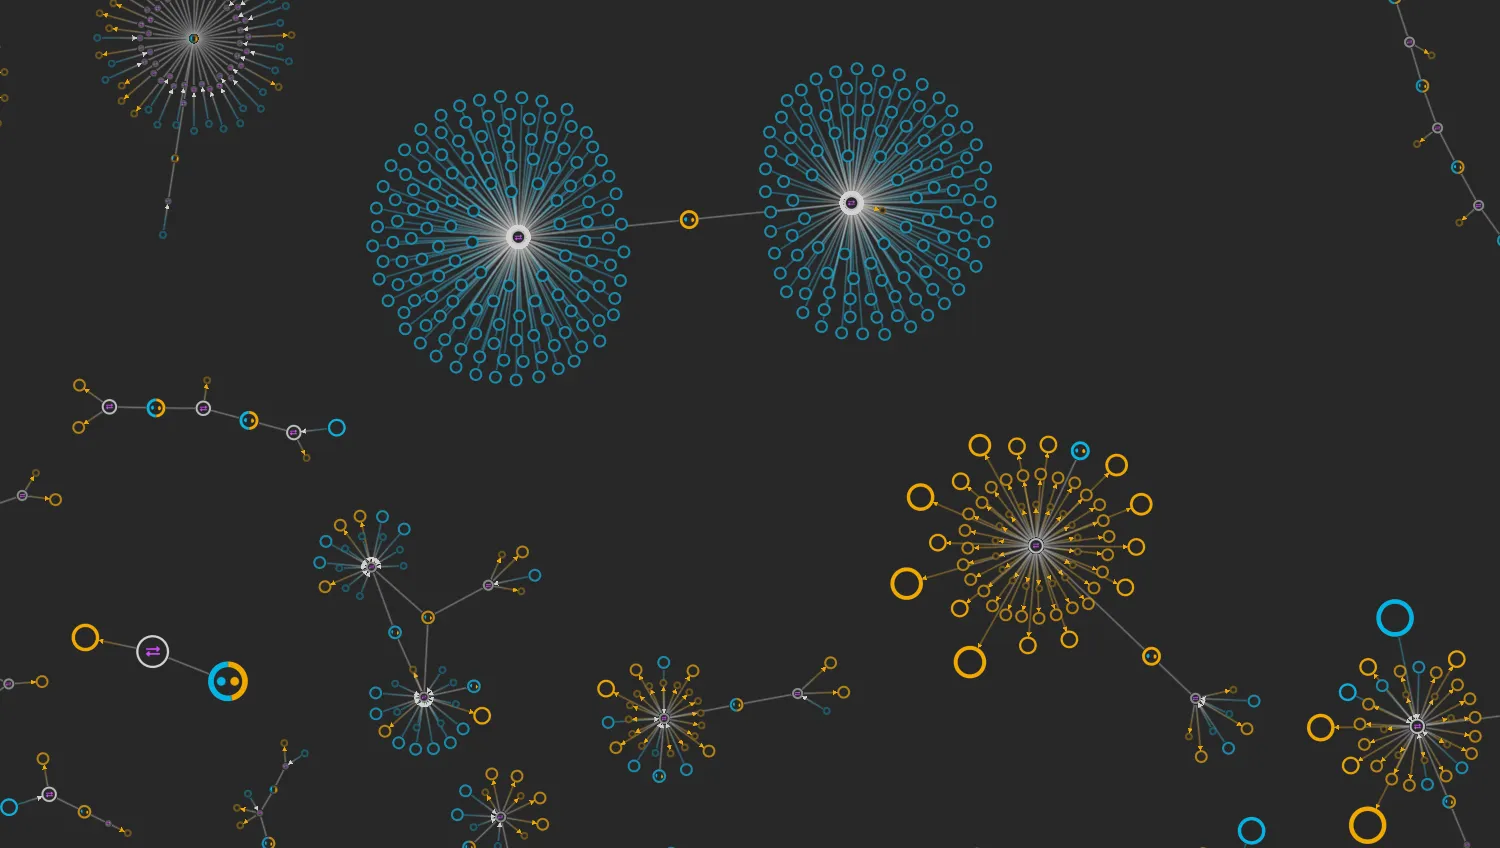
Bitcoin Transactions
Explore bitcoin transactions and their blockchain structure.
See example
Frameworks
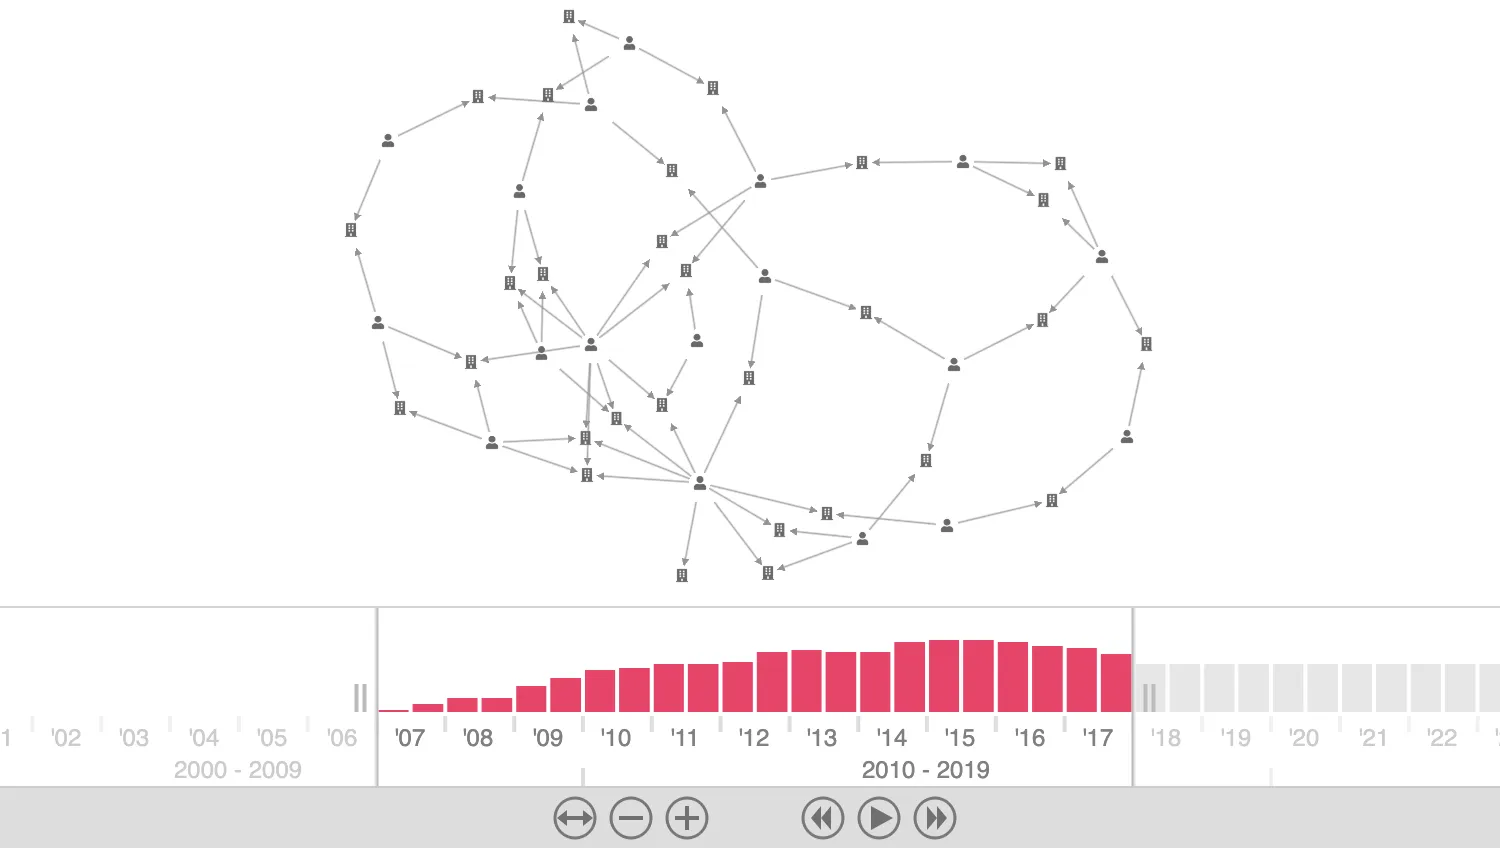
Angular Integration
Use Angular to create time bar and chart with font icons and tooltips.
See example
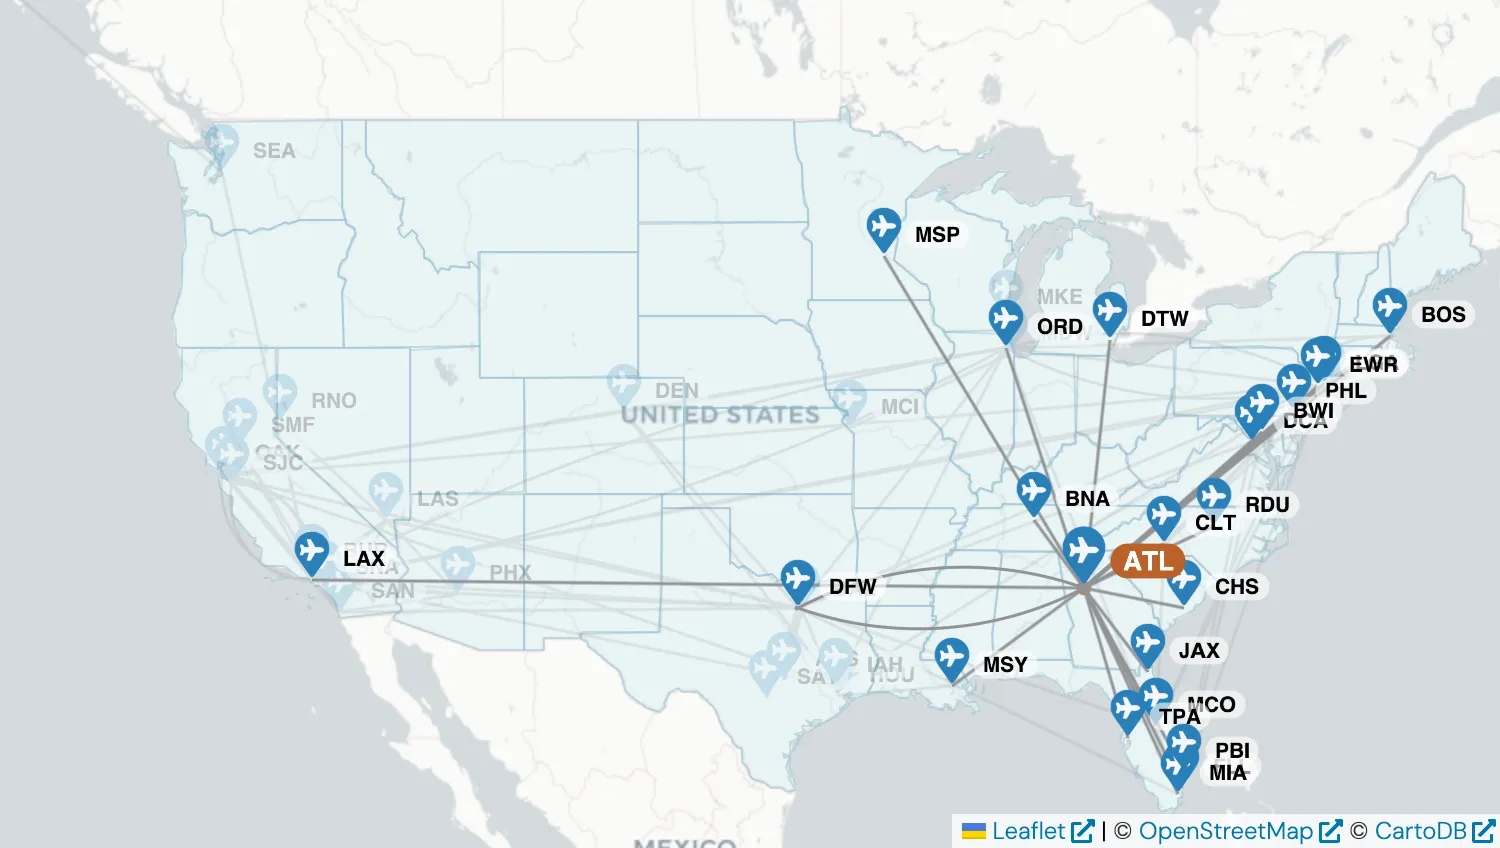
Leaflet Integration
Enhance your graph with a map view.
See example
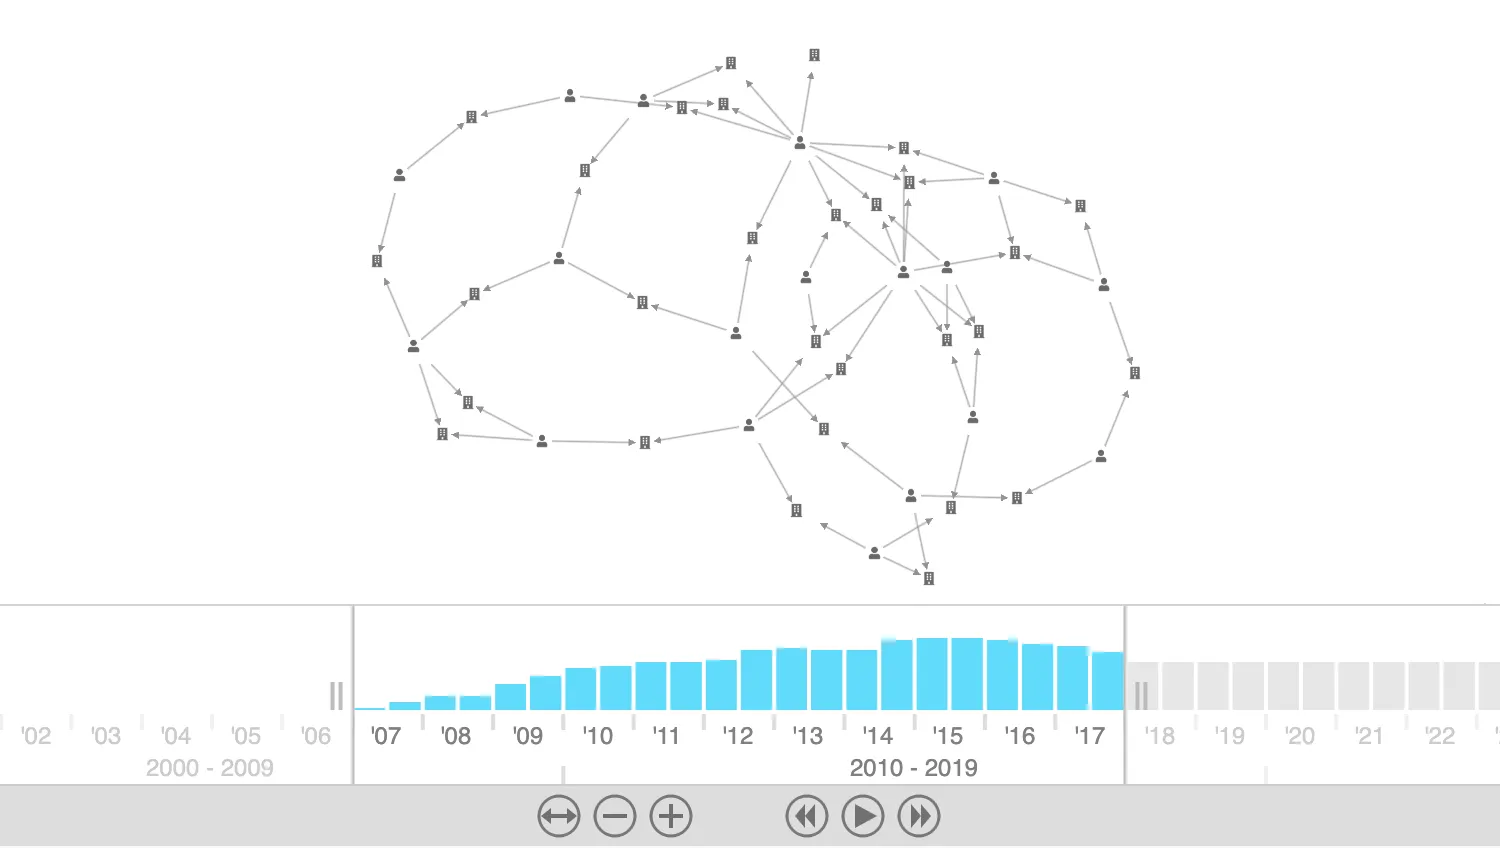
React Integration
Use React to create time bar and chart with font icons and tooltips.
See example
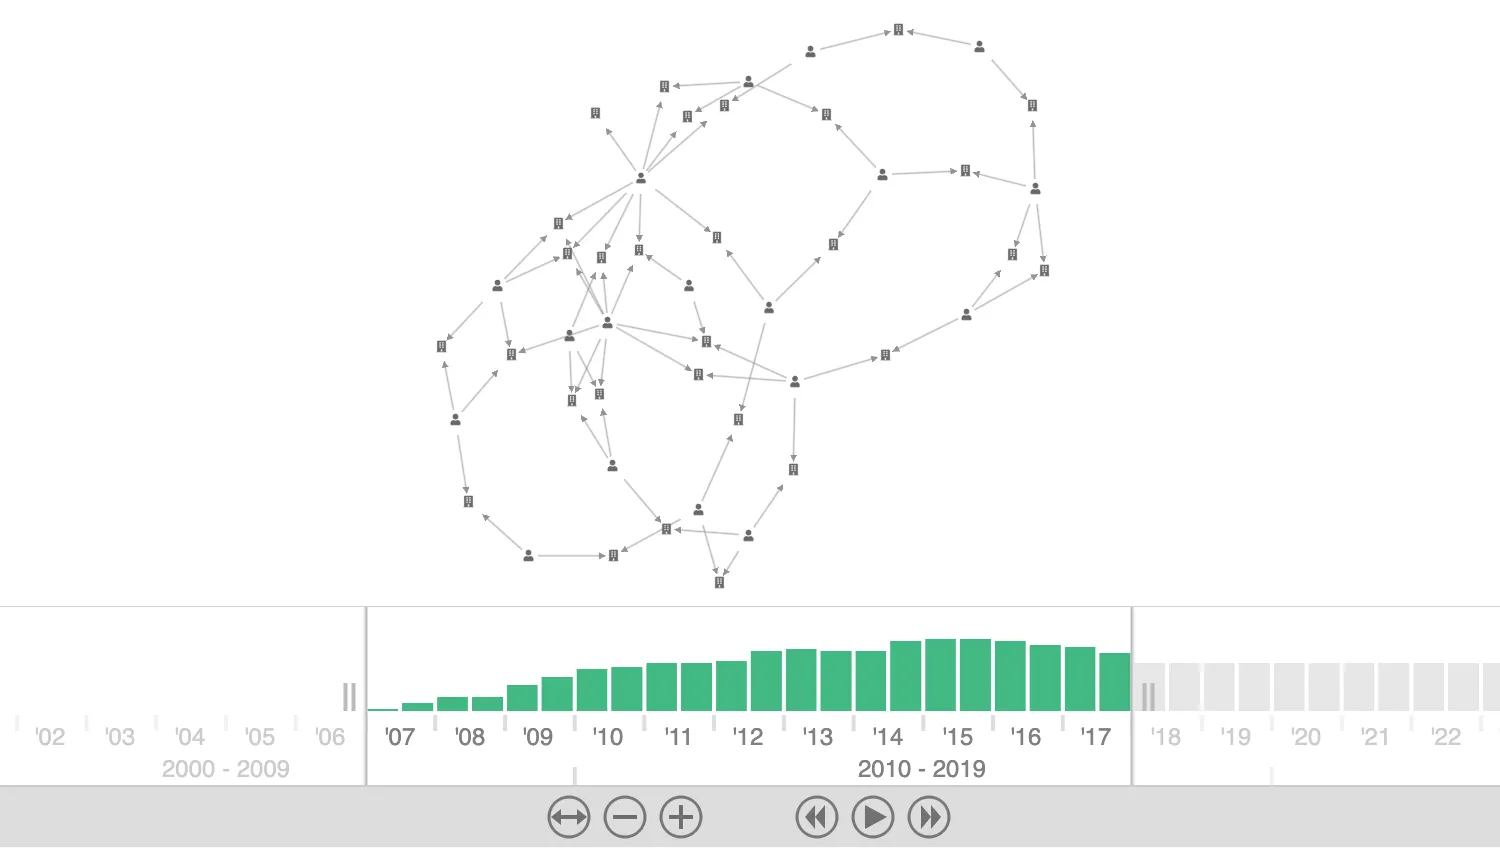
Vue.js Integration
Use Vue.js to create time bar and chart with font icons and tooltips.
See example
Time
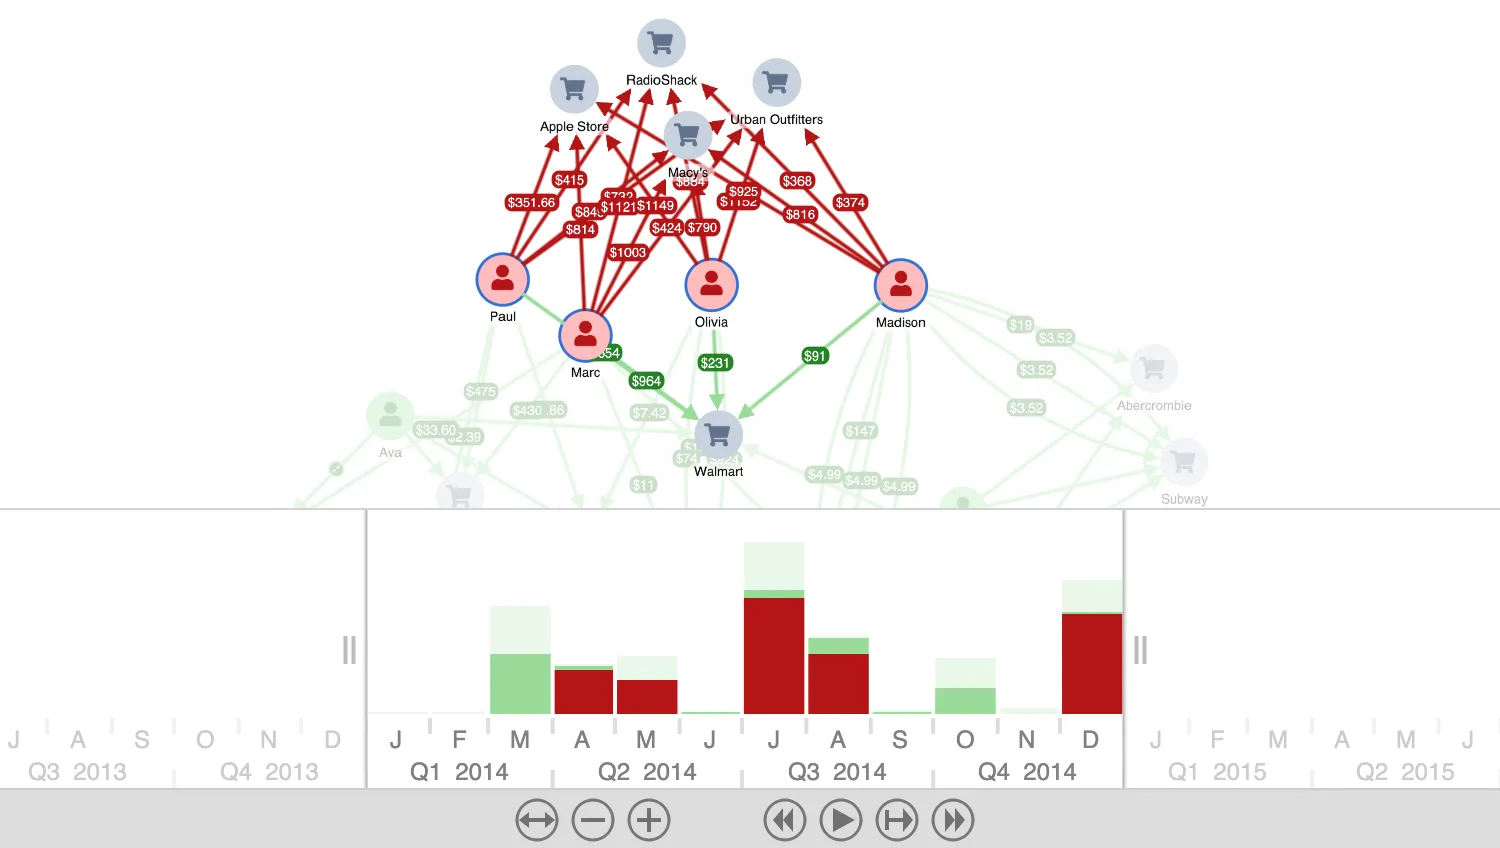
Credit Card Fraud
Investigate the source of credit card fraud.
See example
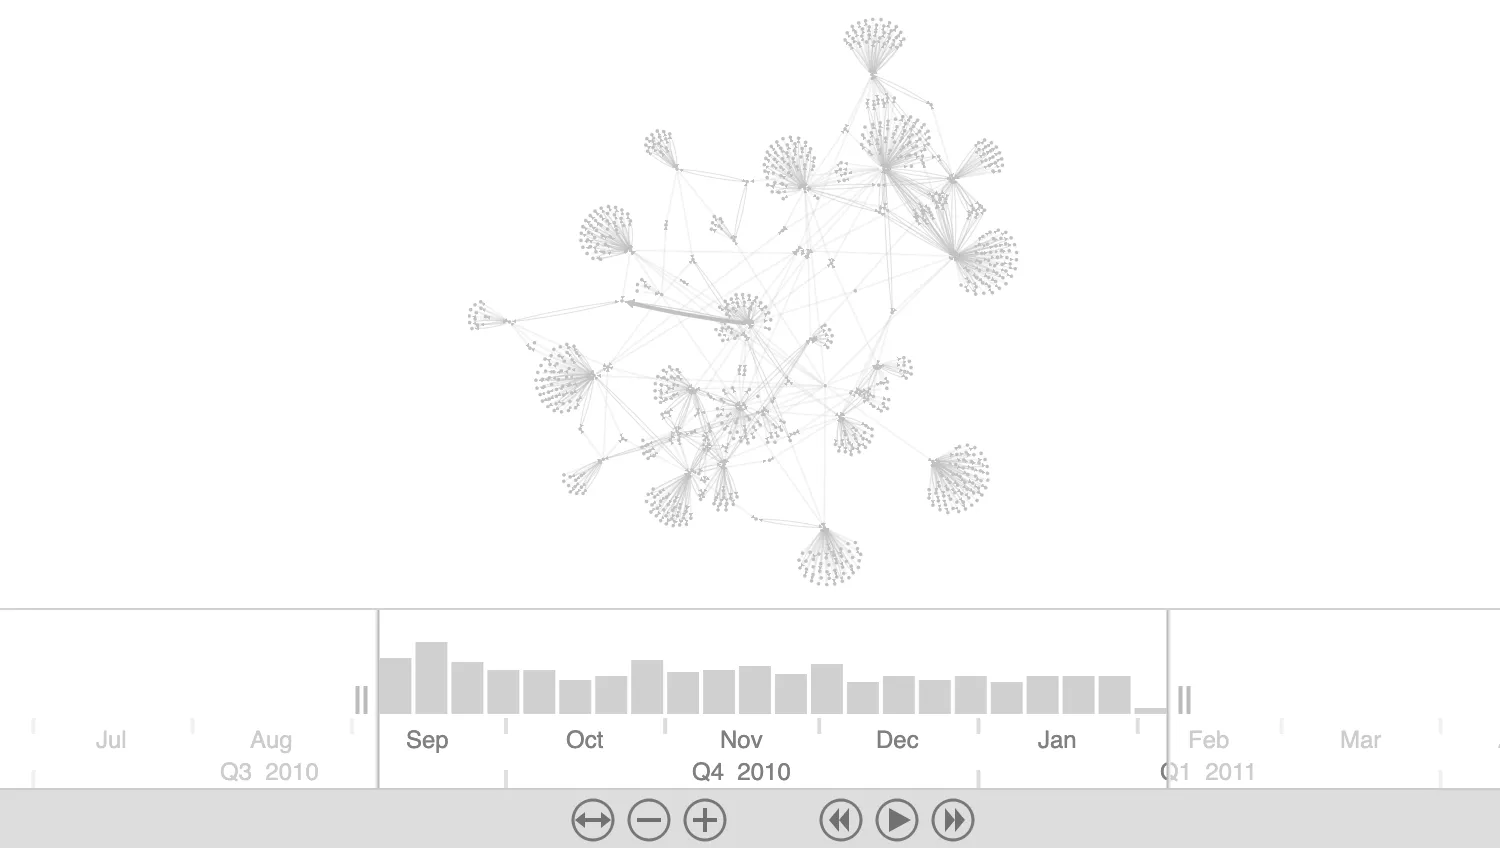
Animate Filtering by Time
Select, compare and display time-based activities.
See example
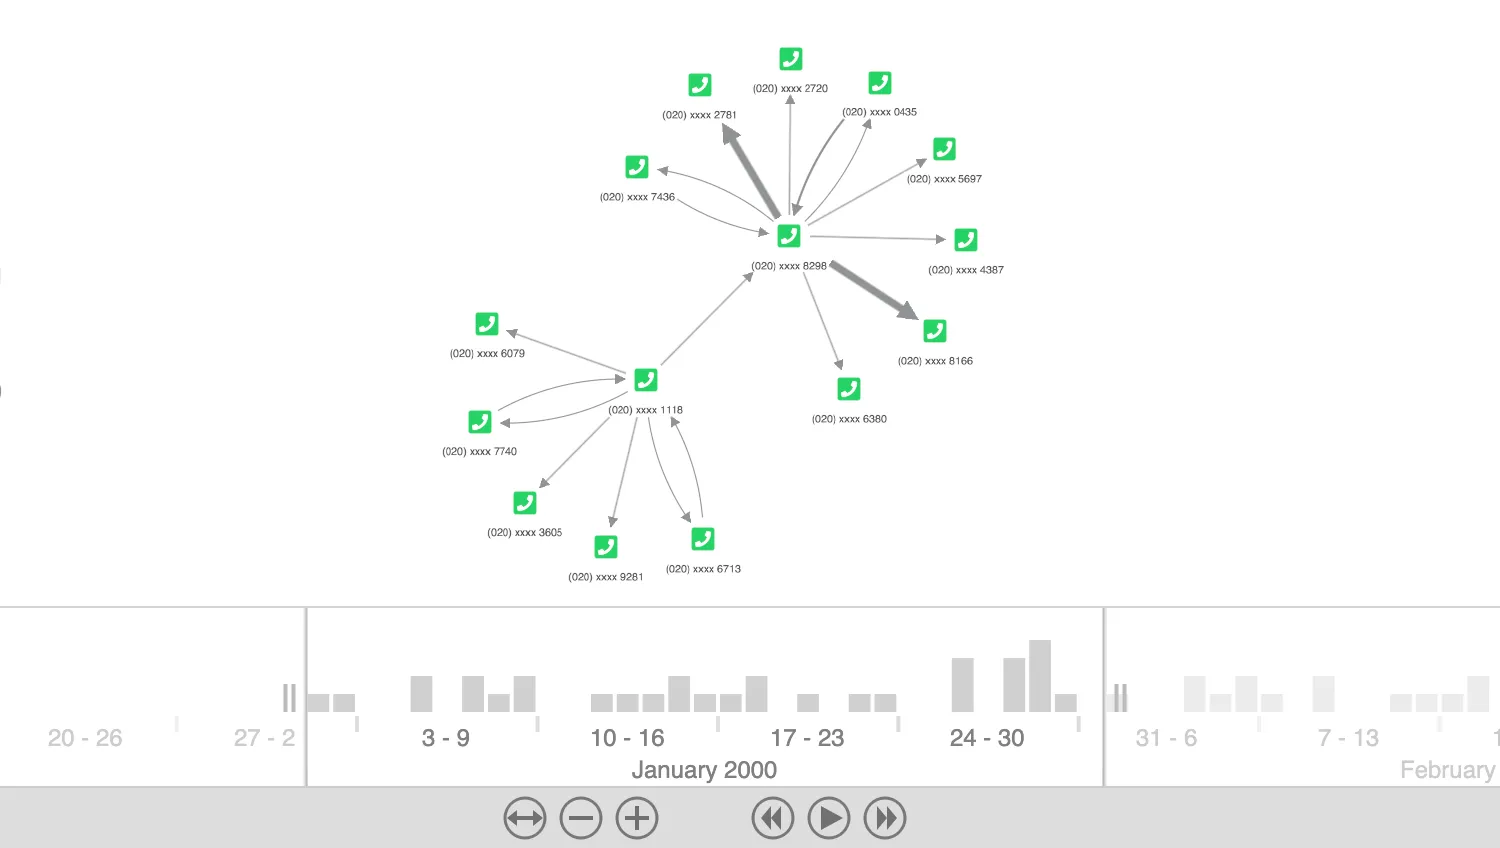
Animate Link Widths
Animate link widths to visualise the volume of data in the time bar.
See example
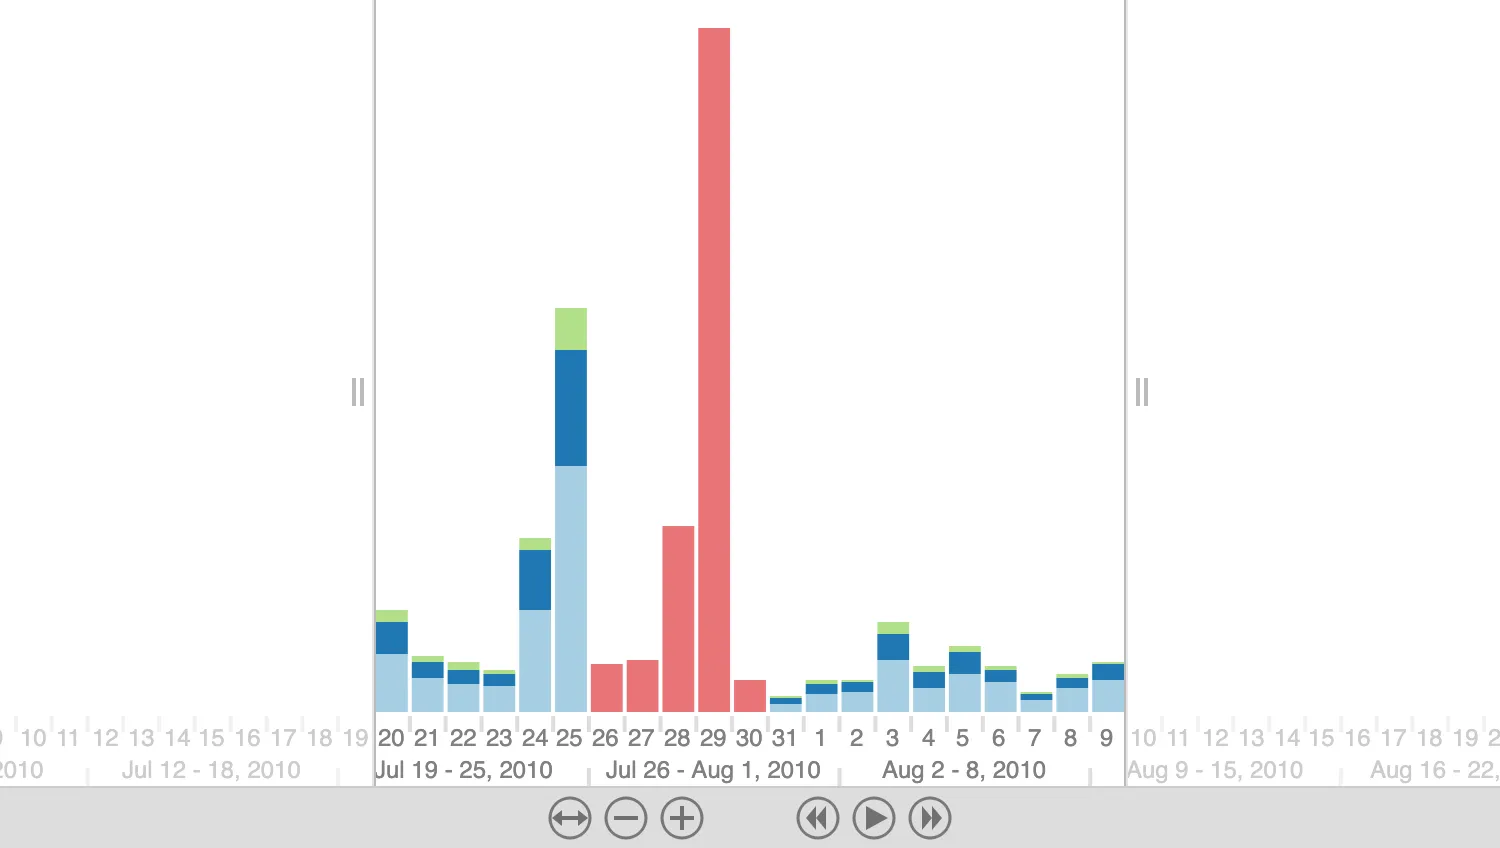
Customise the Time Bar
Set the look and feel of the time bar.
See example
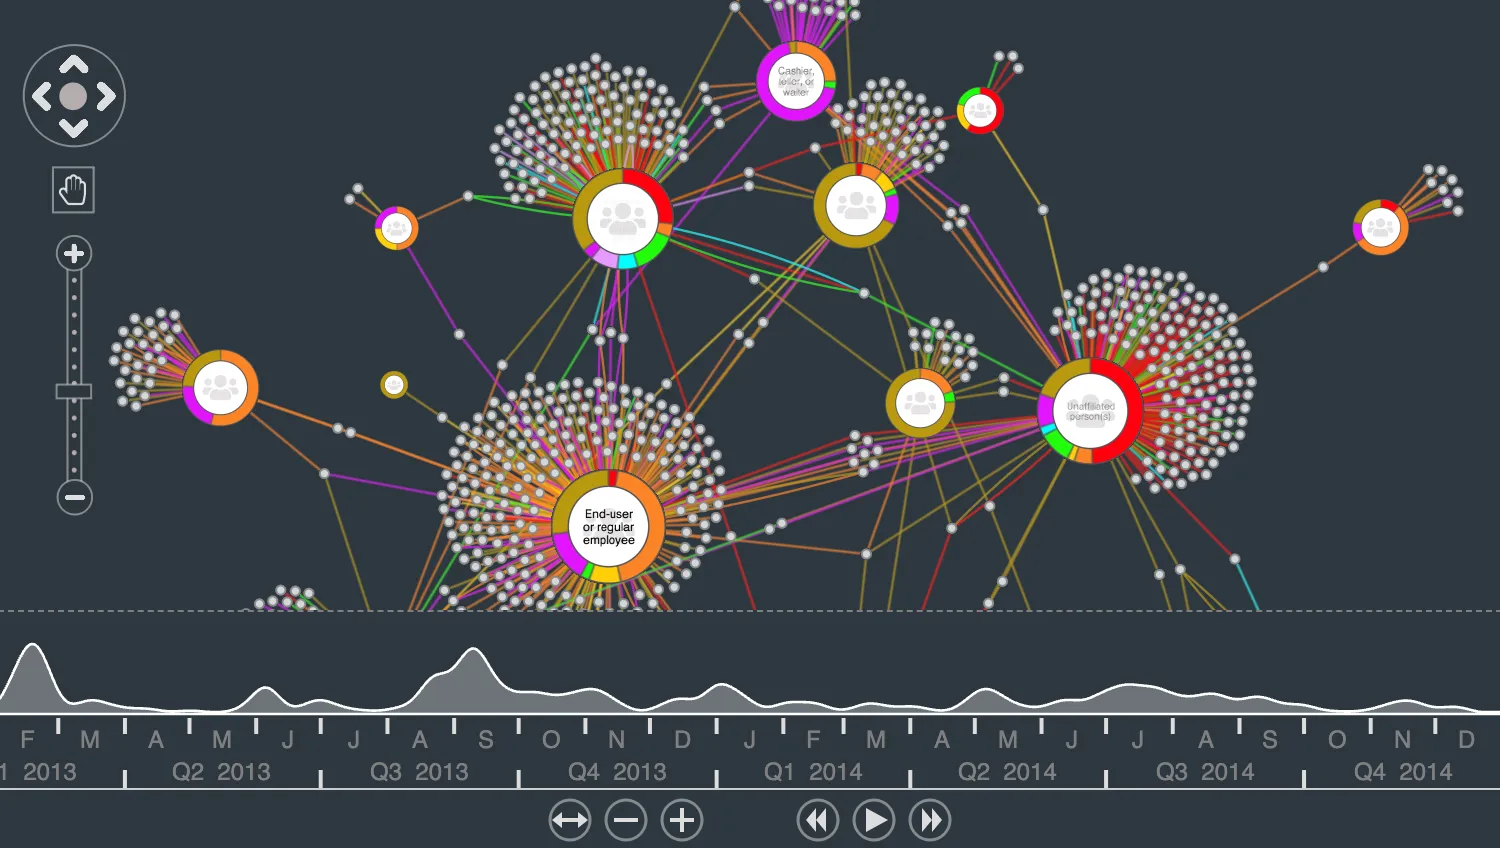
Filter Data Breaches
Explore relations between cyber attackers and their targets.
See example
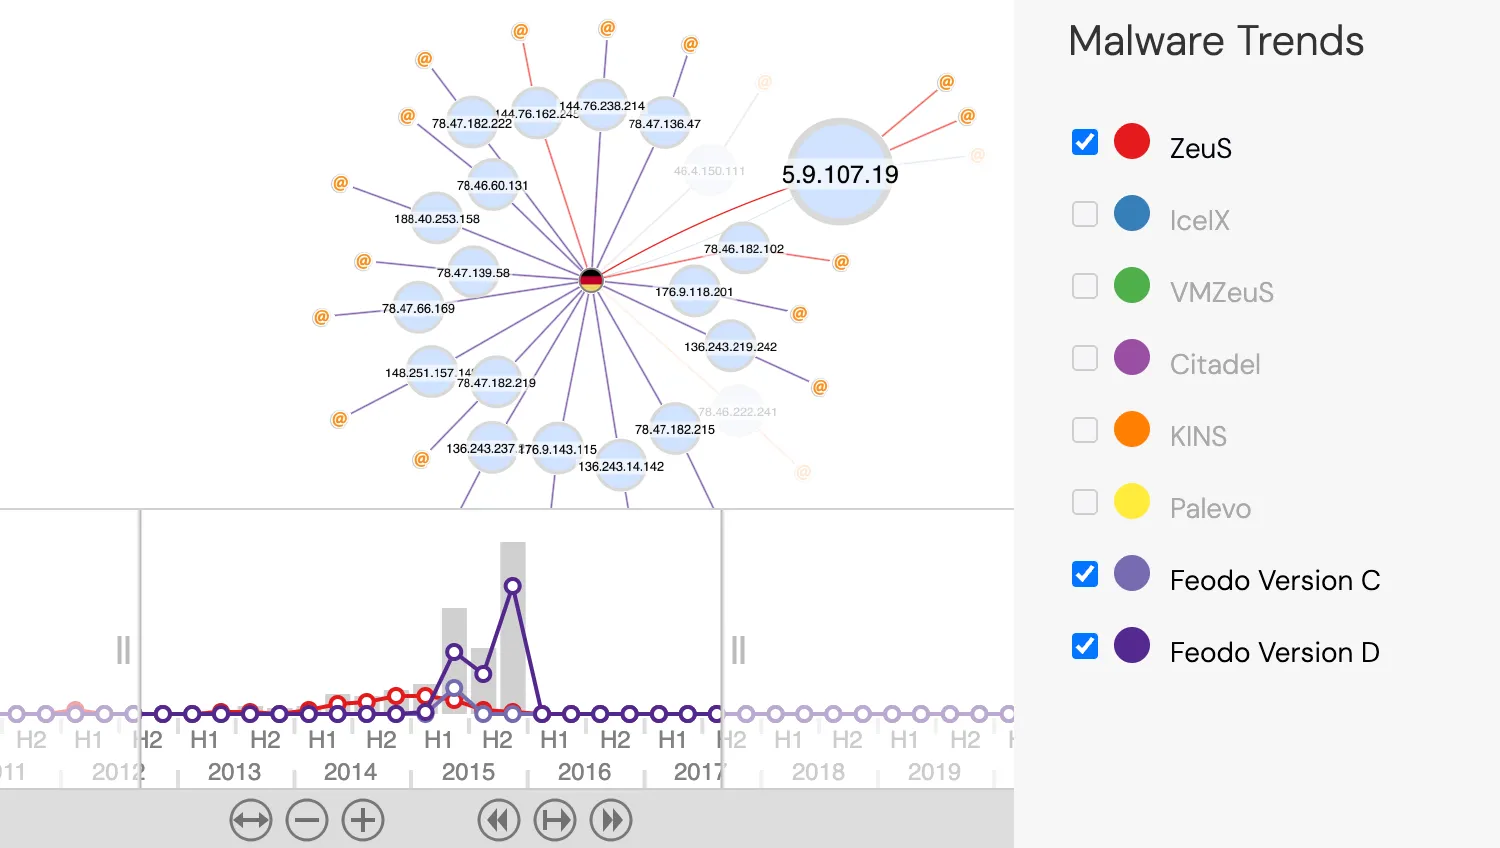
Find Malware Trends
Reveal trends and patterns from malware tracker data.
See example
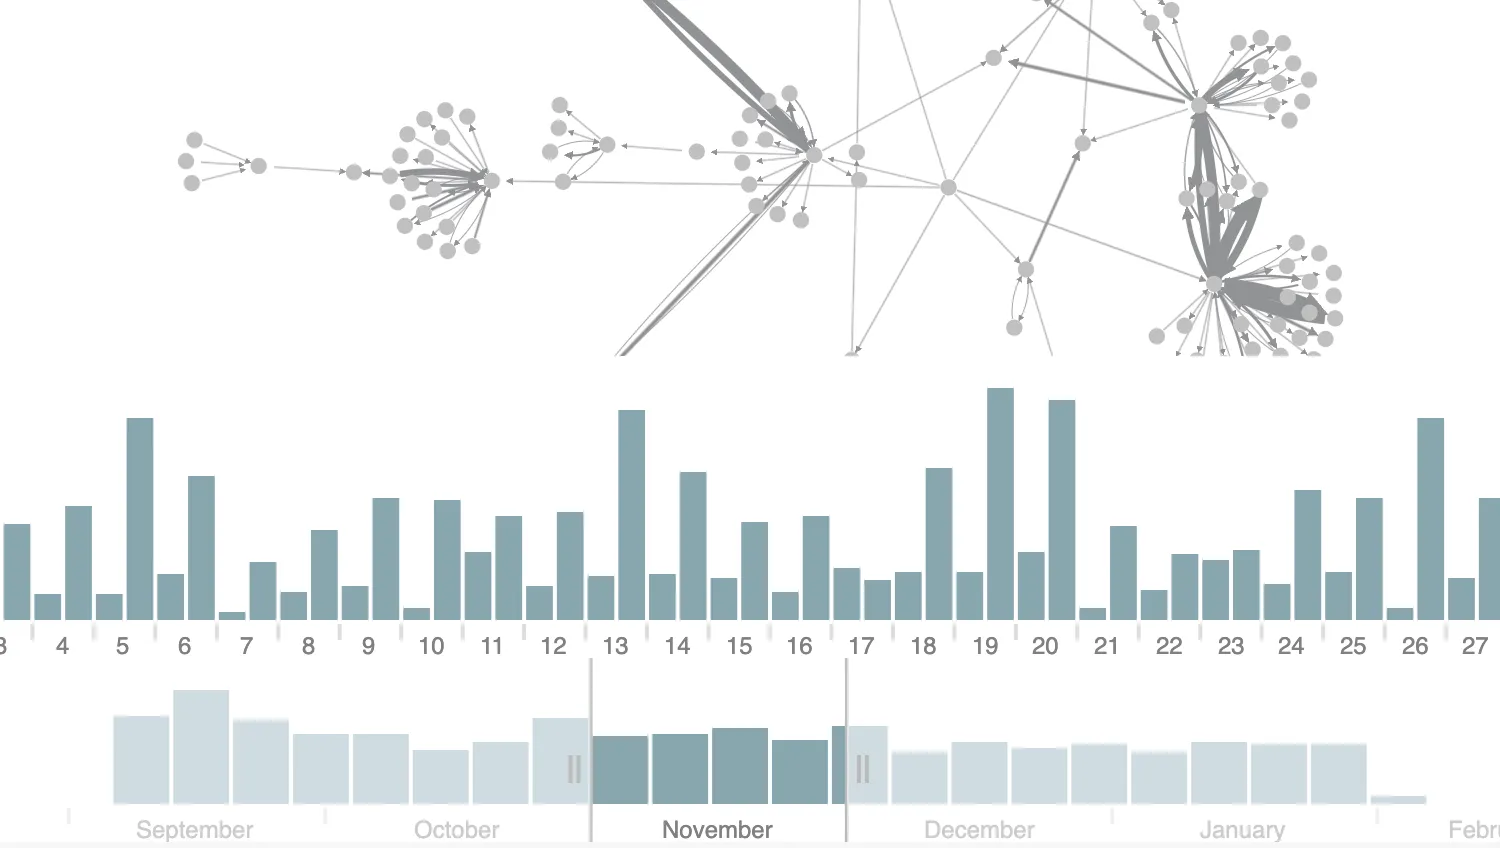
Multiple Time Bars
Use multiple time bars to explore data.
See example
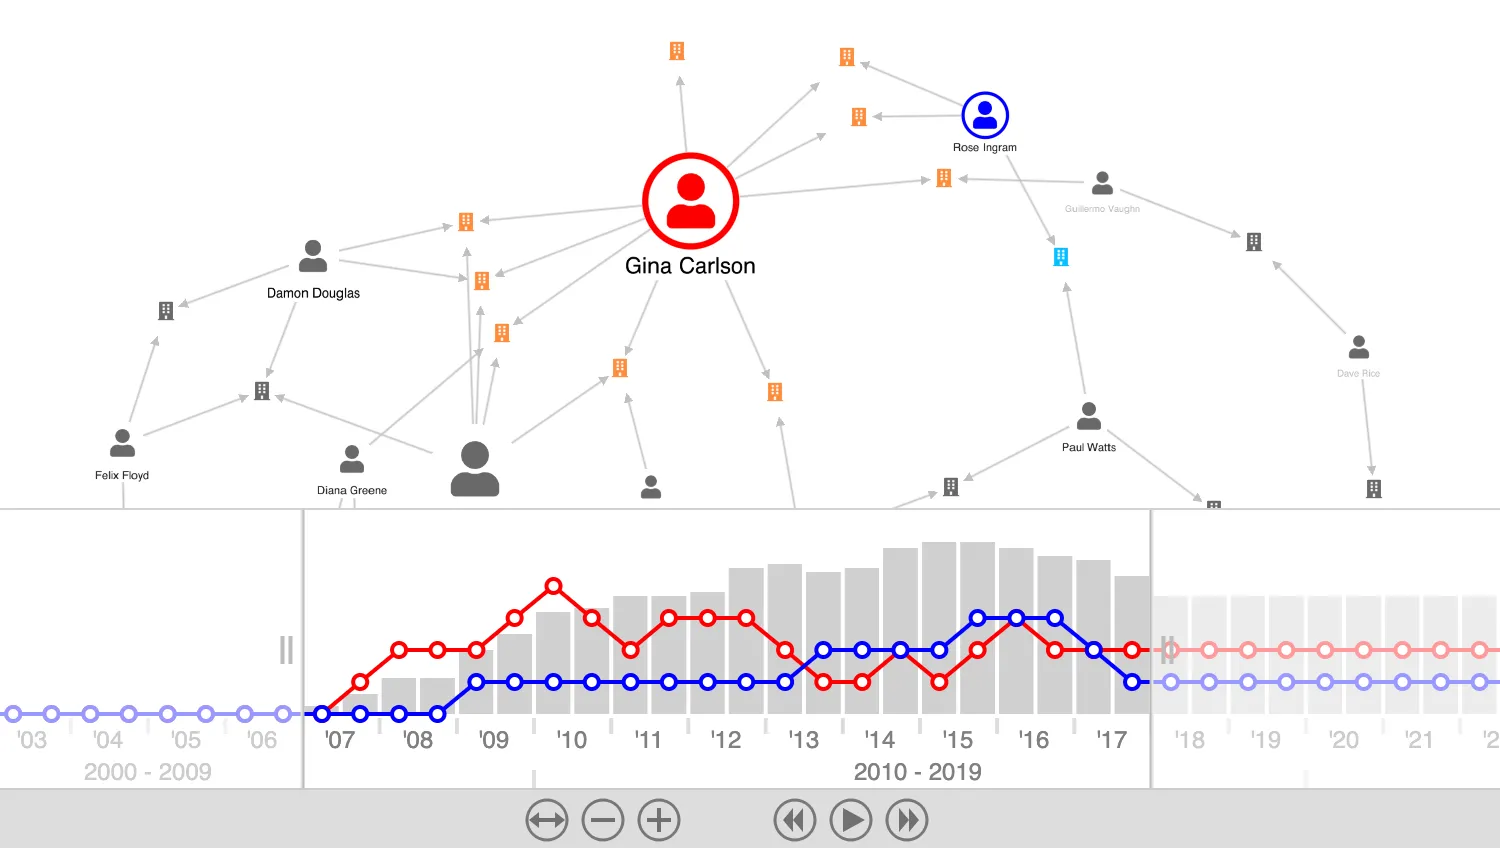
Time Periods
Show events that represent periods of time.
See example