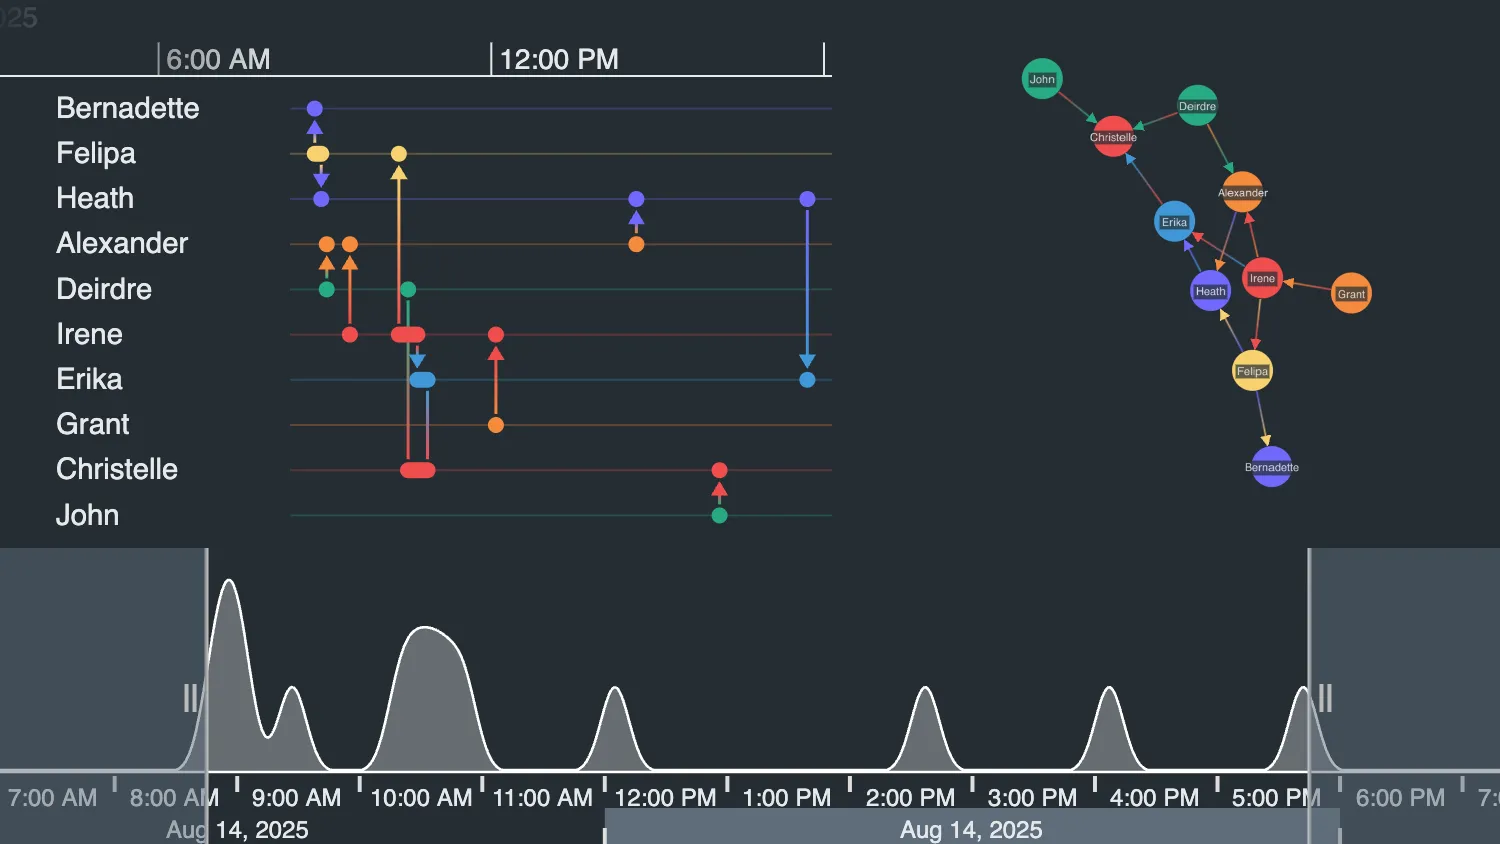
Pan or zoom the timeline or drag the time bar sliders to adjust the visible time range and filter the chart.
This example shows a simple integration between the KronoGraph timeline and a chart and time bar provided by KeyLines.
See also:
Pan or zoom the timeline or drag the time bar sliders to adjust the visible time range and filter the chart.
This example shows a simple integration between the KronoGraph timeline and a chart and time bar provided by ReGraph.
See also:
import { createTimeline } from "kronograph";
import KeyLines from "keylines";
import {
  chartData,
  chartOptions,
  timelineData,
  timelineOptions,
  timebarOptions,
} from "./data";
import { isEmpty } from "lodash";

let ignoreTimebarEvents = false;

function setupTimeline() {
  const timeline = createTimeline({
    container: "timeline-container",
    options: timelineOptions,
  });
  timeline.set(timelineData);
  timeline.fit();
  return timeline;
}

async function setupTimebar() {
  const timebar = await KeyLines.create({
    container: "timebar-container",
    type: "timebar",
    options: timebarOptions,
  });
  await timebar.load(chartData);
  await timebar.zoom("fit");
  return timebar;
}

async function setupChart() {
  const chart = await KeyLines.create({
    container: "chart-container",
    type: "chart",
    options: chartOptions,
  });
  await chart.load(chartData);
  await chart.layout();
  await chart.zoom("fit");
  return chart;
}

async function main() {
  const timeline = setupTimeline();
  const [chart, timebar] = await Promise.all([setupChart(), setupTimebar()]);

  async function filterChart() {
    const { entities: visibleEntityIds } = timeline.getInRangeItems();
    const filterOptions = { type: "node", animate: false };
    const { shown, hidden } = await chart.filter(
      ({ id }) => visibleEntityIds[id],
      filterOptions,
    );
    if (!isEmpty(shown.nodes) || !isEmpty(hidden.nodes)) {
      await chart.layout("organic");
    }
  }

  chart.on("selection-change", () => {
    timeline.focus(chart.selection());
    filterChart();
  });

  // prevent selection of links
  chart.on("click", (ev) => {
    if (ev.id) {
      const item = chart.getItem(ev.id);
      if (item.type === "link") {
        ev.preventDefault();
      }
    }
  });

  timeline.on("range", async ({ start, end }) => {
    // The range of the KronoGraph timeline has just changed.
    // We respond to this by updating the range of the KeyLines timebar.
    // This will cause the KeyLines timebar to emit a "change" event,
    // but we don't want that to cause the timeline range to be set again,
    // so we make sure this ignoreTimebarEvents flag is set while the timebar "change" event fires.
    ignoreTimebarEvents = true;
    await timebar.range(start, end, { animate: false });
    ignoreTimebarEvents = false;
    filterChart();
  });

  timeline.on("focus", () => {
    chart.selection(timeline.focus());
    filterChart();
  });

  timebar.on("change", ({ type }) => {
    if (type === "range" && !ignoreTimebarEvents) {
      const { dt1, dt2 } = timebar.range();
      timeline.range(dt1, dt2);
      filterChart();
    }
  });
}

main();const colorPalette = {
lightBlueGray: "#e5e8eb",
darkBlueGray: "#242c32",
darkBlueGrayAlpha: "rgba(36, 44, 50, 0.8)",
blueGray: "#606d7b",
blueGrayAlpha: "rgba(96, 109, 123, 0.5)",
orange: "#f58a3d",
purple: "#7069FA",
red: "#ef4e4e",
blue: "#4098D7",
yellow: "#f7d06e",
teal: "#27ab83",
};
export const timelineOptions = {
focus: {
backgroundColor: colorPalette.blueGray,
},
scales: { showAtBottom: false },
};
export const chartOptions = {
backgroundAlpha: 0.3,
backColour: colorPalette.darkBlueGray,
selectionColour: colorPalette.blueGray,
navigation: { shown: false },
controlTheme: "dark",
handMode: true,
minZoom: 0.2,
overview: false,
};
export const timebarOptions = {
backColour: colorPalette.darkBlueGray,
sliders: "free",
area: { colour: "white" },
type: "area",
controlBarTheme: "dark",
sliderColour: colorPalette.blueGrayAlpha,
showControlBar: false,
fontColour: colorPalette.lightBlueGray,
scale: { highlightColour: colorPalette.blueGray },
};
const nodes = [
{ t: "Alexander", c: colorPalette.orange },
{ t: "Bernadette", c: colorPalette.purple },
{ t: "Christelle", c: colorPalette.red },
{ t: "Deirdre", c: colorPalette.teal },
{ t: "Erika", c: colorPalette.blue },
{ t: "Felipa", c: colorPalette.yellow },
{ t: "Grant", c: colorPalette.orange },
{ t: "Heath", c: colorPalette.purple },
{ t: "Irene", c: colorPalette.red },
{ t: "John", c: colorPalette.teal },
].map((node, idx) => {
return {
...node,
type: "node",
id: `${idx + 1}`,
fc: colorPalette.lightBlueGray, // label text color
fbc: colorPalette.darkBlueGrayAlpha, // label text background color
};
});
const linkInfo = [
{ id: "a1", time: 1755157740000, id1: "6", id2: "2" },
{ id: "a2", time: 1755158160000, id1: "6", id2: "8" },
{ id: "a3", time: 1755158520000, id1: "4", id2: "1" },
{ id: "a4", time: 1755160020000, id1: "9", id2: "1" },
{ id: "a5", time: 1755163200000, id1: "9", id2: "6" },
{ id: "a6", time: 1755163800000, id1: "4", id2: "3" },
{ id: "a7", time: 1755164400000, id1: "9", id2: "5" },
{ id: "a8", time: 1755165060000, id1: "5", id2: "3" },
{ id: "a9", time: 1755169500000, id1: "7", id2: "9" },
{ id: "a10", time: 1755178620000, id1: "1", id2: "8" },
{ id: "a11", time: 1755184020000, id1: "10", id2: "3" },
{ id: "a12", time: 1755189720000, id1: "8", id2: "5" },
];
const links = linkInfo.map((link) => {
const { c: c2 } = nodes.find((node) => node.id === link.id1);
const { c } = nodes.find((node) => node.id === link.id2);
return {
...link,
type: "link",
c, // color at id1 end
c2, // color at id2 end
a2: true, // show arrow at id2 end
w: 1.5, // width
dt: [new Date(link.time)], // time
};
});
export const chartData = {
type: "LinkChart",
items: [...nodes, ...links],
};
const entities = {};
const events = {};
linkInfo.forEach((link) => {
events[link.id] = {
time: new Date(link.time),
entityIds: [link.id1, link.id2],
};
});
nodes.forEach((node) => {
entities[node.id] = { color: node.c, label: node.t };
});
export const timelineData = { events, entities };<!doctype html>
<html>
<head>
<link rel="stylesheet" href="@ci/theme/kg/css/examples.css" />
</head>
<body>
<div style="display: flex; flex-direction: column; height: 100vh">
<div style="display: flex; flex: 3; min-height: 0">
<div id="timeline-container" style="flex: 3 1 200px"></div>
<div id="chart-container" style="flex: 2 1 200px; min-width: 0"></div>
</div>
<div id="timebar-container" style="flex: 0 1 150px; min-height: 0"></div>
</div>
<script type="module" src="./code.js"></script>
</body>
</html>import React, { useEffect, useState, useRef } from "react";
import { createRoot } from "react-dom/client";
import Timeline from "kronograph/react/Timeline";
import { Chart, TimeBar } from "regraph";
import pickBy from "lodash/pickBy";
import zipObject from "lodash/zipObject";
import {
chartLinks,
chartNodes,
chartOptions,
timelineData,
timelineOptions,
timebarOptions,
} from "./data";
const allChartItems = { ...chartNodes, ...chartLinks };
function preventLinkSelection(event) {
if (chartLinks[event.id]) {
event.preventDefault();
}
}
export const Demo = () => {
const [range, setRange] = useState();
const [focus, setFocus] = useState([]);
const [chartItems, setChartItems] = useState(allChartItems);
const timeline = useRef(null);
useEffect(() => {
if (timeline.current) {
// When timeline range or focus changes, filter the items in the ReGraph chart.
const { entities, events } = timeline.current.getInRangeItems();
setChartItems(
pickBy(allChartItems, (_item, id) => events[id] || entities[id]),
);
}
}, [range, focus]);
function changeHandler({
range: newRange,
focus: newTimelineFocus,
selection: newChartSelection,
}) {
if (newTimelineFocus) {
setFocus(newTimelineFocus);
}
if (newRange) {
setRange(newRange);
}
if (newChartSelection) {
setFocus(Object.keys(newChartSelection));
}
}
const chartSelection = zipObject(
focus,
focus.map(() => true),
);
return (
<div style={{ display: "flex", flexDirection: "column", height: "100vh" }}>
<div style={{ display: "flex", flex: 3, minHeight: 0 }}>
<div id="timeline-container" style={{ flex: "3 1 200px", minWidth: 0 }}>
<Timeline
{...timelineData}
focus={focus}
options={timelineOptions}
onTimelineChange={changeHandler}
range={range}
ref={timeline}
/>
</div>
<div id="chart-container" style={{ flex: "2 1 200px", minWidth: 0 }}>
<Chart
onChange={changeHandler}
onClick={preventLinkSelection}
options={chartOptions}
items={chartItems}
selection={chartSelection}
/>
</div>
</div>
<div id="timebar-container" style={{ flex: "0 1 150px", minHeight: 0 }}>
<TimeBar
items={chartLinks}
mode="smooth"
options={timebarOptions}
onChange={changeHandler}
range={range}
animation={{ animate: false }}
/>
</div>
</div>
);
};
const root = createRoot(document.getElementById("my-timeline"));
root.render(<Demo />);import mapValues from "lodash/mapValues";
const colorPalette = {
lightBlueGray: "#e5e8eb",
darkBlueGray: "#242c32",
darkBlueGrayAlpha: "rgba(36, 44, 50, 0.8)",
blueGray: "#606d7b",
blueGrayAlpha: "rgba(96, 109, 123, 0.5)",
orange: "#f58a3d",
purple: "#7069FA",
red: "#ef4e4e",
blue: "#4098D7",
yellow: "#f7d06e",
teal: "#27ab83",
};
export const timelineOptions = {
focus: { backgroundColor: colorPalette.blueGray },
scales: { showAtBottom: false },
};
export const chartOptions = {
backgroundColor: colorPalette.darkBlueGray,
selection: { color: colorPalette.blueGray },
navigation: { visible: false },
controlTheme: "dark",
minZoom: 0.2,
overview: false,
};
export const chartNodes = mapValues(
{
1: { name: "Alexander", color: colorPalette.orange },
2: { name: "Bernadette", color: colorPalette.purple },
3: { name: "Christelle", color: colorPalette.red },
4: { name: "Deirdre", color: colorPalette.teal },
5: { name: "Erika", color: colorPalette.blue },
6: { name: "Felipa", color: colorPalette.yellow },
7: { name: "Grant", color: colorPalette.orange },
8: { name: "Heath", color: colorPalette.purple },
9: { name: "Irene", color: colorPalette.red },
10: { name: "John", color: colorPalette.teal },
},
({ name, color }) => {
return {
label: {
text: name,
backgroundColor: colorPalette.darkBlueGrayAlpha,
color: colorPalette.lightBlueGray,
},
color,
};
},
);
const linkInfo = {
a1: { time: Date.UTC(2025, 7, 14, 7, 49), id1: "6", id2: "2" },
a2: { time: Date.UTC(2025, 7, 14, 7, 56), id1: "6", id2: "8" },
a3: { time: Date.UTC(2025, 7, 14, 8, 2), id1: "4", id2: "1" },
a4: { time: Date.UTC(2025, 7, 14, 8, 27), id1: "9", id2: "1" },
a5: { time: Date.UTC(2025, 7, 14, 9, 20), id1: "9", id2: "6" },
a6: { time: Date.UTC(2025, 7, 14, 9, 30), id1: "4", id2: "3" },
a7: { time: Date.UTC(2025, 7, 14, 9, 40), id1: "9", id2: "5" },
a8: { time: Date.UTC(2025, 7, 14, 9, 51), id1: "5", id2: "3" },
a9: { time: Date.UTC(2025, 7, 14, 11, 5), id1: "7", id2: "9" },
a10: { time: Date.UTC(2025, 7, 14, 13, 37), id1: "1", id2: "8" },
a11: { time: Date.UTC(2025, 7, 14, 15, 7), id1: "10", id2: "3" },
a12: { time: Date.UTC(2025, 7, 14, 16, 42), id1: "8", id2: "5" },
};
export const chartLinks = mapValues(linkInfo, (link) => {
return {
id1: link.id1,
id2: link.id2,
color: chartNodes[link.id2].color,
end2: { color: chartNodes[link.id1].color, arrow: true },
times: [{ time: link.time }],
width: 1.5,
};
});
export const timebarOptions = {
backgroundColor: colorPalette.darkBlueGray,
sliders: { type: "free", color: colorPalette.blueGrayAlpha },
controlBarTheme: "dark",
labels: {
fontColor: colorPalette.lightBlueGray,
},
scale: { hoverColor: colorPalette.blueGray },
};
const entities = mapValues(chartNodes, (node) => {
return { label: node.label.text, color: node.color };
});
const events = mapValues(linkInfo, (link) => {
return {
time: new Date(link.time),
entityIds: [link.id1, link.id2],
};
});
export const timelineData = { events, entities };<!doctype html>
<html>
<head>
<link rel="stylesheet" href="@ci/theme/kg/css/examples.css" />
</head>
<body>
<div id="my-timeline" style="height: 100vh"></div>
<script type="module" src="./code.jsx"></script>
</body>
</html>