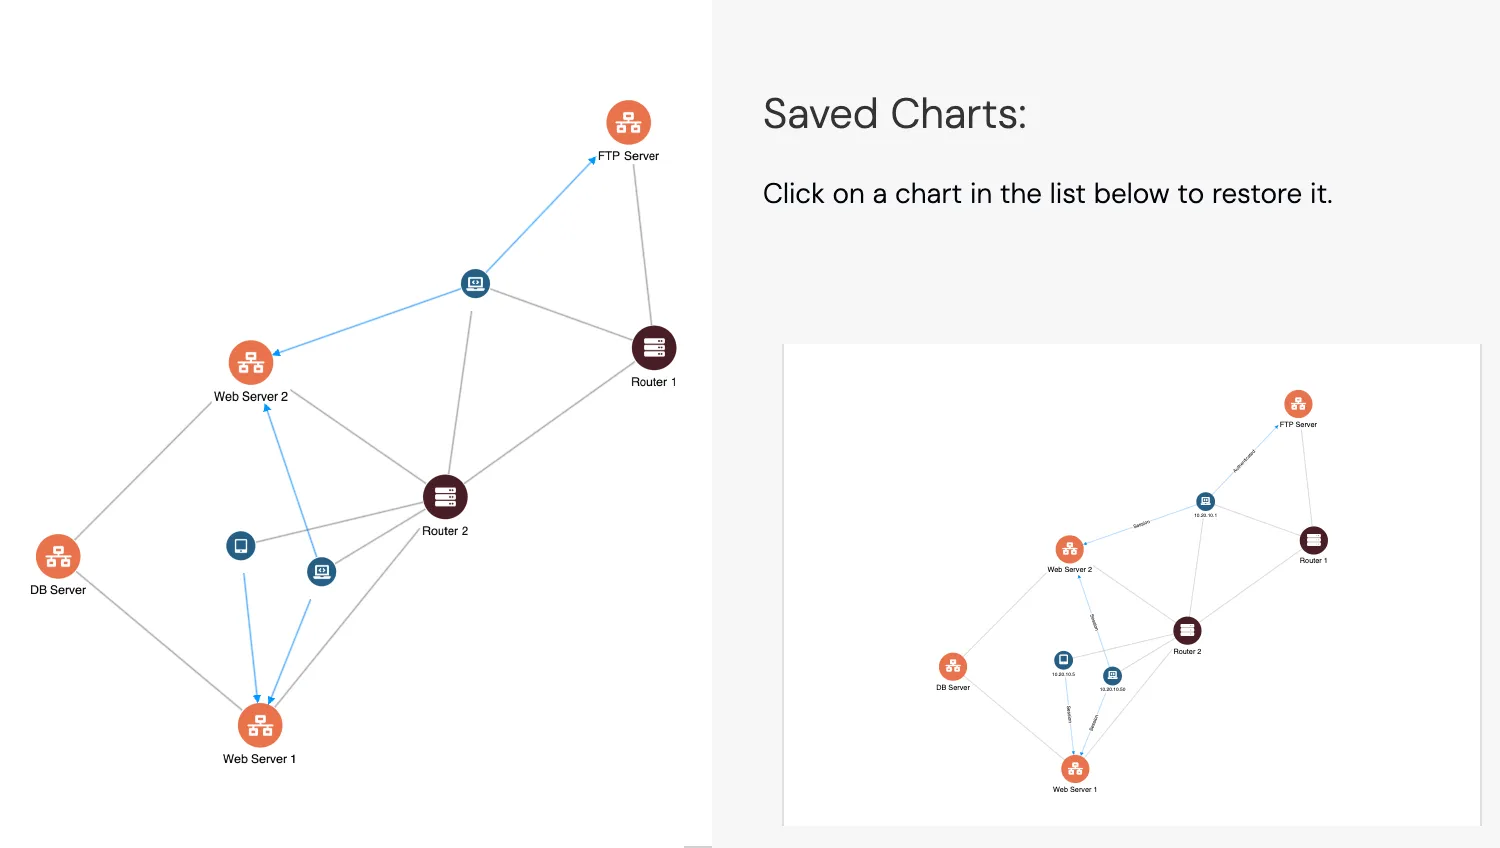
Users spend a lot of time arranging their networks by dragging nodes around to get a specific view. They will usually want to keep this state for a later point, so a common approach is to enable saving of charts.
This demo 'saves' the state, allowing you to retrieve it later in a load function. Although a real implementation would typically store charts in JSON format on a server, this demo simply saves the state in memory.
Advanced
If your data is from a database you may want to consider what happens when that data changes. How should a saved chart 'refresh' itself? You may want to warn a user if their data is out of date.
Key functions used:
import KeyLines from "keylines";
import getData from "./data.js";

let chart;

// local Database: just a JS Map object in this demo
// but it could also be a real DB in the server using
// an AJAX call to send the data
const dbStore = new Map();

// We're using this variable to create progressive ids
// for saved charts
let counter = 1;

// This boolean variable is used to prevent savings during state transitions
let hasLoaded = true;

const saveButton = document.getElementById("save");

async function restoreChart(evt) {
  // disable the button
  saveButton.classList.add("disabled");

  const previousSave = dbStore.get(evt.target.id);

  // set the restore flag to 'Dirty'
  hasLoaded = false;
  // restore the data
  await chart.load(previousSave);
  // allow changes to be savable
  hasLoaded = true;
}

async function saveChart() {
  // serialize chart
  const chartState = chart.serialize();

  // save a small image thumbnail of the chart
  const thumbnail = await chart.export({
    type: "svg",
    fitTo: { width: 348, height: 300 },
    fonts: {
      "Font Awesome 5 Free": {
        src: "./fonts/fontAwesome5/fa-solid-900.woff",
      },
    },
  });
  // set a name for the save
  const name = `Chart ${counter}`;
  counter++;

  // save the chart:
  // in this demo we're saving the serialized chart in this local storage
  // but it could also be sent with an AJAX call
  dbStore.set(name, chartState);

  // create a new entry in the list on the page
  const savePreviewContainer = document
    .getElementById("entryTemplate")
    .cloneNode(true);

  // set the image
  const img = savePreviewContainer.querySelector("img");
  img.src = thumbnail.url;
  img.alt = name;
  img.id = name;
  // add click event
  img.addEventListener("click", (event) => {
    restoreChart(event);
  });

  const deleteImg = savePreviewContainer.querySelector("#delete");
  deleteImg.addEventListener("click", () => {
    dbStore.delete(name);
    // The thumbnail image is retained by the browser so its very important
    // to free it when it's no longer needed
    URL.revokeObjectURL(thumbnail.url);
    savePreviewContainer.remove();
  });

  const savedCharts = document.getElementById("savedCharts");
  savedCharts.insertBefore(savePreviewContainer, savedCharts.firstChild);

  // disable the button
  saveButton.classList.add("disabled");
}

function checkChanges() {
  // don't catch events during the restore transition!
  if (hasLoaded) {
    // enable the save button
    saveButton.classList.remove("disabled");
  }
}

function getImageAlignment() {
  // Images are added to to the imageAlignment object
  // using their path as the key and an object describing the
  // adjustments to their position and scale as the value.
  const icons = {
    "fas fa-network-wired": { e: 0.7 },
    "fas fa-laptop-code": { e: 0.7 },
    "fas fa-tablet-alt": { e: 0.7 },
    "fas fa-server": { e: 0.7 },
  };

  const imageAlignment = {};

  // get a list of the font icon class names
  const iconNames = Object.keys(icons);
  iconNames.forEach((icon) => {
    // find the unicode value of each, and add to the imageAlignment object
    imageAlignment[icon] = icons[icon];
  });
  return imageAlignment;
}

function doLayout() {
  return chart.layout("organic", { tightness: 2 });
}

async function startKeyLines() {
  const imageAlignment = getImageAlignment();
  chart = await KeyLines.create({
    container: "klchart",
    options: {
      linkStyle: { inline: true },
      logo: "/public/images/Logo.png",
      iconFontFamily: "Font Awesome 5 Free",
      handMode: true,
      // Font icons and images can often be poorly aligned.
      // Set offsets to the icons to ensure they are centred correctly.
      imageAlignment,
    },
  });

  const data = await getData();
  chart.load(data);

  // these functions set up the drag over behaviour
  chart.on("prechange", checkChanges);
  chart.on("view-change", checkChanges);

  // redo the layout
  document.getElementById("layout").addEventListener("click", doLayout);

  // save the chart: fire it only if not disabled!
  saveButton.addEventListener("click", () => {
    if (!saveButton.classList.contains("disabled")) {
      saveChart();
    }
  });

  // save the first checkpoint after we've finished the layout
  await doLayout();
  saveChart();
}

async function loadFontsAndStart() {
  document.fonts.load('24px "Font Awesome 5 Free"').then(startKeyLines);
}

window.addEventListener("DOMContentLoaded", loadFontsAndStart);import KeyLines from "keylines";
// data styling definition
const nodeStyles = {
computer: {
c: "#255F85",
fi: {
c: "white",
t: "fas fa-laptop-code",
},
},
tablet: {
c: "#255F85",
fi: {
c: "white",
t: "fas fa-tablet-alt",
},
},
server: {
c: "#E9724C",
fi: {
c: "white",
t: "fas fa-network-wired",
},
e: 1.5,
},
router: {
c: "#481D24",
fi: {
c: "white",
t: "fas fa-server",
},
e: 1.5,
},
};
const linkStyles = {
session: {
t: "Session",
c: "rgb(0,153,255)",
fbc: "white",
},
auth: {
t: "Authenticated",
c: "rgb(0,153,255)",
fbc: "white",
},
};
// If an item has a type field apply the necessary styling
function styleData(data) {
const result = {
type: "LinkChart",
items: undefined,
};
result.items = data.items.map((item) => {
let style = {};
const transform = {};
if (item.d && item.d.type) {
if (item.type === "node") {
style = nodeStyles[item.d.type];
} else {
style = linkStyles[item.d.type];
}
}
if (style) {
// If theres a name prop, set it to the label
if (item.d && item.d.name) {
transform.t = item.d.name;
}
}
return Object.assign({}, item, style, transform);
});
return result;
}
export default async function getData() {
// fetch the raw data
const data = await (await fetch("/public/saveload-data.json")).json();
// Style each item from its type
return styleData(data);
}<!doctype html>
<html lang="en" style="background-color: #2d383f">
<head>
<meta charset="utf-8" />
<title>Save & Load Charts</title>
<link rel="stylesheet" type="text/css" href="@ci/theme/kl/css/keylines.css" />
<link rel="stylesheet" type="text/css" href="@ci/theme/kl/css/minimalsdk.css" />
<link rel="stylesheet" type="text/css" href="@ci/theme/kl/css/sdk-layout.css" />
<link rel="stylesheet" type="text/css" href="@ci/theme/kl/css/demo.css" />
<link
rel="stylesheet"
type="text/css"
href="@fortawesome/[email protected]/css/fontawesome.css"
/>
<link
rel="stylesheet"
type="text/css"
href="@fortawesome/[email protected]/css/solid.css"
/>
<link rel="stylesheet" href="./style.css" />
</head>
<body>
<div id="klchart" class="klchart"></div>
<div class="hidden">
<li class="savedChart" id="entryTemplate">
<a id="delete"><i class="fa fa-times"></i></a
><a class="thumbnail small text-center"><img class="saved" /></a>
</li>
</div>
<script type="module" src="./code.js"></script>
</body>
</html>img.saved {
object-fit: contain;
}
.thumbnail {
background: white;
height: 100%;
padding: 0px;
}
#delete {
display: none;
color: #333;
position: absolute;
right: 0px;
top: 0px;
margin: 8px;
background: transparent;
}
.savedChart {
position: relative;
height: auto;
width: auto;
text-align: center;
width: max-content;
margin: 0 auto;
}
.savedChart:hover #delete {
display: block;
}
.thumbnails li {
margin-bottom: 16px;
}
.thumbnails li:last-child {
margin-bottom: 0px;
}
#controlsTab.is-visible,
.is-visible #rhsForm {
display: flex;
flex: 1;
flex-direction: column;
}{
"type": "LinkChart",
"items": [
{
"id": "a",
"type": "node",
"d": {
"name": "FTP Server",
"type": "server"
}
},
{
"id": "b",
"type": "node",
"d": {
"type": "router",
"name": "Router 1"
}
},
{
"id": "c",
"type": "node",
"d": {
"type": "server",
"name": "Web Server 1"
}
},
{
"id": "d",
"type": "node",
"d": {
"type": "router",
"name": "Router 2"
}
},
{
"id": "e",
"type": "node",
"d": {
"type": "server",
"name": "DB Server"
}
},
{
"id": "f",
"type": "node",
"d": {
"type": "server",
"name": "Web Server 2"
}
},
{
"id": "g",
"type": "node",
"d": {
"type": "computer",
"name": "10.20.10.1"
}
},
{
"id": "h",
"type": "node",
"d": {
"type": "tablet",
"name": "10.20.10.5"
}
},
{
"id": "j",
"type": "node",
"d": {
"type": "computer",
"name": "10.20.10.50"
}
},
{
"id": "ab",
"id1": "a",
"id2": "b",
"type": "link"
},
{
"id": "bd",
"id1": "b",
"id2": "d",
"type": "link"
},
{
"id": "cd",
"id1": "c",
"id2": "d",
"type": "link"
},
{
"id": "ce",
"id1": "c",
"id2": "e",
"type": "link"
},
{
"id": "fd",
"id1": "f",
"id2": "d",
"type": "link"
},
{
"id": "fe",
"id1": "f",
"id2": "e",
"type": "link"
},
{
"id": "gb",
"id1": "g",
"id2": "b",
"type": "link"
},
{
"id": "gd",
"id1": "g",
"id2": "d",
"type": "link"
},
{
"id": "hd",
"id1": "h",
"id2": "d",
"type": "link"
},
{
"id": "jd",
"id1": "j",
"id2": "d",
"type": "link"
},
{
"id": "ga",
"id1": "g",
"id2": "a",
"type": "link",
"a2": true,
"d": {
"type": "auth"
}
},
{
"id": "gc",
"id1": "g",
"id2": "f",
"type": "link",
"a2": true,
"d": {
"type": "session"
}
},
{
"id": "hc",
"id1": "h",
"id2": "c",
"type": "link",
"a2": true,
"d": {
"type": "session"
}
},
{
"id": "jf",
"id1": "j",
"id2": "f",
"type": "link",
"a2": true,
"d": {
"type": "session"
}
},
{
"id": "jc",
"id1": "j",
"id2": "c",
"type": "link",
"a2": true,
"d": {
"type": "session"
}
}
]
}