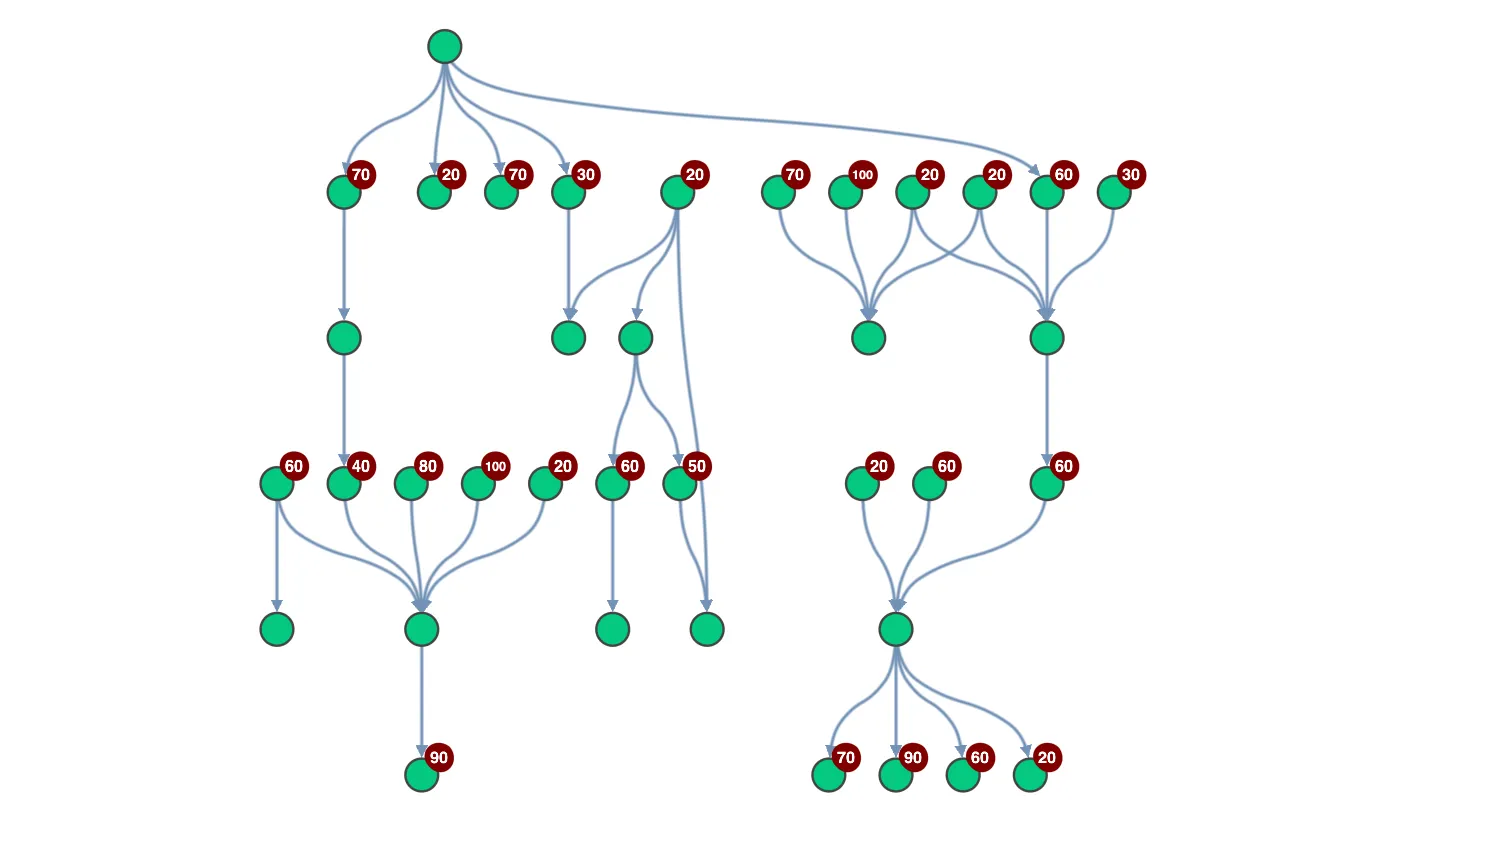
The sequential layout displays nodes on distinct levels and with a clear sequence of links between them, all while minimising link crossings as much as possible.
Order of levels
Sequential can control the hierarchical order of levels:
- Automatic - if no levels or top nodes are defined, levels are inferred using the arrows on links
- Selected nodes first - using the top property, selected nodes are placed at the top
- Predefined - nodes are placed in the hierarchy according to their level value
Order within levels
Sequential layout can also order the items within each level according to the value in property and the order in sortBy in the orderBy object.
Styling
The ordering options apply for all layout orientations. Custom stretch between levels makes the most of available screen space while using curved links instantly changes the appearance of the chart.
Key functions used:
import KeyLines from "keylines";
import data from "./data.js";

let chart;
let generatedData;
let maxLevels;
const options = {
  multiComp: false,
};

const linkShapeInputs = [
  ...document.querySelectorAll('input[name="linkshape"]'),
];
const orientationInputs = [
  ...document.querySelectorAll('input[name="orientation"]'),
];
const generateDataEl = document.getElementById("generate");
const levelOrderingInputs = [
  ...document.querySelectorAll('input[name="levelOrdering"]'),
];
const orderByInputs = [...document.querySelectorAll('input[name="orderBy"]')];
const stretchSliderEl = document.getElementById("stretchSlider");
const stretchSliderInput = document.querySelector('input[name="stretch"]');

// Return a colour gradient scale by adjusting the alpha value based on the max levels
function getColourScale() {
  const colourScale = [];
  const startColour = { r: 0, g: 201, b: 128 };
  const endColour = { r: 255, g: 255, b: 255 };

  const deltaR = (endColour.r - startColour.r) / maxLevels;
  const deltaG = (endColour.g - startColour.g) / maxLevels;
  const deltaB = (endColour.b - startColour.b) / maxLevels;

  colourScale.push(`rgb(${startColour.r}, ${startColour.g}, ${startColour.b})`);
  for (let i = 1; i <= maxLevels; i++) {
    colourScale.push(
      `rgb(${Math.round(startColour.r + deltaR * i)}, ${Math.round(
        startColour.g + deltaG * i,
      )}, ${Math.round(startColour.b + deltaB * i)})`,
    );
  }

  return colourScale;
}

function resetLevelColourScale(isUniform) {
  const colourScale = getColourScale();
  const props = [];
  chart.each({ type: "node" }, ({ id, d }) =>
    props.push(
      isUniform
        ? // Revert to the same colour for all nodes
          { id, c: "rgb(0, 201, 128)", fc: "rgba(0,0,0,0)" }
        : // Set the colour scale on the level assignment
          { id, c: colourScale[d.level], fc: "rgb(0,0,0)" },
    ),
  );
  chart.setProperties(props);
}

function resetGlyphs(show) {
  // rescale number glyphs to distinguish them in the UI from level numbers
  const scale = 10;
  const props = [];

  chart.each({ type: "node" }, ({ id, d }) => {
    const g =
      show && d.col !== void 0
        ? [
            {
              id,
              t: d.col * scale,
              c: "rgb(128, 0, 0)",
              p: 45,
              r: 40,
              e: 3,
              b: null,
            },
          ]
        : null;
    props.push({ id, g });
  });

  chart.setProperties(props);
}

// Runs a sequential layout from the selected layout options
function runLayout() {
  // Collect the layout options selected
  const selectedNodes = chart
    .selection()
    .filter((item) => chart.getItem(item).type === "node");
  const orientation = document.querySelector(
    'input[name="orientation"]:checked',
  ).value;
  const stretch = document.querySelector('input[name="stretch"]').value;
  const linkShape = document.querySelector(
    'input[name="linkshape"]:checked',
  ).value;
  const layoutOpts = { stretch, orientation, linkShape };

  // Get the current level ordering criteria
  const orderMethod = document.querySelector(
    'input[name="levelOrdering"]:checked',
  ).value;

  if (orderMethod === "levels") {
    // A colour gradient is used to highlight the ordering
    resetLevelColourScale(false);
    // The level value is used to assign levels
    layoutOpts.level = "level";
  } else {
    resetLevelColourScale(true);
    if (orderMethod === "top" && selectedNodes.length > 0) {
      // Selected nodes from the chart will be placed at the top of the hierarchy
      layoutOpts.top = selectedNodes;
    }
    // The default is auto levels are used to assign levels
  }

  // always show orderBy glyphs
  resetGlyphs(true);

  // Get the current column ordering criteria
  const orderBy = document.querySelector('input[name="orderBy"]:checked');
  layoutOpts.orderBy = {
    property: orderBy.getAttribute("property"),
    sortBy: orderBy.getAttribute("sortBy"),
  };

  chart.layout("sequential", layoutOpts);
}

function generateChartData() {
  // Decide how many components we want
  // Bias towards just a single component and occasionally leave it to fate
  // Always display a single component on load
  if (options.multiComp && Math.random() > 0.6) {
    options.comps = Math.ceil(Math.random() * 3);
  } else {
    options.comps = 1;
  }

  generatedData = data.generate(options);
  // Get the max number of levels generated
  maxLevels = generatedData.chartLevel;
  chart.load(generatedData.chartData);
  options.multiComp = true;
  runLayout();
}

function marqueeDragStartHandler({ type }) {
  if (type === "marquee") {
    chart.off("selection-change", runLayout);
  }
}

function marqueeDragEndHandler({ type }) {
  if (type === "marquee") {
    chart.on("selection-change", runLayout);
    runLayout();
  }
}

function levelOrderingHandler(e) {
  if (e.target.value === "top") {
    chart.on("drag-start", marqueeDragStartHandler);
    chart.on("drag-end", marqueeDragEndHandler);
    chart.on("selection-change", runLayout);
  } else {
    chart.off("drag-start", marqueeDragStartHandler);
    chart.off("drag-end", marqueeDragEndHandler);
    chart.off("selection-change", runLayout);
  }
  runLayout();
}

function addEventHandlers() {
  chart.on("drag-start", ({ type, setDragOptions }) => {
    if (type === "node") {
      setDragOptions({ type: "pan" });
    }
  });

  // Generate a new chart
  generateDataEl.addEventListener("click", generateChartData);

  // Change link style
  linkShapeInputs.forEach((input) => {
    input.addEventListener("change", () => {
      runLayout();
    });
  });

  stretchSliderInput.addEventListener("change", () => {
    // Update the slider value on the UI
    const sliderValue = stretchSliderEl.value;
    document.getElementById("stretchVal").innerHTML = ` ${sliderValue}`;
    runLayout();
  });

  orientationInputs.forEach((input) => {
    input.addEventListener("change", () => {
      runLayout();
    });
  });

  levelOrderingInputs.forEach((input) => {
    input.addEventListener("change", levelOrderingHandler);
  });

  orderByInputs.forEach((input) => {
    input.addEventListener("change", runLayout);
  });
}

async function startKeyLines() {
  const chartOptions = {
    logo: { u: "/public/images/Logo.png" },
    handMode: true,
    selectedNode: {
      ha0: {
        c: "rgb(255, 156, 161)",
        w: 10,
        r: 40,
      },
    },
  };

  chart = await KeyLines.create({
    container: "klchart",
    options: chartOptions,
  });

  addEventHandlers();
  generateChartData();
}

window.addEventListener("DOMContentLoaded", startKeyLines);let seed = 679;
let chartLevel;
const data = (() => {
let nextID = 1;
function pseudoRandom() {
const x = Math.sin(seed++) * 10000;
return x - Math.floor(x);
}
function randInt(n) {
return Math.floor(pseudoRandom() * n);
}
function randIntBetween(min, max) {
return min + randInt(max + 1 - min);
}
function makeNode(level) {
return {
type: "node",
id: nextID++,
c: "rgb(0,128,128)",
d: { level },
t: level,
fs: 30,
fbc: "rgba(0,0,0,0)",
b: "rgb(68, 68, 68)",
};
}
function makeLink(a, b, direction, long) {
const link = {
type: "link",
id: `${a.id}-${b.id}`,
id1: a.id,
id2: b.id,
w: 5,
c: "rgb(115,146,183)",
};
if (direction) {
link.a1 = direction === "in";
if (direction === "out") {
if (Math.random() < 0.7 || long) {
link.a2 = true;
} else link.a1 = true;
}
}
return link;
}
function generateLongLinks(levelMap) {
const links = [];
// only add links on every odd level
for (let i = 1; i < levelMap.length; i += 2) {
if (levelMap[i + 3]) {
const thisLayer = levelMap[i];
const from = thisLayer[randIntBetween(0, thisLayer.length - 1)];
const nextLayer = levelMap[i + 3];
const to = nextLayer[randIntBetween(0, nextLayer.length - 1)];
const link = makeLink(from, to, "out", true);
links.push(link);
}
}
return links;
}
function assignManualOrderBy(levelMap) {
if (levelMap.length < 2) {
return;
}
// pick k rows in size order (largest first)
let k = randIntBetween(1, Math.ceil(Math.sqrt(levelMap.length)));
const sortedLevels = levelMap.slice(0).sort((a, b) => b.length - a.length);
while (k-- > 0) {
const lvl = sortedLevels.shift();
const n = lvl.length;
for (let i = 0; i < n; i++) {
lvl[i].d.col = randIntBetween(1, n);
}
}
}
function generateInOutNodes(options, targetNode, direction) {
const generated = { nodes: [], links: [] };
let num = randInt(3);
// bias to having more outputs than inputs (helps create longer chains)
if (direction === "out") {
num += randInt(3);
}
const level =
direction === "in" ? targetNode.d.level - 1 : targetNode.d.level + 1;
for (let k = 0; k < num; k++) {
const node = makeNode(level);
generated.nodes.push(node);
generated.links.push(makeLink(targetNode, node, direction));
}
return generated;
}
// This generates random hierarchical data
function generateChainedComponent(min, max, options) {
let nodes = [];
let links = [];
let i;
let j;
let parentTransaction;
const topNode = makeNode(0);
nodes.push(topNode);
// indices into nodes indicating range of parent nodes
let levelStart = 0;
let levelEnd = nodes.length;
// loop around each level we want to create
for (i = 1; i < max; i++) {
// loop around the transaction nodes created in the previous level
for (j = levelStart; j < levelEnd; j++) {
parentTransaction = nodes[j];
if (j !== 0) {
const inputs = generateInOutNodes(options, parentTransaction, "in");
nodes = nodes.concat(inputs.nodes);
links = links.concat(inputs.links);
}
}
const outputsStart = nodes.length;
do {
for (j = levelStart; j < levelEnd; j++) {
parentTransaction = nodes[j];
const outputs = generateInOutNodes(options, parentTransaction, "out");
nodes = nodes.concat(outputs.nodes);
links = links.concat(outputs.links);
}
} while (i < min && outputsStart + 3 > nodes.length);
// Loop around the outputs in the previous level
const outputsEnd = nodes.length;
do {
for (j = outputsStart; j < outputsEnd; j++) {
const inOutNode = nodes[j];
if (randInt(10) > 4) {
const transactionNode = makeNode(2 * i);
const link = makeLink(transactionNode, inOutNode, "in");
nodes.push(transactionNode);
links.push(link);
}
}
} while (i < min && outputsEnd === nodes.length);
// Get the range of transactions to loop over next
levelStart = outputsEnd;
levelEnd = nodes.length;
}
const levelMap = [];
nodes.forEach((n) => {
if (!levelMap[n.d.level]) {
levelMap[n.d.level] = [];
}
levelMap[n.d.level].push(n);
});
assignManualOrderBy(levelMap);
chartLevel = Math.max(levelMap.length, chartLevel);
const longLinks = generateLongLinks(levelMap);
options.longs.push(...longLinks);
if (options.longLinks) {
links.push(...longLinks);
}
// Finally, return all items
return nodes.concat(links);
}
return {
generate(options) {
const opts = {
longs: [],
};
if (options) {
Object.keys(options).forEach((o) => {
opts[o] = options[o];
});
}
// Bias towards smaller charts, but make a small number of them a bit bigger
let max = 4;
if (randInt(10) < 3) {
max++;
} else if (randInt(10) <= 1) {
max += 2;
}
let items = [];
chartLevel = 0;
for (let i = 0; i < (options.comps || 1); i++) {
items.push(...generateChainedComponent(3, max, opts));
}
seed++;
items = [...items, ...opts.longs];
return { chartData: { type: "LinkChart", items }, chartLevel };
},
};
})();
export default data;<!doctype html>
<html lang="en" style="background-color: #2d383f">
<head>
<meta charset="utf-8" />
<title>Display Hierarchies</title>
<link rel="stylesheet" type="text/css" href="@ci/theme/kl/css/keylines.css" />
<link rel="stylesheet" type="text/css" href="@ci/theme/kl/css/minimalsdk.css" />
<link rel="stylesheet" type="text/css" href="@ci/theme/kl/css/sdk-layout.css" />
<link rel="stylesheet" type="text/css" href="@ci/theme/kl/css/demo.css" />
</head>
<body>
<div id="klchart" class="klchart"></div>
<script type="module" src="./code.js"></script>
</body>
</html>