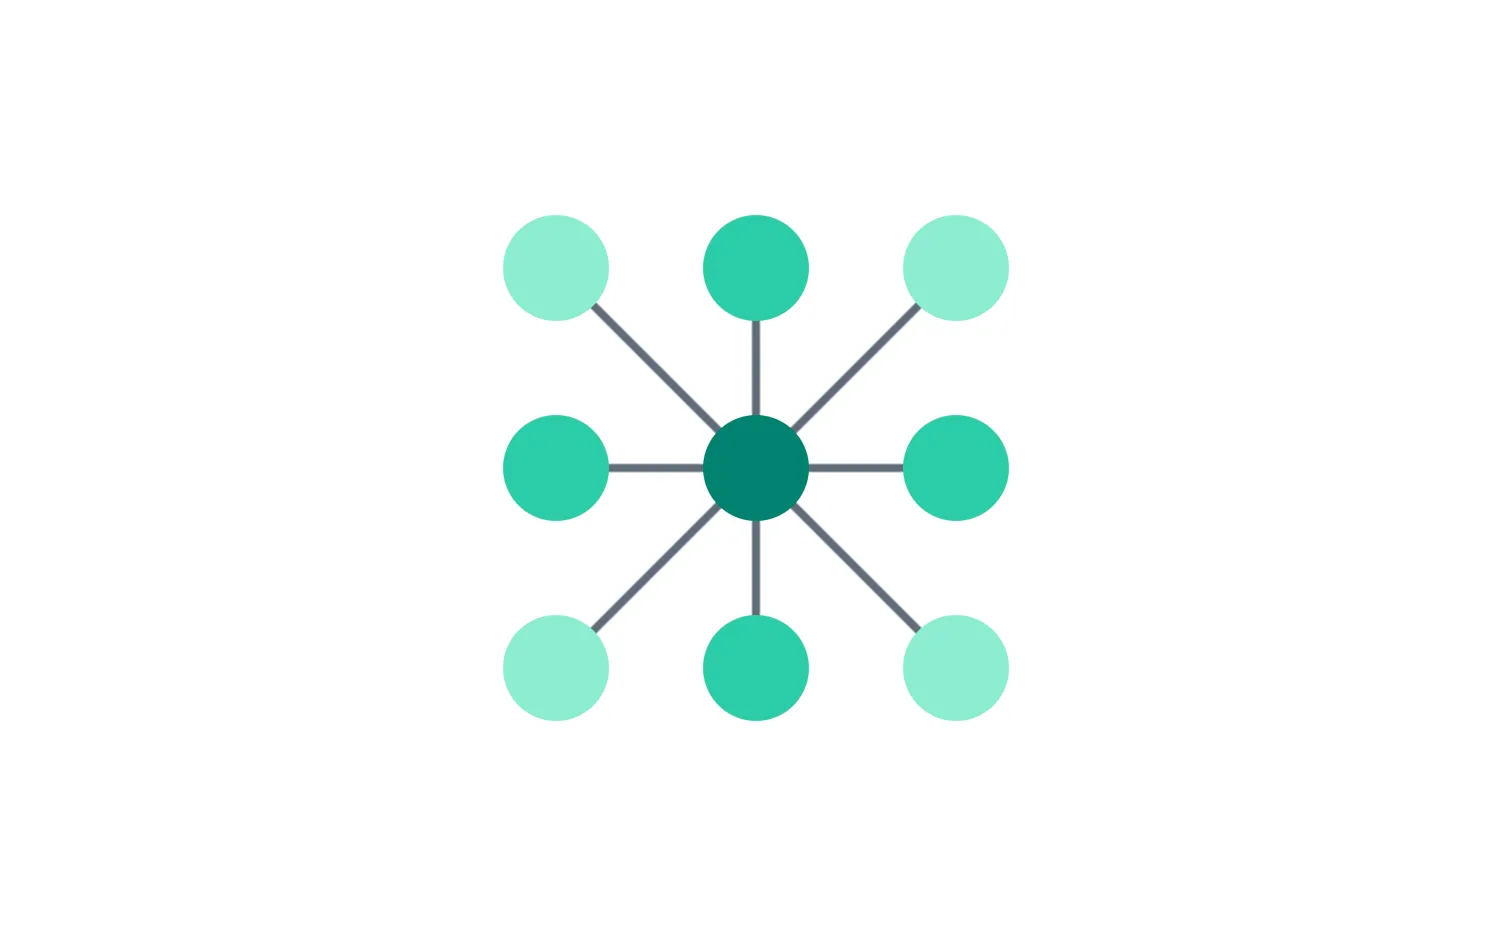
Drag nodes to see them snap to a grid.
You can fully customize drag behavior using ReGraph's drag events.
This example illustrates nodes snapping to grid as they're dragged. To let users drag nodes freely until they snap to grid at the end, handle the onDragEnd event instead.
See also
import React, { useRef, useState } from "react";
import { createRoot } from "react-dom/client";

import { Chart } from "regraph";

import { chartOptions, data } from "./data";

export const Demo = () => (
  <SnapToGrid items={data.items} positions={data.positions} />
);

function SnapToGrid(props) {
  const { items, positions } = props;
  const chartRef = useRef(null);
  const chartWrapper = useRef(null);
  const [state, setState] = useState({
    dragTarget: null,
    positions,
  });

  const onDragStartHandler = ({ type, id, preventDefault }) => {
    if (type === "node") {
      preventDefault();
      // store the drag target.
      // To let users drag nodes freely, so that they only snap to grid at their end position,
      // handle everything using the onDragEnd event instead.
      setState((current) => {
        return { ...current, dragTarget: id };
      });
    } else {
      setState((current) => {
        return { ...current, dragTarget: null };
      });
    }
  };

  const onDragHandler = ({ x, y }) => {
    if (state.dragTarget) {
      // only move if mouse is over the chart
      const boundingRect = chartWrapper.current.getBoundingClientRect();
      if (
        x >= boundingRect.left &&
        x <= boundingRect.right &&
        y >= boundingRect.top &&
        y <= boundingRect.bottom
      ) {
        // convert mouse position to world coordinates
        const chartPos = chartRef.current.worldCoordinates(x, y);
        // add snapping rules
        const snappedPos = {
          x: Math.round(chartPos.x / 100) * 100,
          y: Math.round(chartPos.y / 100) * 100,
        };
        setState((current) => {
          return {
            ...current,
            positions: {
              ...current.positions,
              [state.dragTarget]: snappedPos,
            },
          };
        });
      }
    }
  };

  return (
    <div ref={chartWrapper} style={{ width: "100%", height: "100%" }}>
      <Chart
        items={items}
        ref={chartRef}
        animation={{ animate: false }}
        positions={state.positions}
        options={chartOptions}
        onDragStart={onDragStartHandler}
        onDrag={onDragHandler}
      />
    </div>
  );
}

const root = createRoot(document.getElementById("regraph"));
root.render(<Demo />);import { style } from "@ci/theme/rg/js/storyStyles";
const data = {
items: {
id1: { ...style.primary0 },
id2: { ...style.primary1 },
id3: { ...style.primary0 },
id4: { ...style.primary1 },
id5: { ...style.primary2 },
id6: { ...style.primary1 },
id7: { ...style.primary0 },
id8: { ...style.primary1 },
id9: { ...style.primary0 },
link1: { id1: "id5", id2: "id2", ...style.link },
link2: { id1: "id5", id2: "id6", ...style.link },
link3: { id1: "id5", id2: "id4", ...style.link },
link4: { id1: "id5", id2: "id8", ...style.link },
link5: { id1: "id5", id2: "id1", ...style.link },
link6: { id1: "id5", id2: "id3", ...style.link },
link7: { id1: "id5", id2: "id7", ...style.link },
link8: { id1: "id5", id2: "id9", ...style.link },
},
positions: {
id1: { x: 100, y: 100 },
id2: { x: 0, y: 100 },
id3: { x: -100, y: 100 },
id4: { x: 100, y: 0 },
id5: { x: 0, y: 0 },
id6: { x: -100, y: 0 },
id7: { x: 100, y: -100 },
id8: { x: 0, y: -100 },
id9: { x: -100, y: -100 },
},
};
const chartOptions = {
dragPan: false,
fit: "none",
navigation: false,
overview: false,
selection: { color: style.colors.transparent },
};
export { data, chartOptions };<!doctype html>
<html>
<body>
<div id="regraph" style="height: 100vh"></div>
<script type="module" src="./code.jsx"></script>
</body>
</html>