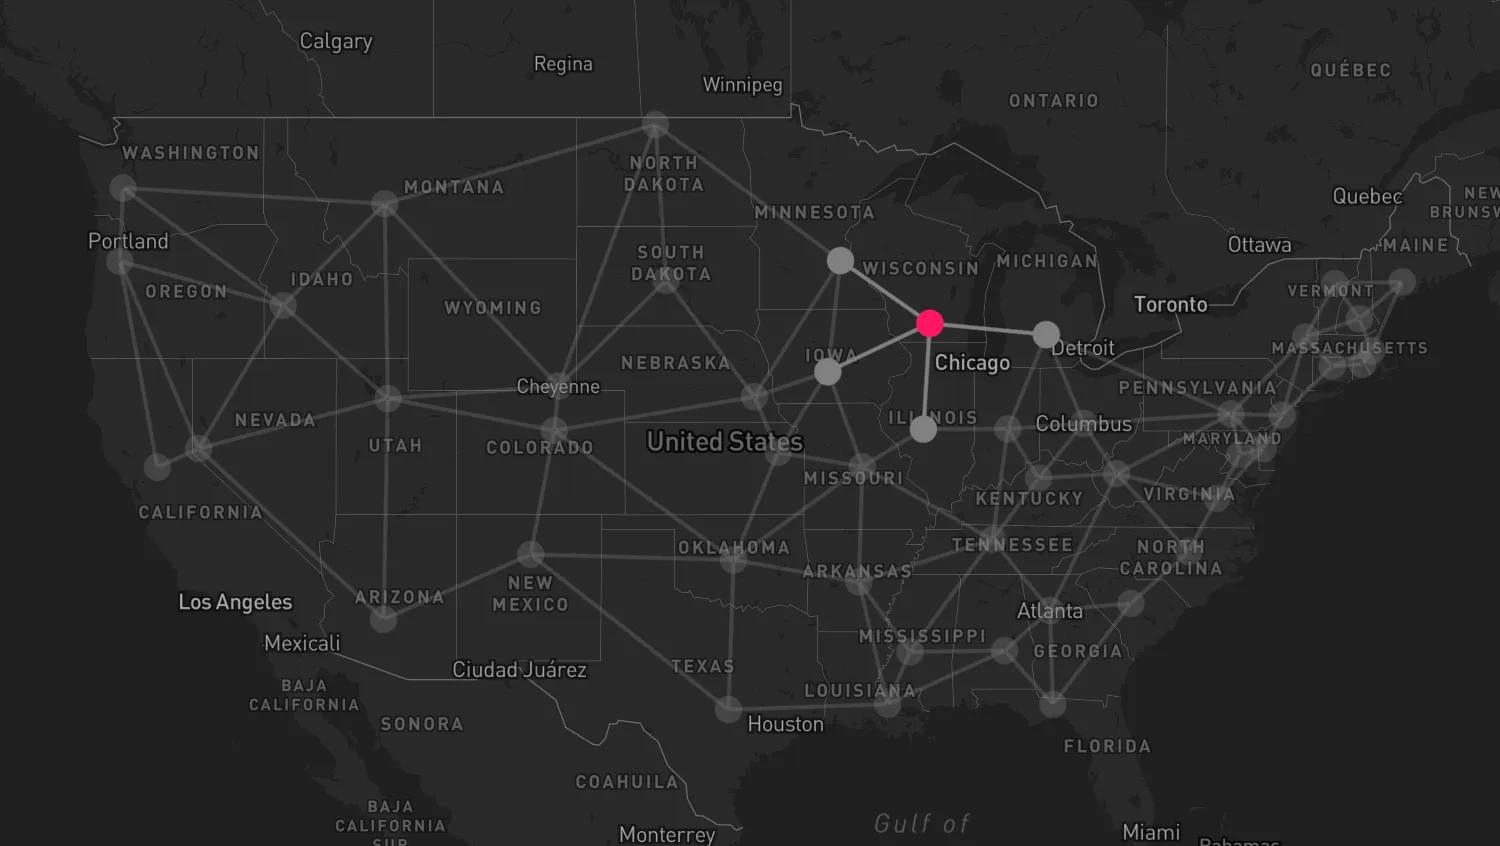
Hover over a node to highlight it together with its neighboring nodes.
When a network layer has many nodes and links, you can use the neighbors() graph analysis function find the connected nodes and links, then use overrideStyle()overrideStyles to highlight them.
- Graph Analysis docs
- Override Item Styles docs
import { MapWeave } from "mapweave/mapbox";
import { NetworkLayer } from "mapweave/layers";
import { networkData, highlightColor } from "./data";

const mapweave = new MapWeave({
  container: "mw",
  options: { accessToken: VITE_MAPBOX_API_KEY },
});
const networkLayer = new NetworkLayer({ data: networkData });

mapweave.addLayer(networkLayer);
mapweave.fitBounds();

networkLayer.options({ foreground: { backgroundOpacity: 0.3 } });

let hoverStyleReset = null;
let hoveredId = null;

mapweave.on("hover", ({ item, id }) => {
  const nodeId = item?.type === "node" ? id : null;
  if (nodeId !== hoveredId) {
    hoverStyleReset?.();
    hoveredId = nodeId;
    hoverStyleReset = networkLayer.overrideStyle(nodeId, {
      color: highlightColor,
    });
    networkLayer.options({ foreground: { ids: getForegroundIds(nodeId) } });
  }
});

function getForegroundIds(nodeId) {
  if (nodeId === null) {
    return [];
  }
  const { nodeIds, linkIds } = networkLayer.getGraphEngine().neighbors(nodeId);
  return [nodeId, ...nodeIds, ...linkIds];
}const states = [
["AL", 32.361538, -86.279118, "FL", "GA", "LA", "MS"],
["AR", 34.736009, -92.331122, "LA", "MO", "MS", "OK", "TN"],
["AZ", 33.448457, -112.073844, "NM", "NV", "UT"],
["CA", 38.555605, -121.468926, "NV", "OR"],
["CO", 39.7391667, -104.984167, "NE", "NM", "OK", "UT", "WY"],
["CT", 41.767, -72.677, "MA", "NJ", "NY", "RI"],
["DE", 39.161921, -75.526755, "MD", "NJ", "PA", "VA"],
["FL", 30.4518, -84.27277, "GA", "SC"],
["GA", 33.76, -84.39, "SC", "TN", "WV"],
["IA", 41.590939, -93.620866, "KS", "MN", "MO", "NE", "WI"],
["ID", 43.613739, -116.237651, "MT", "NV", "OR", "UT", "WA"],
["IL", 39.78325, -89.650373, "IN", "MO", "WI"],
["IN", 39.790942, -86.147685, "KY", "MI", "OH", "TN"],
["KS", 39.04, -95.69, "MO", "NE", "OK"],
["KY", 38.197274, -84.86311, "OH", "TN", "WV"],
["LA", 30.45809, -91.140229, "MS", "TX"],
["MA", 42.2352, -71.0275, "ME", "NH", "RI"],
["MD", 38.972945, -76.501157, "PA", "VA"],
["ME", 44.323535, -69.765261, "NH", "VT"],
["MI", 42.7335, -84.5467, "OH", "PA", "WI"],
["MN", 44.95, -93.094, "ND", "NE", "WI"],
["MO", 38.572954, -92.189283, "OK", "TN"],
["MS", 32.32, -90.207, "TN"],
["MT", 46.595805, -112.027031, "ND", "UT", "WA", "WY"],
["NC", 35.771, -78.638, "SC", "VA", "WV"],
["ND", 48.813343, -100.779004, "SD", "WY"],
["NE", 40.809868, -96.675345, "SD"],
["NH", 43.220093, -71.549127, "NY", "VT"],
["NJ", 40.221741, -74.756138, "NY", "PA"],
["NM", 35.667231, -105.964575, "OK", "TX"],
["NV", 39.160949, -119.753877, "OR", "UT"],
["NY", 42.659829, -73.781339, "PA", "VT"],
["OH", 39.962245, -83.000647, "PA", "WV"],
["OK", 35.482309, -97.534994, "TX"],
["OR", 44.931109, -123.029159, "WA"],
["PA", 40.269789, -76.875613, "WV"],
["RI", 41.82355, -71.422132],
["SC", 34, -81.035],
["SD", 44.367966, -100.336378, "WY"],
["TN", 36.165, -86.784],
["TX", 30.266667, -97.75],
["UT", 40.7547, -111.892622, "WY"],
["VA", 37.54, -77.46, "WV"],
["VT", 44.26639, -72.57194],
["WA", 47.042418, -122.893077],
["WI", 43.074722, -89.384444],
["WV", 38.349497, -81.633294],
["WY", 41.145548, -104.802042],
];
function makeNetworkData() {
const result = {};
for (const [id1, latitude, longitude, ...links] of states) {
result[id1] = {
type: "node",
latitude,
longitude,
};
for (const id2 of links) {
const id = `${id1}-${id2}`;
result[id] = {
type: "link",
id1,
id2,
};
}
}
return result;
}
export const networkData = makeNetworkData();
export const highlightColor = "#FF1764";<!doctype html>
<html>
<head>
<link rel="stylesheet" href="@ci/theme/mw/css/examples.css" />
</head>
<body>
<div id="mw"></div>
<script type="module" src="./code.js"></script>
</body>
</html>import React, { useMemo, useState } from "react";
import { createRoot } from "react-dom/client";
import { MapWeave } from "mapweave/react/mapbox";
import { NetworkLayer, createNetworkGraphEngine } from "mapweave/react/layers";
import { networkData, highlightColor } from "./data";
const mapWeaveOptions = { accessToken: VITE_MAPBOX_API_KEY };
function getForegroundIds(nodeId, graphEngine) {
if (nodeId === null) {
return [];
}
const { nodeIds, linkIds } = graphEngine.neighbors(nodeId);
return [nodeId, ...nodeIds, ...linkIds];
}
function Demo() {
const [hoverInfo, setHoverInfo] = useState(null);
const graphEngine = useMemo(
() => createNetworkGraphEngine(networkData),
[networkData],
);
const nodeId = hoverInfo?.item?.type === "node" ? hoverInfo.id : null;
const overrideStyles =
nodeId === null
? []
: [{ ids: nodeId, overrideStyle: { color: highlightColor } }];
return (
<MapWeave options={mapWeaveOptions} onHover={setHoverInfo}>
<NetworkLayer
data={networkData}
overrideStyles={overrideStyles}
options={{
foreground: {
ids: getForegroundIds(nodeId, graphEngine),
backgroundOpacity: 0.3,
},
}}
/>
</MapWeave>
);
}
const root = createRoot(document.getElementById("mw"));
root.render(<Demo />);const states = [
["AL", 32.361538, -86.279118, "FL", "GA", "LA", "MS"],
["AR", 34.736009, -92.331122, "LA", "MO", "MS", "OK", "TN"],
["AZ", 33.448457, -112.073844, "NM", "NV", "UT"],
["CA", 38.555605, -121.468926, "NV", "OR"],
["CO", 39.7391667, -104.984167, "NE", "NM", "OK", "UT", "WY"],
["CT", 41.767, -72.677, "MA", "NJ", "NY", "RI"],
["DE", 39.161921, -75.526755, "MD", "NJ", "PA", "VA"],
["FL", 30.4518, -84.27277, "GA", "SC"],
["GA", 33.76, -84.39, "SC", "TN", "WV"],
["IA", 41.590939, -93.620866, "KS", "MN", "MO", "NE", "WI"],
["ID", 43.613739, -116.237651, "MT", "NV", "OR", "UT", "WA"],
["IL", 39.78325, -89.650373, "IN", "MO", "WI"],
["IN", 39.790942, -86.147685, "KY", "MI", "OH", "TN"],
["KS", 39.04, -95.69, "MO", "NE", "OK"],
["KY", 38.197274, -84.86311, "OH", "TN", "WV"],
["LA", 30.45809, -91.140229, "MS", "TX"],
["MA", 42.2352, -71.0275, "ME", "NH", "RI"],
["MD", 38.972945, -76.501157, "PA", "VA"],
["ME", 44.323535, -69.765261, "NH", "VT"],
["MI", 42.7335, -84.5467, "OH", "PA", "WI"],
["MN", 44.95, -93.094, "ND", "NE", "WI"],
["MO", 38.572954, -92.189283, "OK", "TN"],
["MS", 32.32, -90.207, "TN"],
["MT", 46.595805, -112.027031, "ND", "UT", "WA", "WY"],
["NC", 35.771, -78.638, "SC", "VA", "WV"],
["ND", 48.813343, -100.779004, "SD", "WY"],
["NE", 40.809868, -96.675345, "SD"],
["NH", 43.220093, -71.549127, "NY", "VT"],
["NJ", 40.221741, -74.756138, "NY", "PA"],
["NM", 35.667231, -105.964575, "OK", "TX"],
["NV", 39.160949, -119.753877, "OR", "UT"],
["NY", 42.659829, -73.781339, "PA", "VT"],
["OH", 39.962245, -83.000647, "PA", "WV"],
["OK", 35.482309, -97.534994, "TX"],
["OR", 44.931109, -123.029159, "WA"],
["PA", 40.269789, -76.875613, "WV"],
["RI", 41.82355, -71.422132],
["SC", 34, -81.035],
["SD", 44.367966, -100.336378, "WY"],
["TN", 36.165, -86.784],
["TX", 30.266667, -97.75],
["UT", 40.7547, -111.892622, "WY"],
["VA", 37.54, -77.46, "WV"],
["VT", 44.26639, -72.57194],
["WA", 47.042418, -122.893077],
["WI", 43.074722, -89.384444],
["WV", 38.349497, -81.633294],
["WY", 41.145548, -104.802042],
];
function makeNetworkData() {
const result = {};
for (const [id1, latitude, longitude, ...links] of states) {
result[id1] = {
type: "node",
latitude,
longitude,
};
for (const id2 of links) {
const id = `${id1}-${id2}`;
result[id] = {
type: "link",
id1,
id2,
};
}
}
return result;
}
export const networkData = makeNetworkData();
export const highlightColor = "#FF1764";<!doctype html>
<html>
<head>
<link rel="stylesheet" href="@ci/theme/mw/css/examples.css" />
</head>
<body>
<div id="mw"></div>
<script type="module" src="./code.jsx"></script>
</body>
</html>