MapWeave Examples
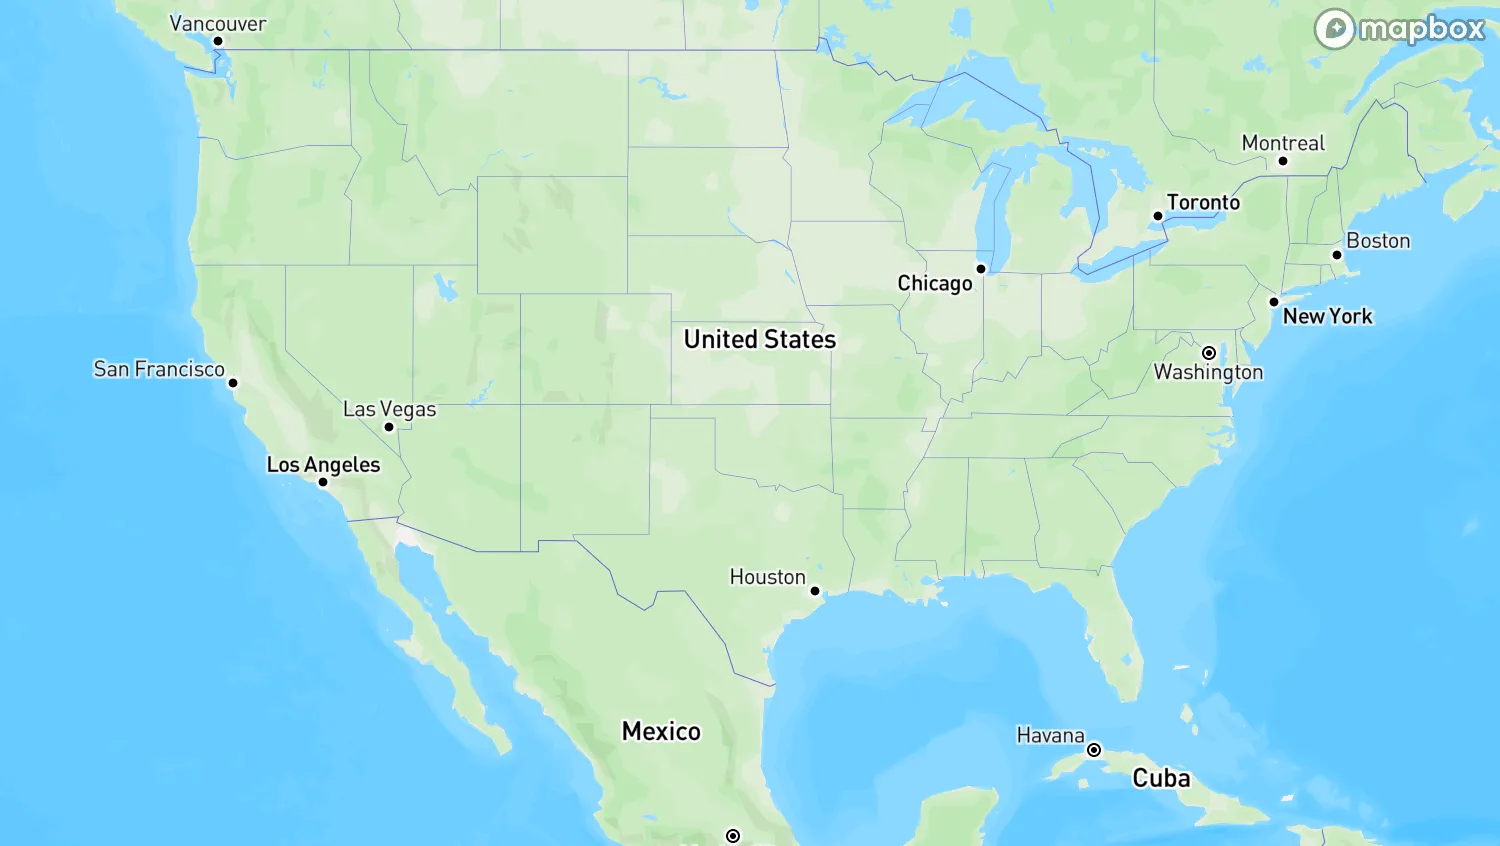
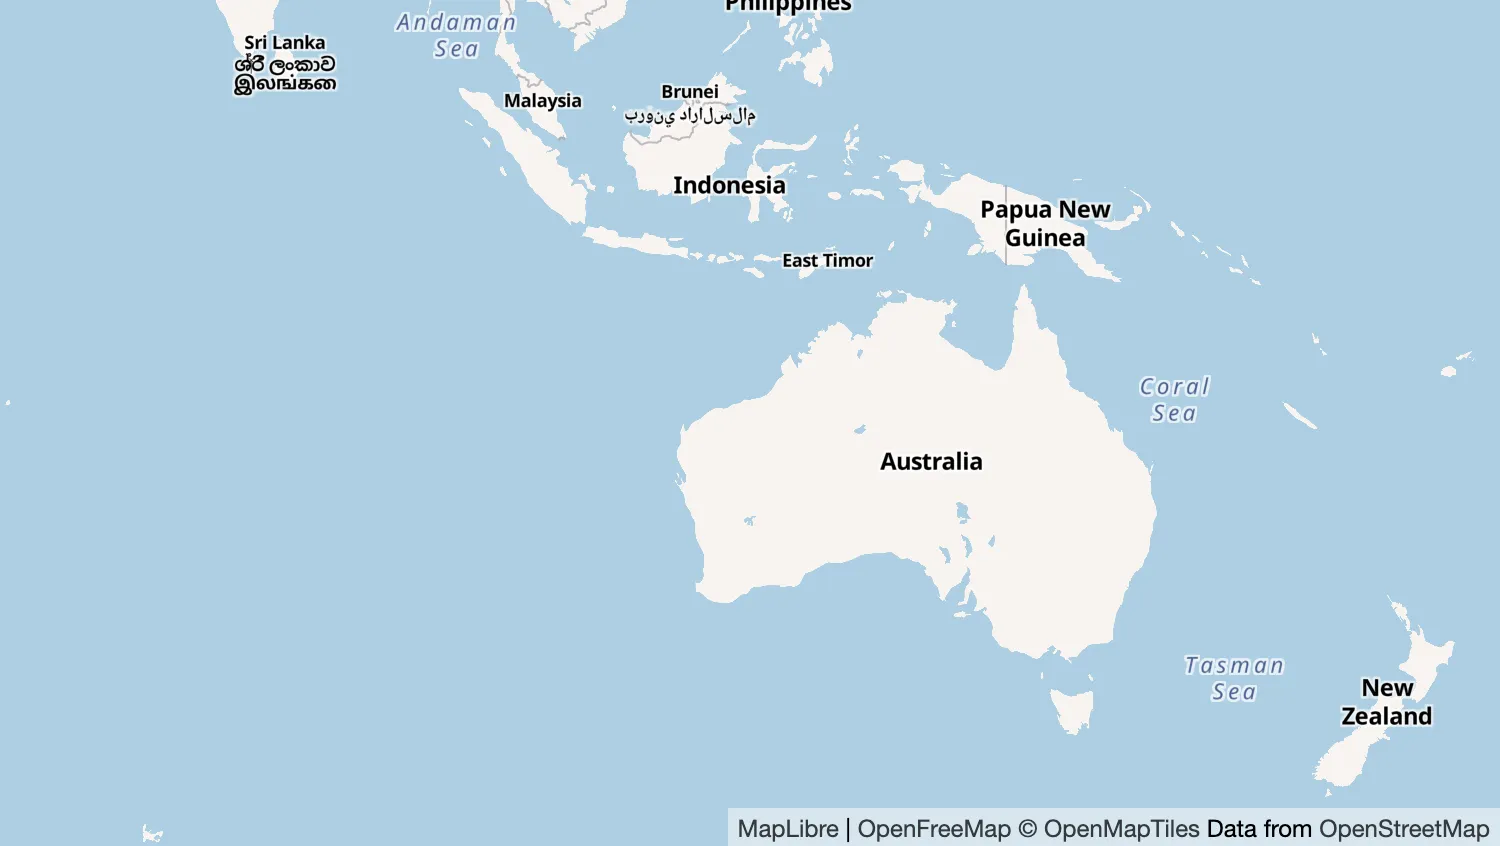
Map Adapters
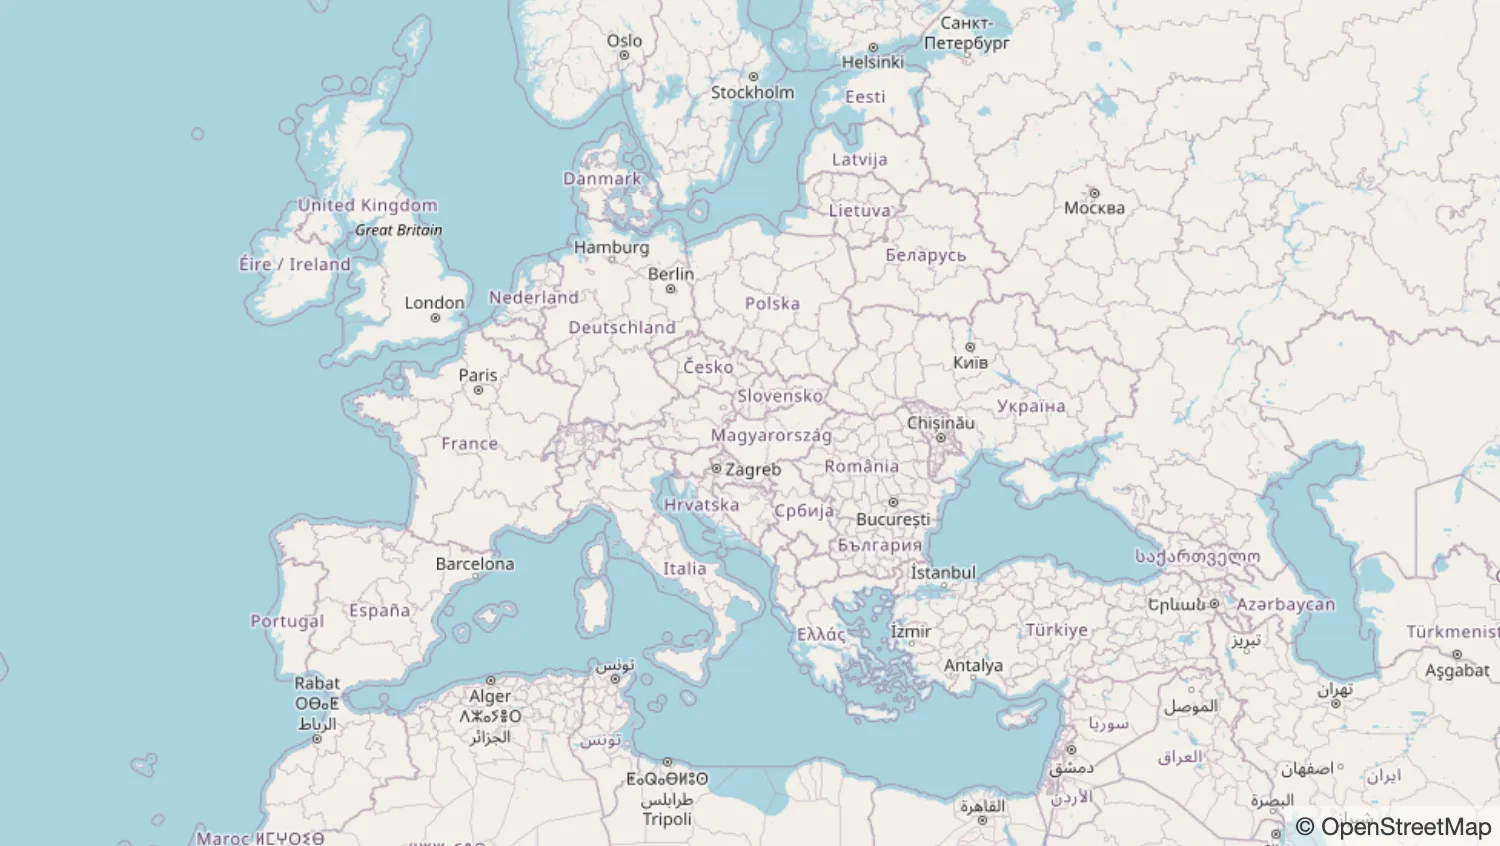
MapWeave Basics
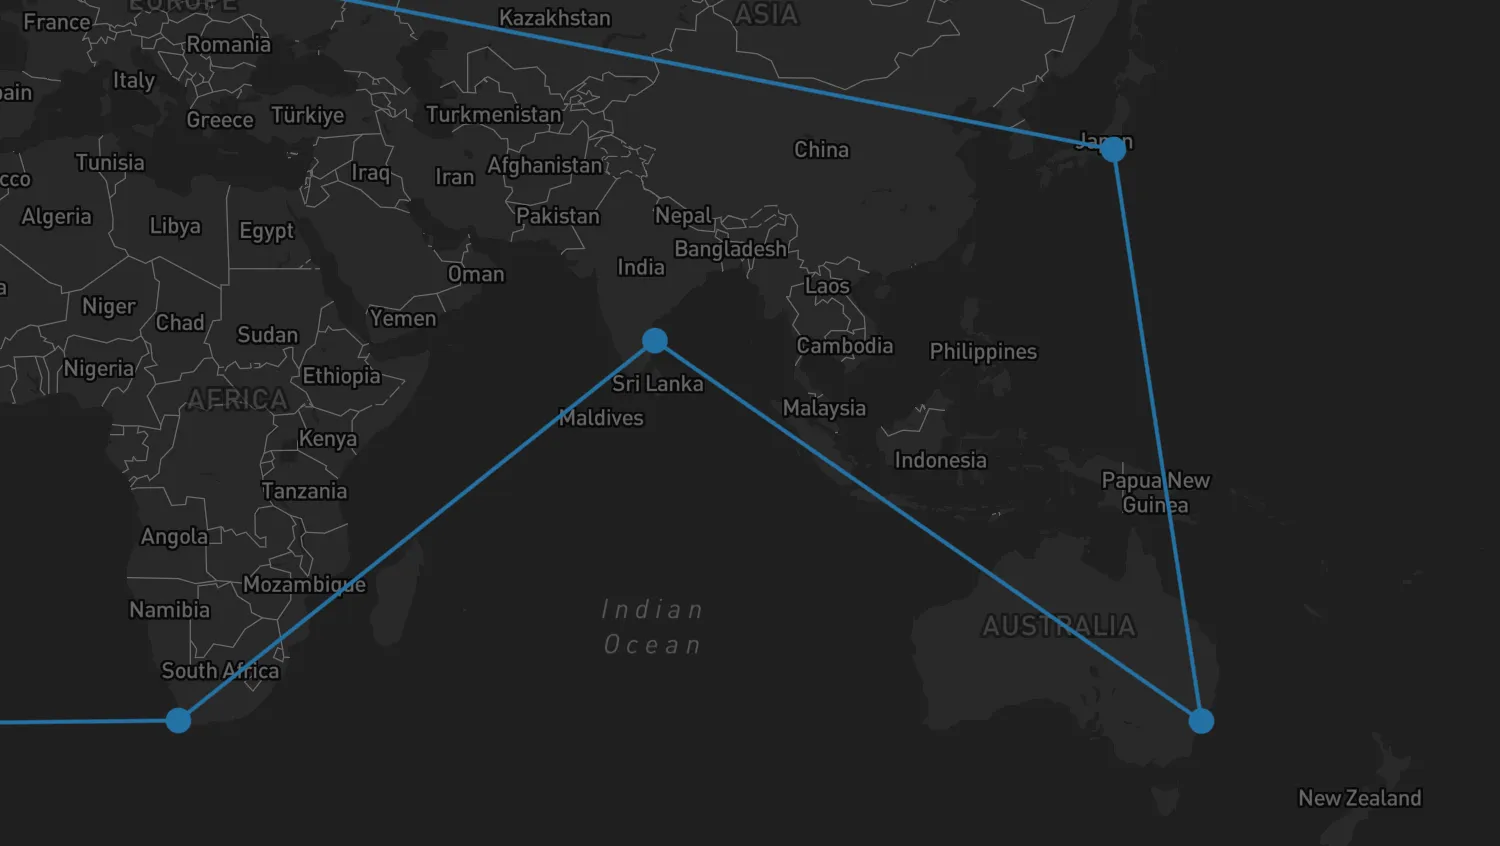
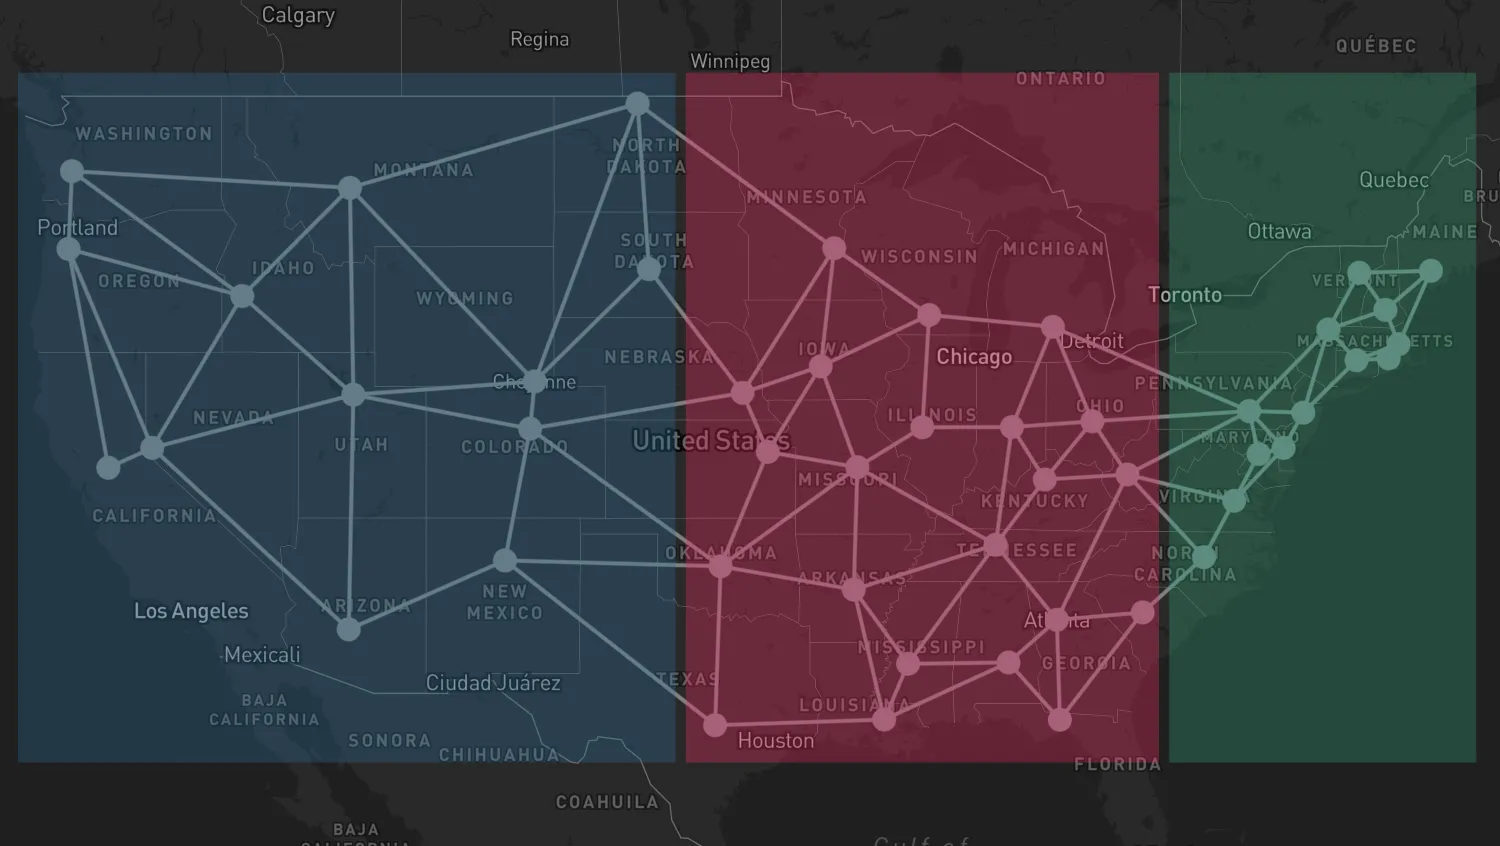
Network Nodes and Links
Create a graph with fixed connected nodes.
See example
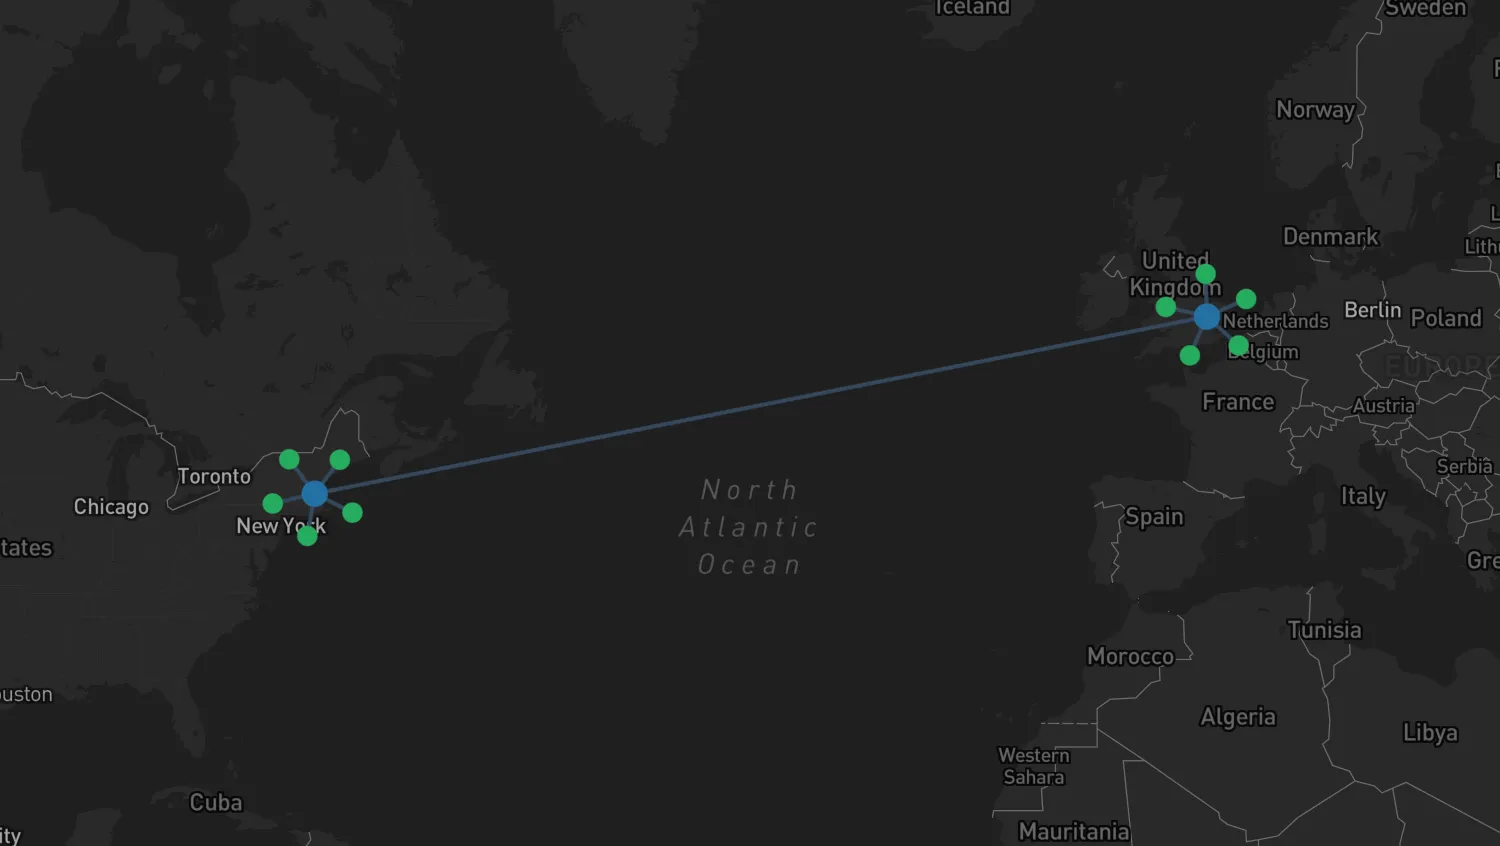
Fixed and Free Nodes
See different types of nodes in MapWeave.
See example
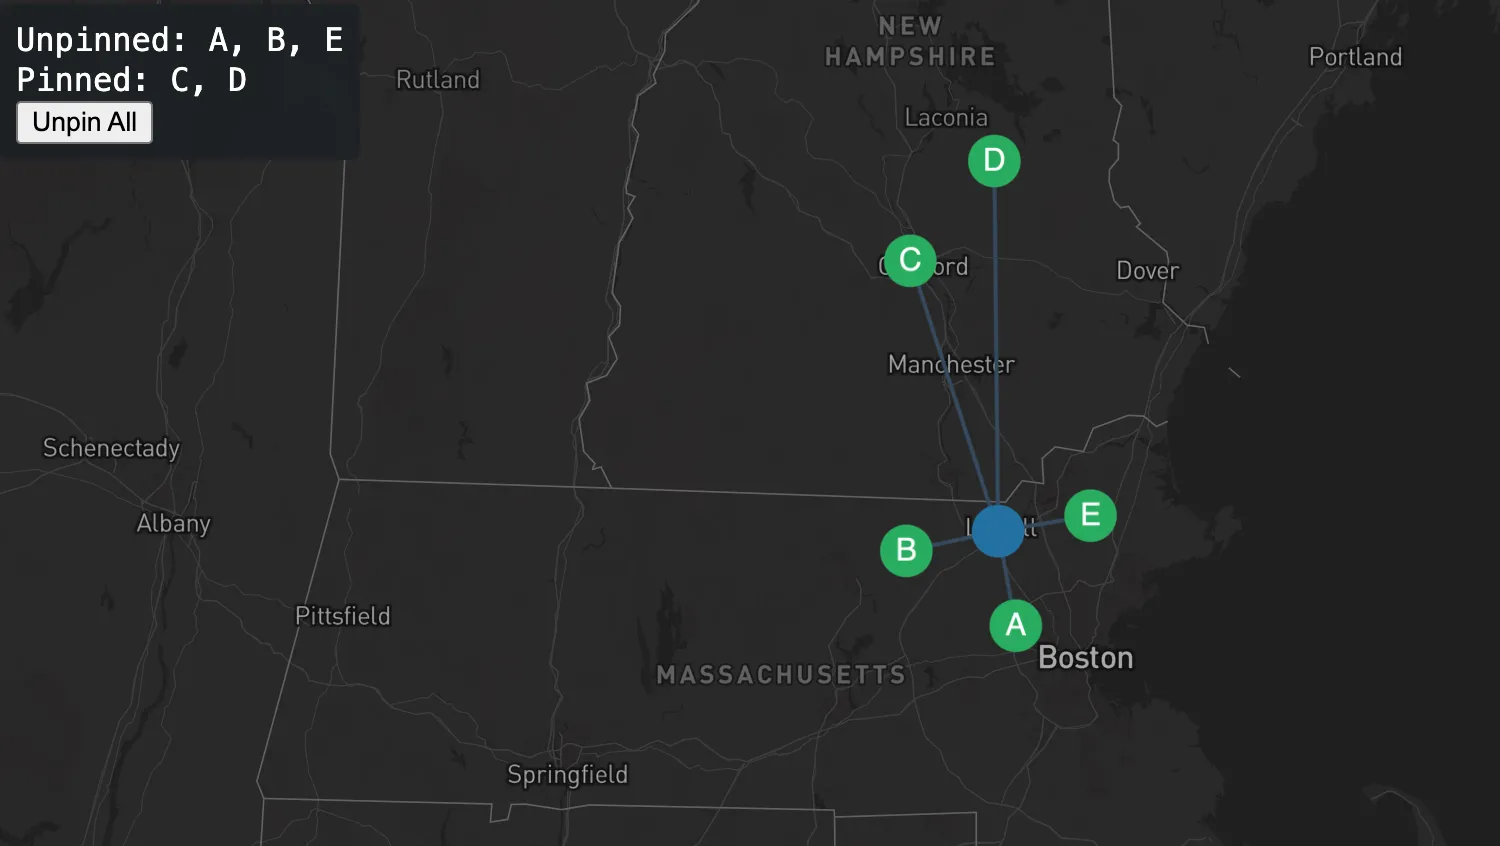
Pin Free Nodes
Pin nodes in position after a user has dragged them.
See example
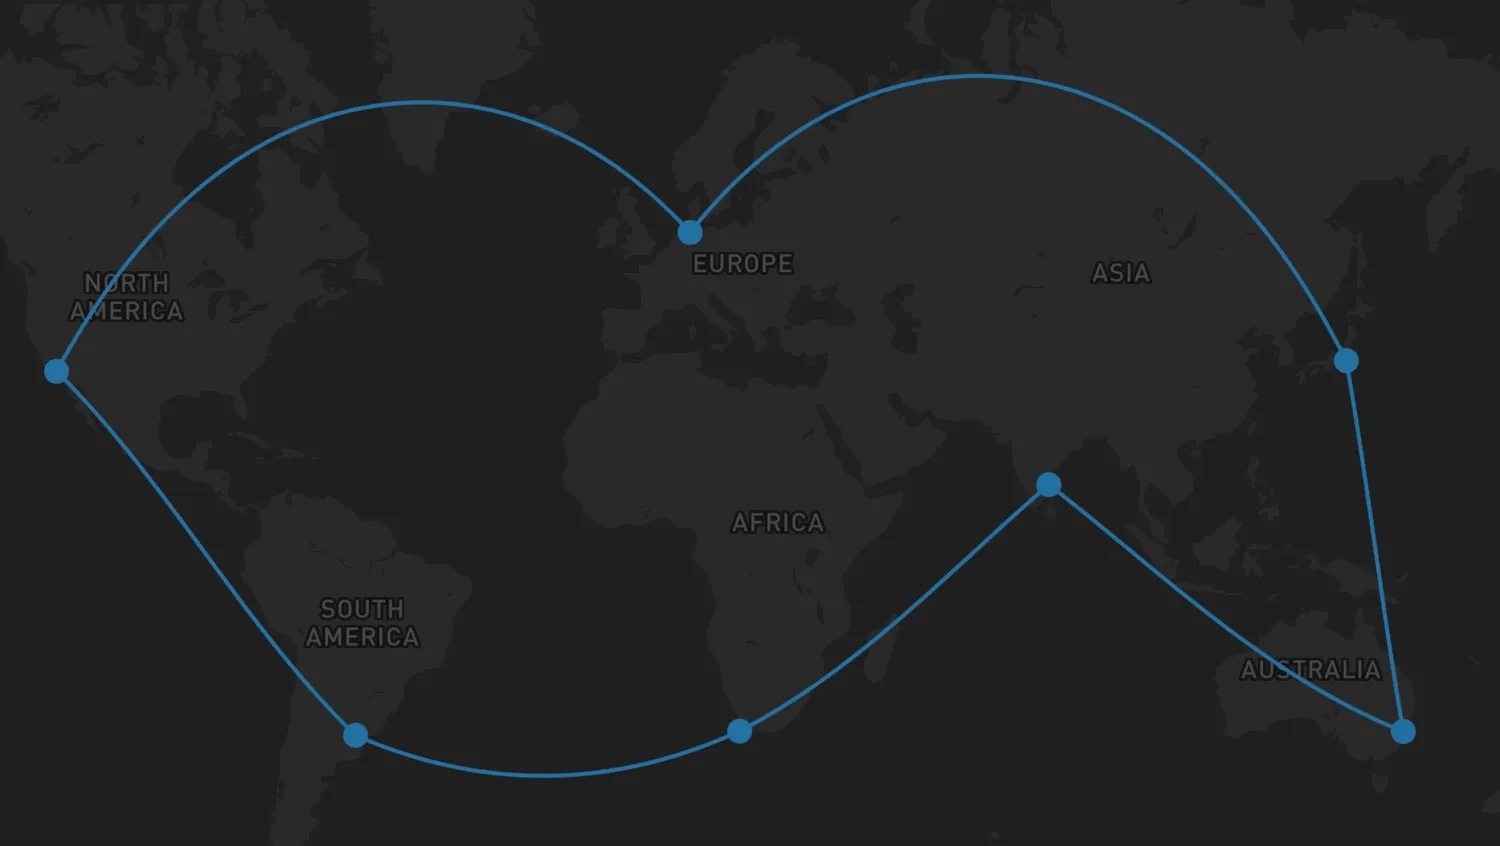
Links and Routes
Explore the different ways links can be displayed.
See example
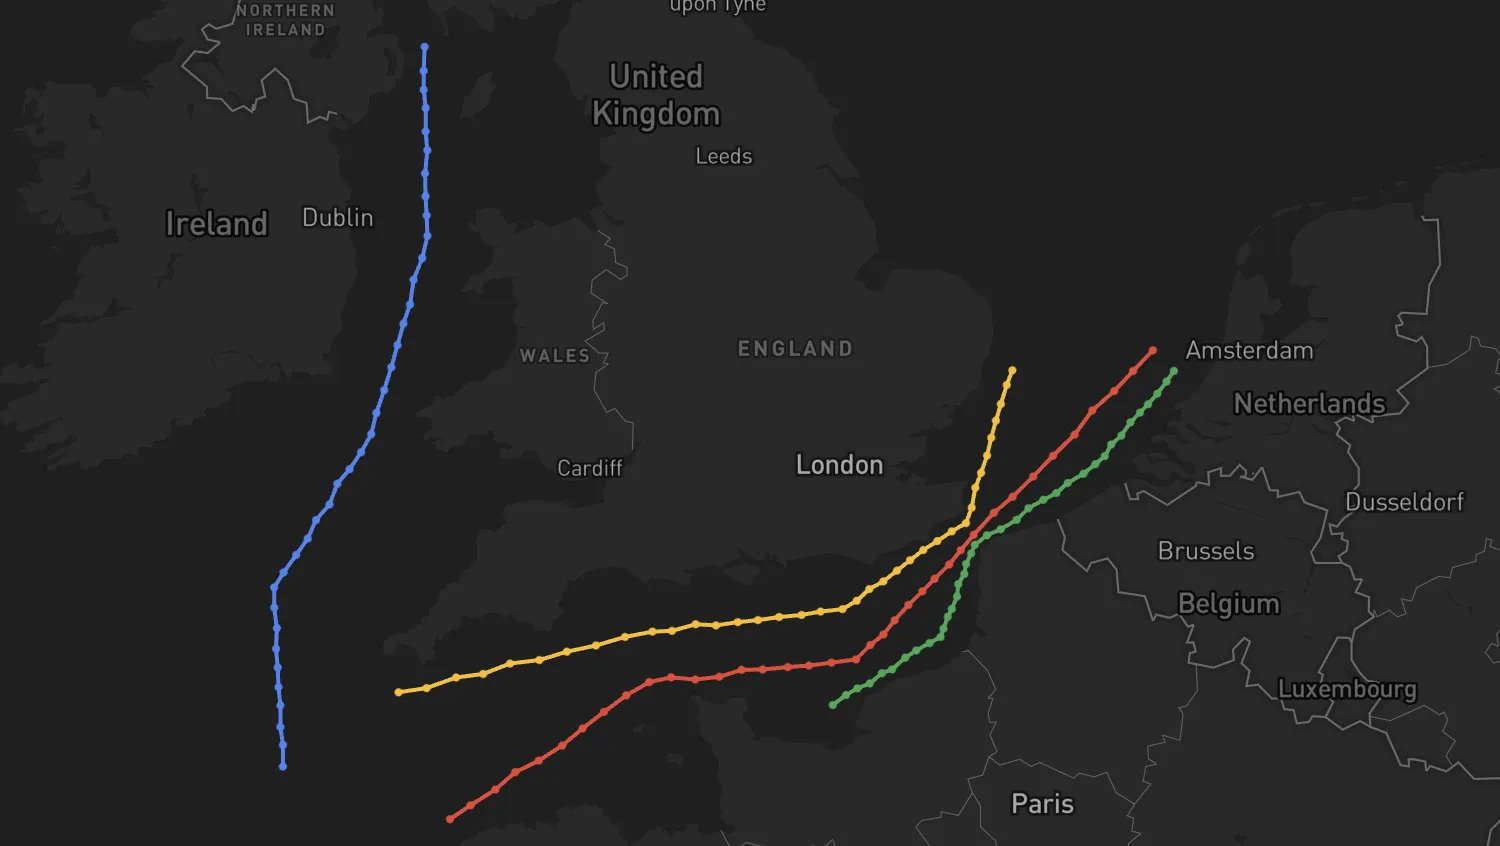
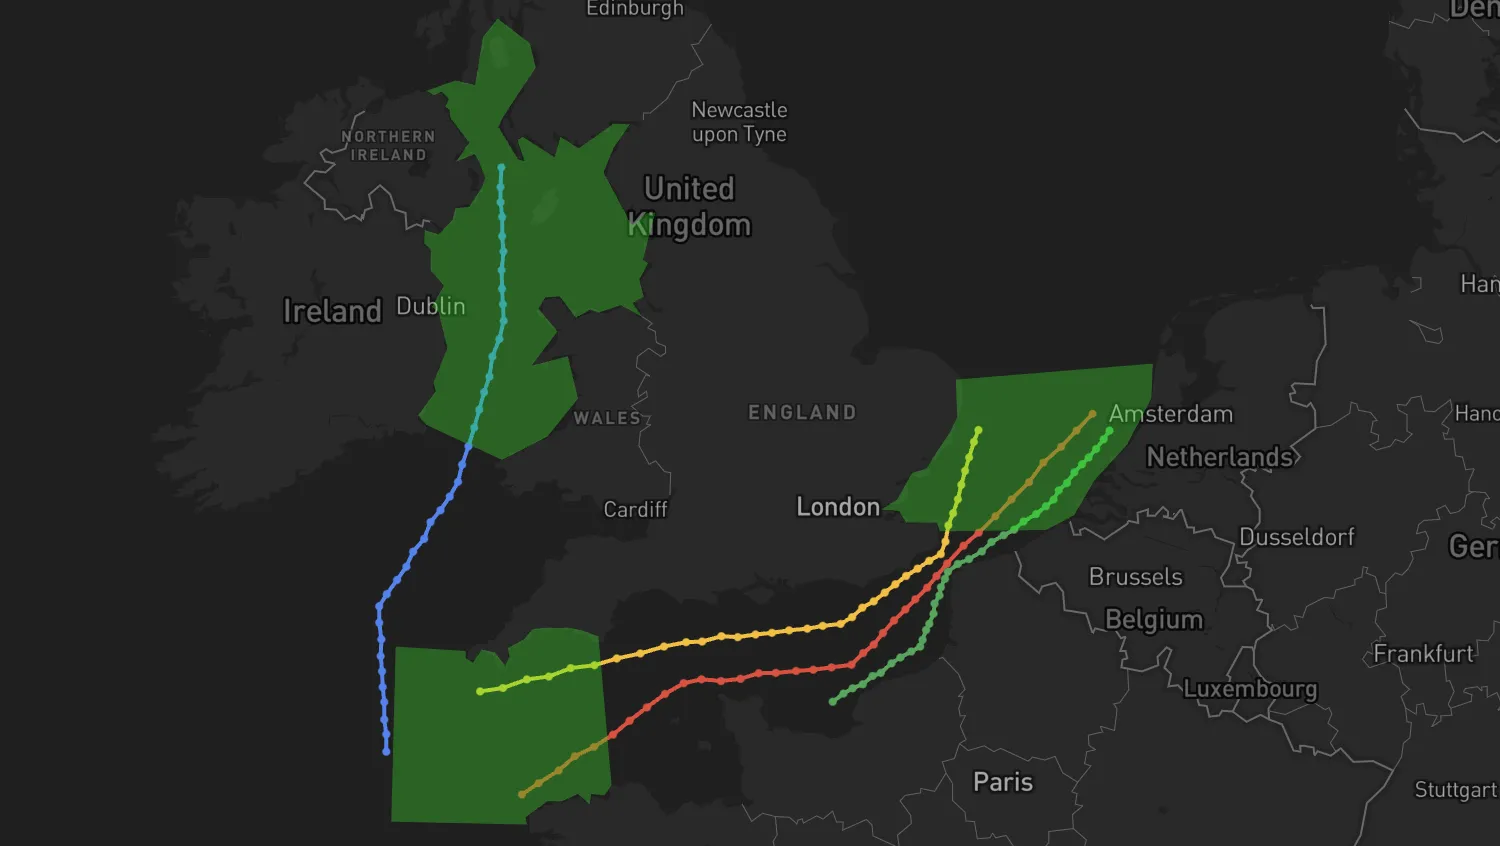
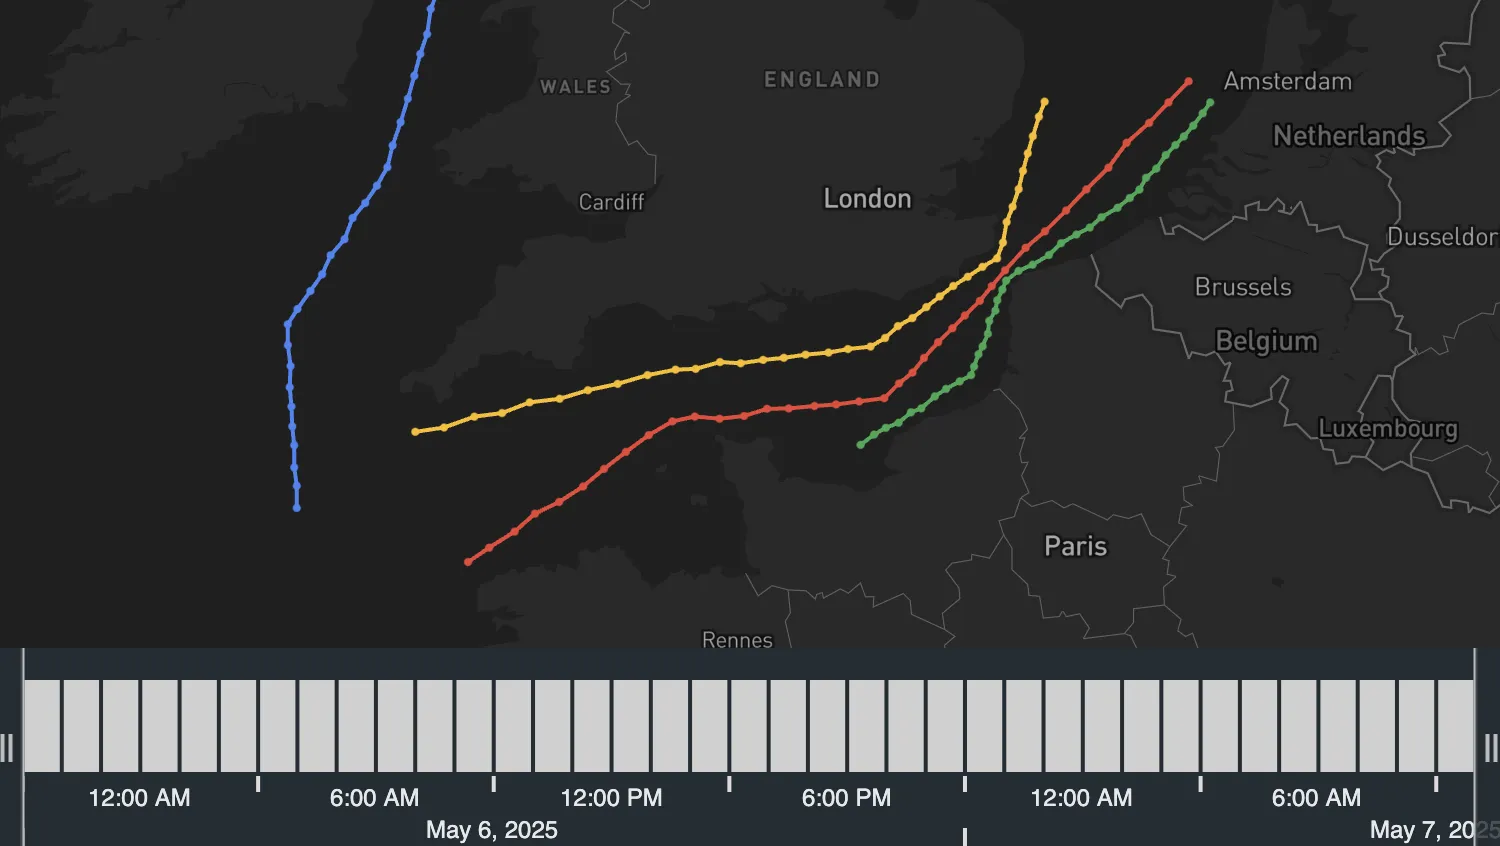
Observations and Trajectories
Generate trajectories from raw observation data.
See example
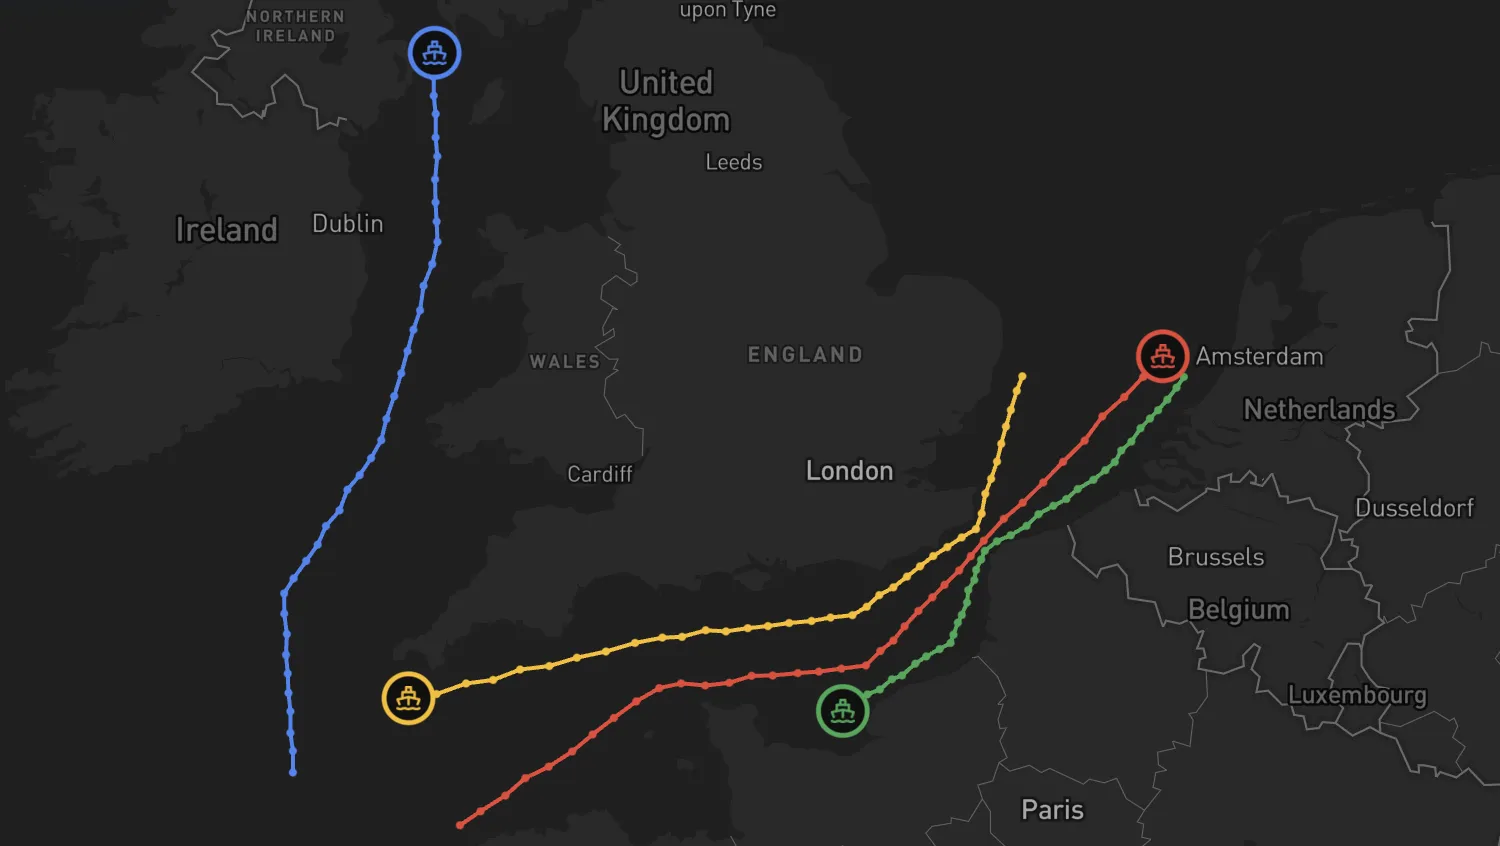
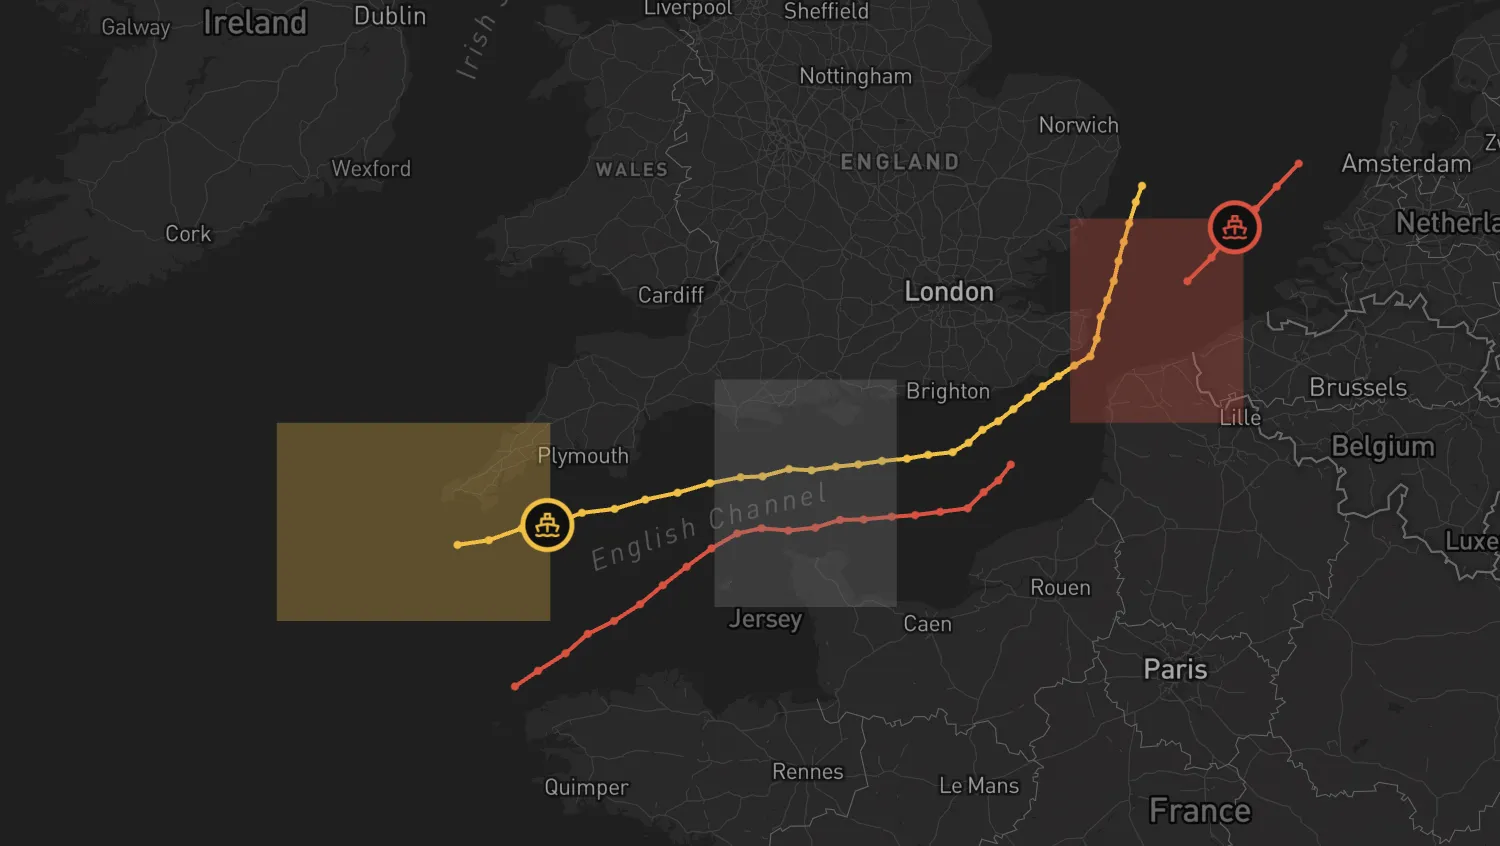
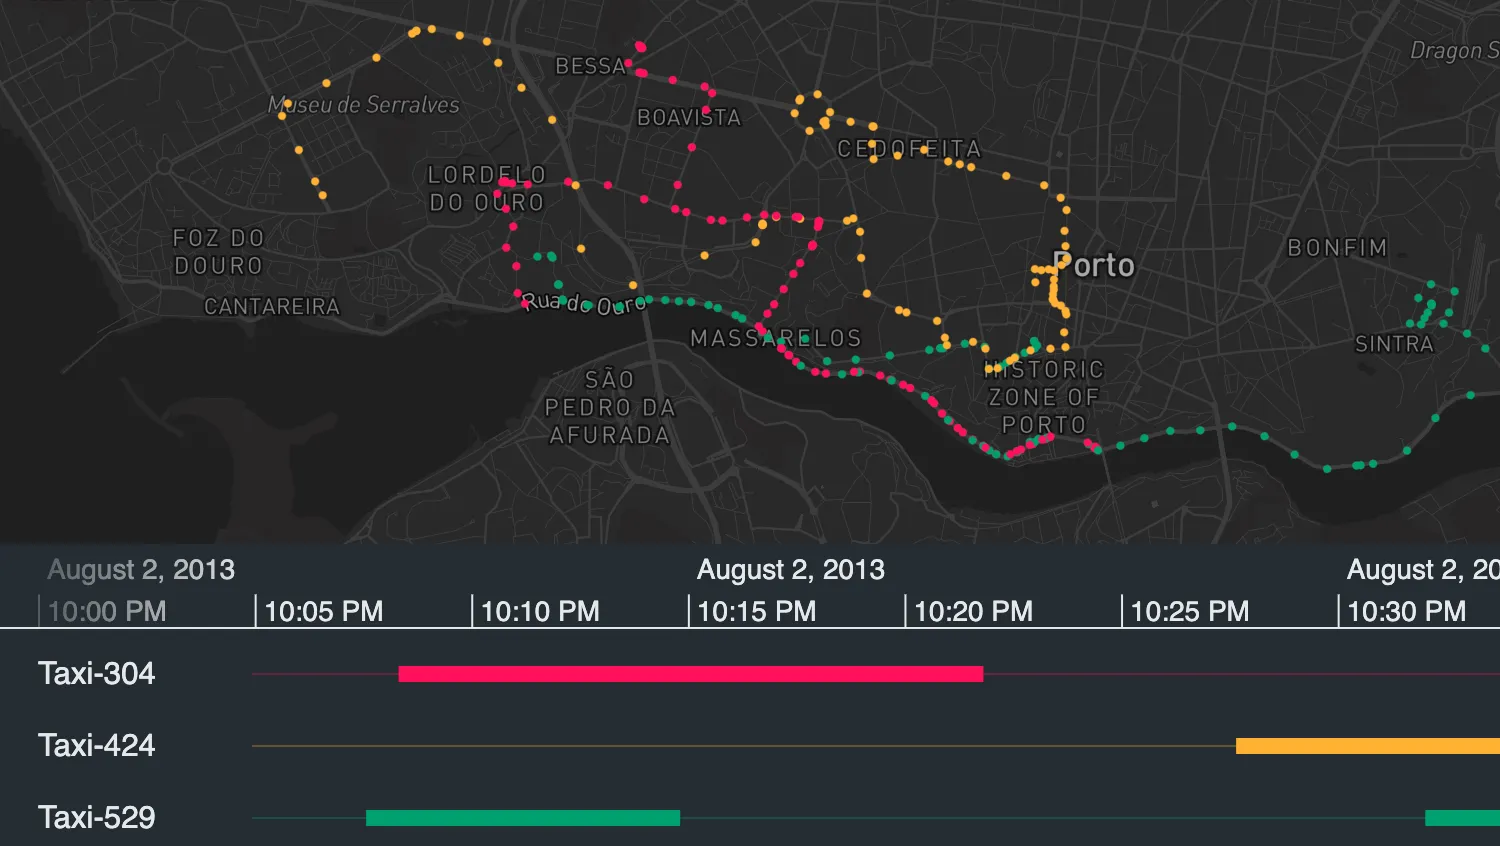
Tracker Nodes
Show the positions of moving entities with tracker nodes.
See example
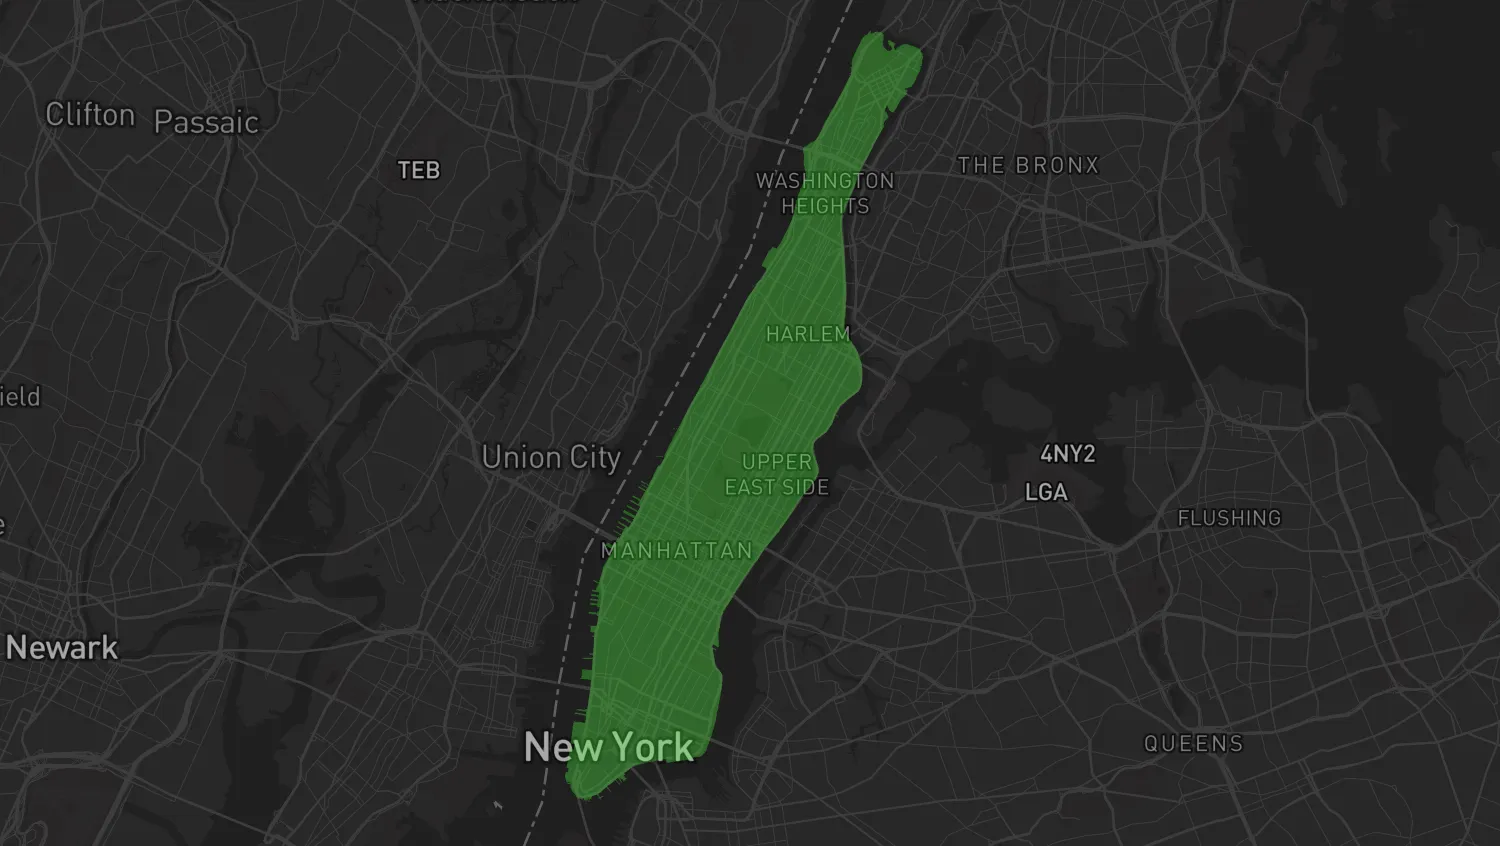
GeoJSON Data
Add GeoJSON data to your map.
See example
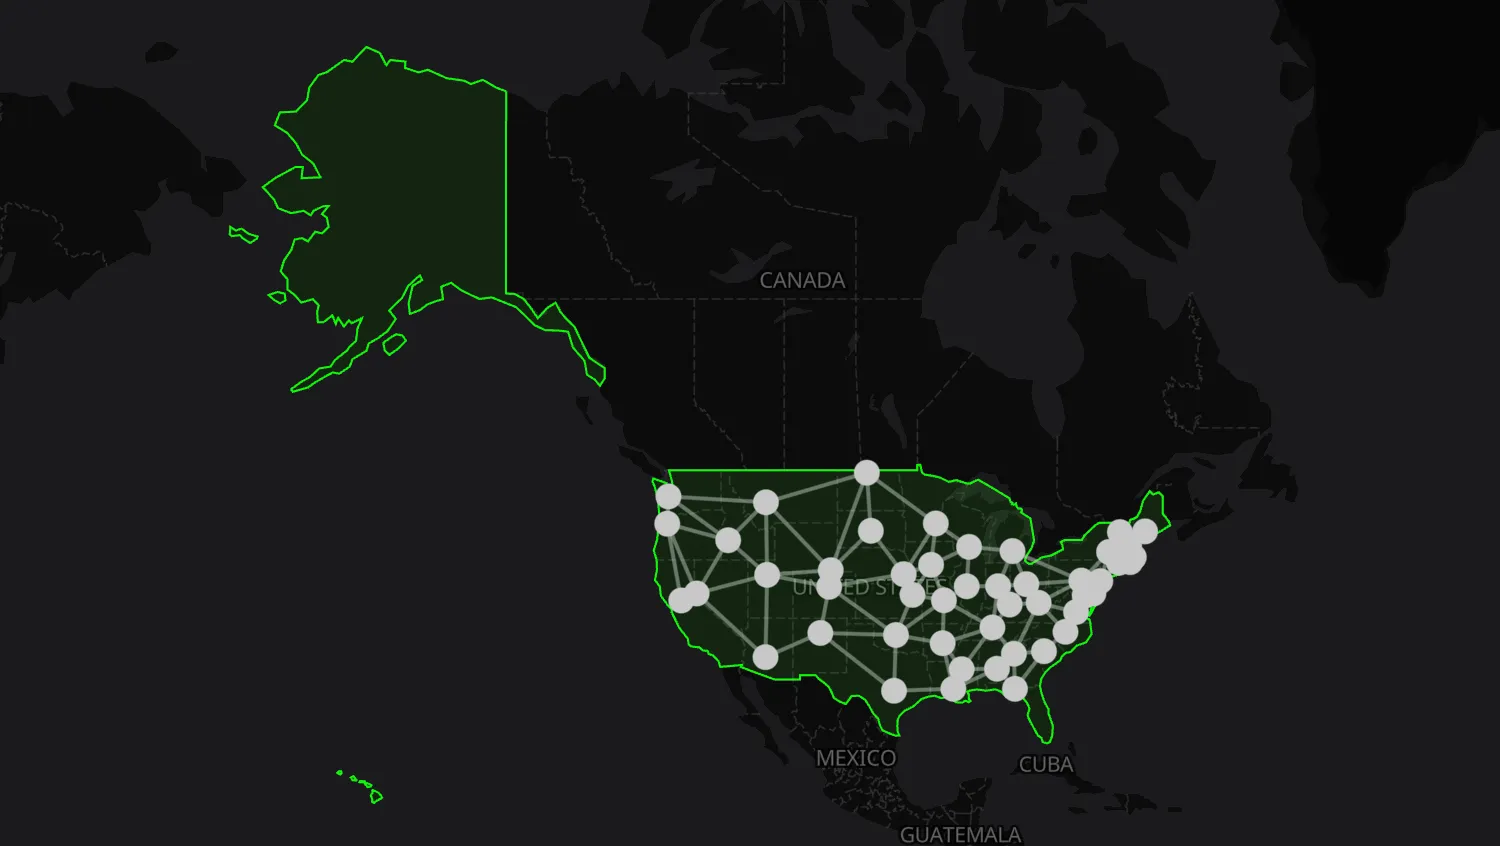
Fit to Bounds
Fit the view to bounds defined by your data.
See example
Reducing Clutter
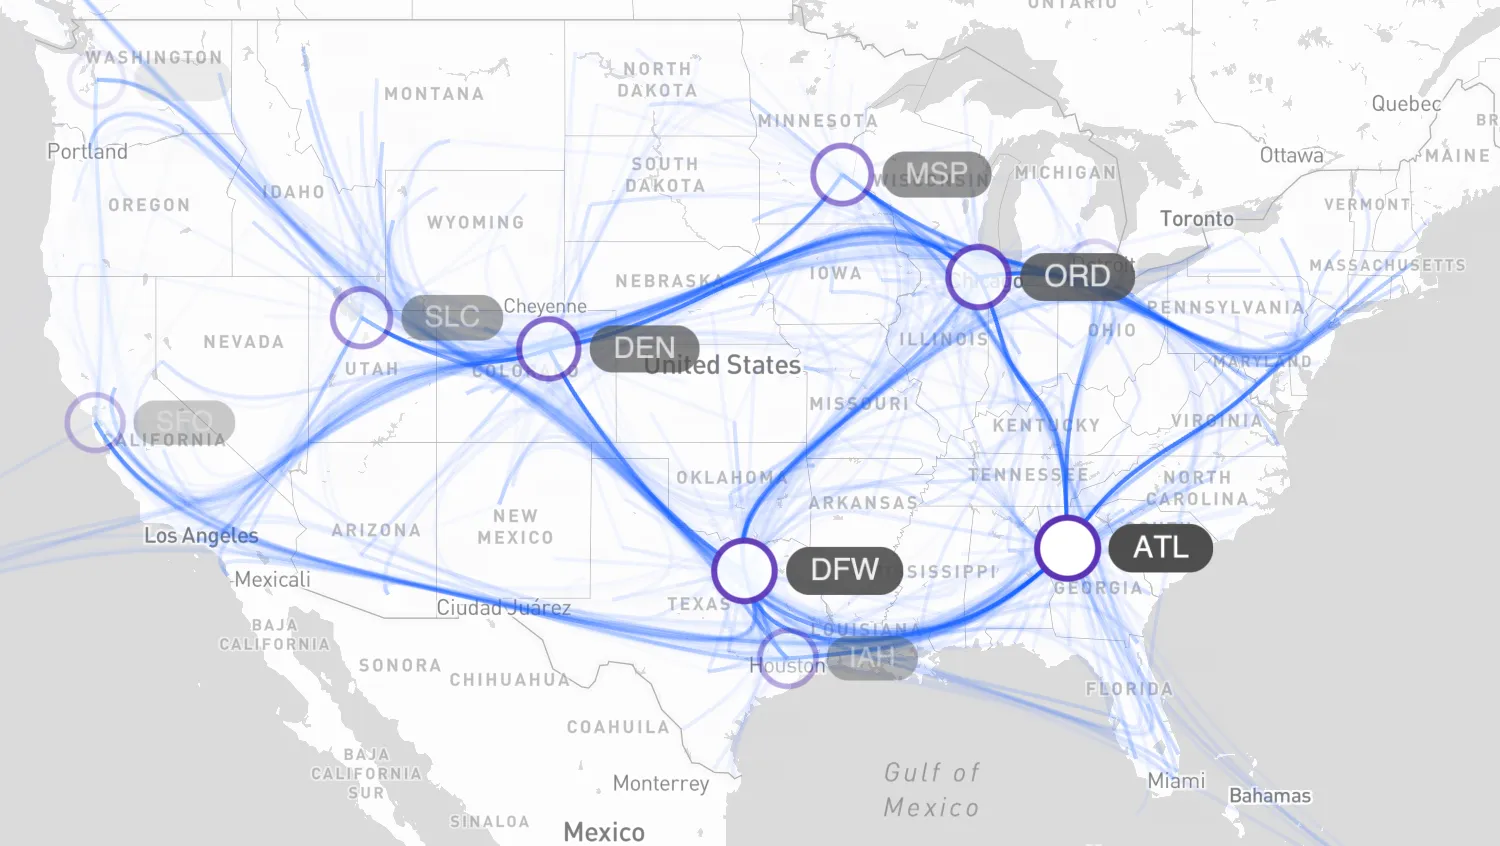
Adaptive Styling
Reduce clutter and improve readability at each zoom level.
See example
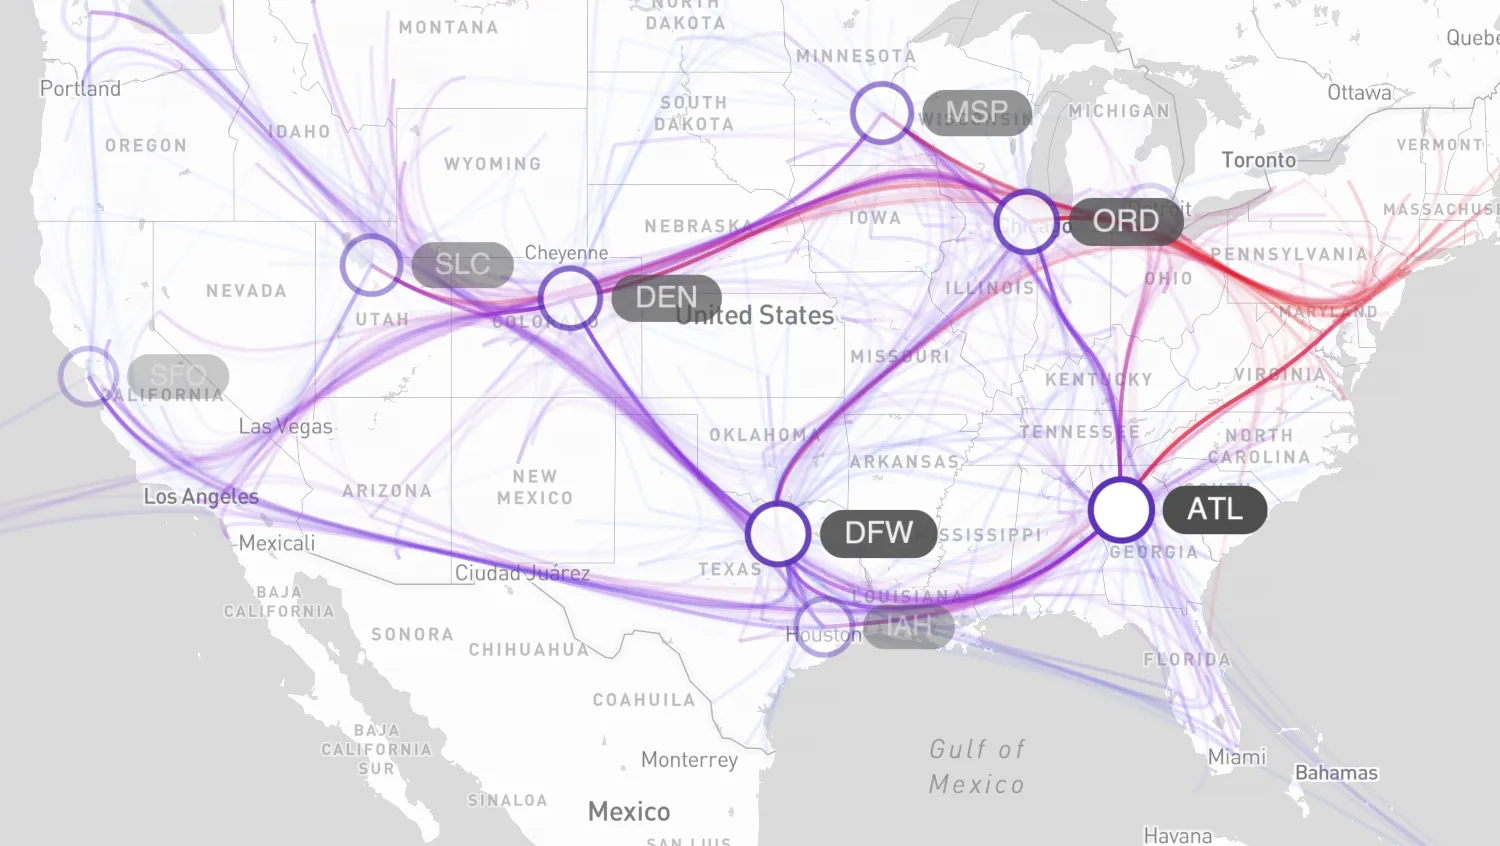
Link Color Gradient
Show volume of flow or network traffic with color scale.
See example
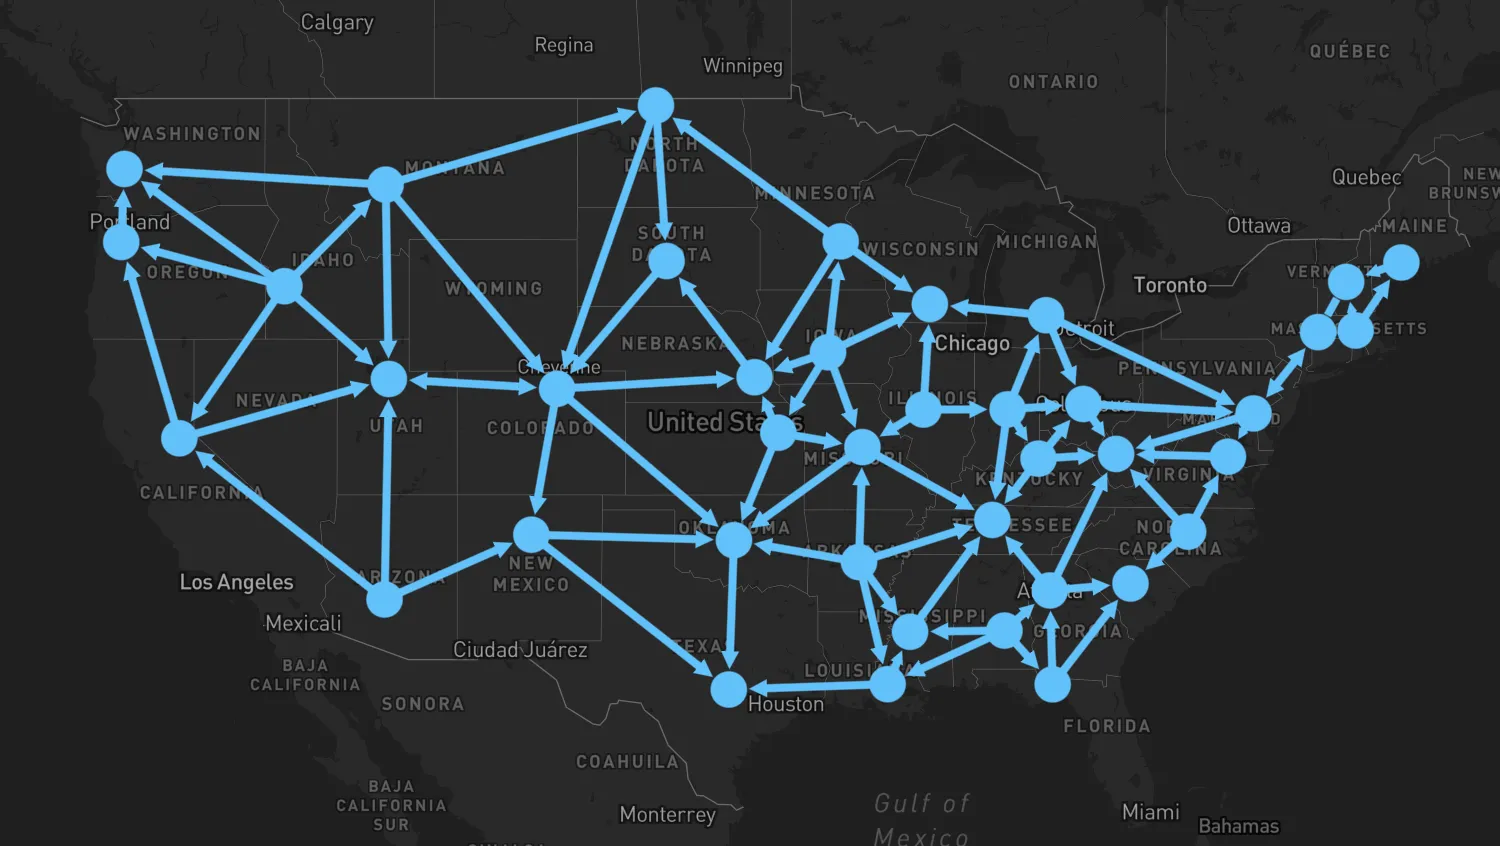
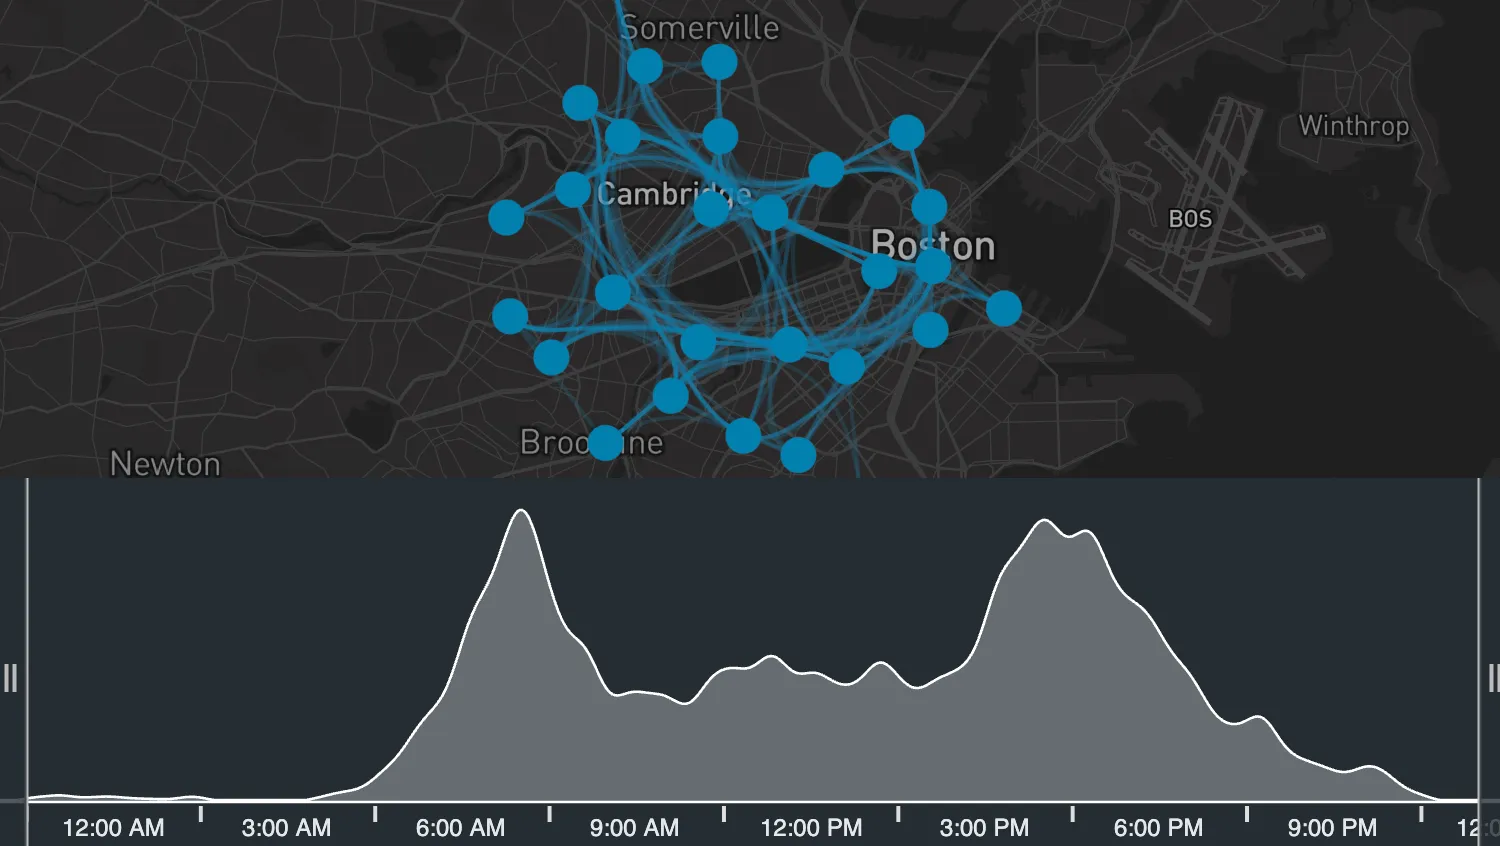
Proximity Combining
Reduce clutter by combining nearby nodes.
See example
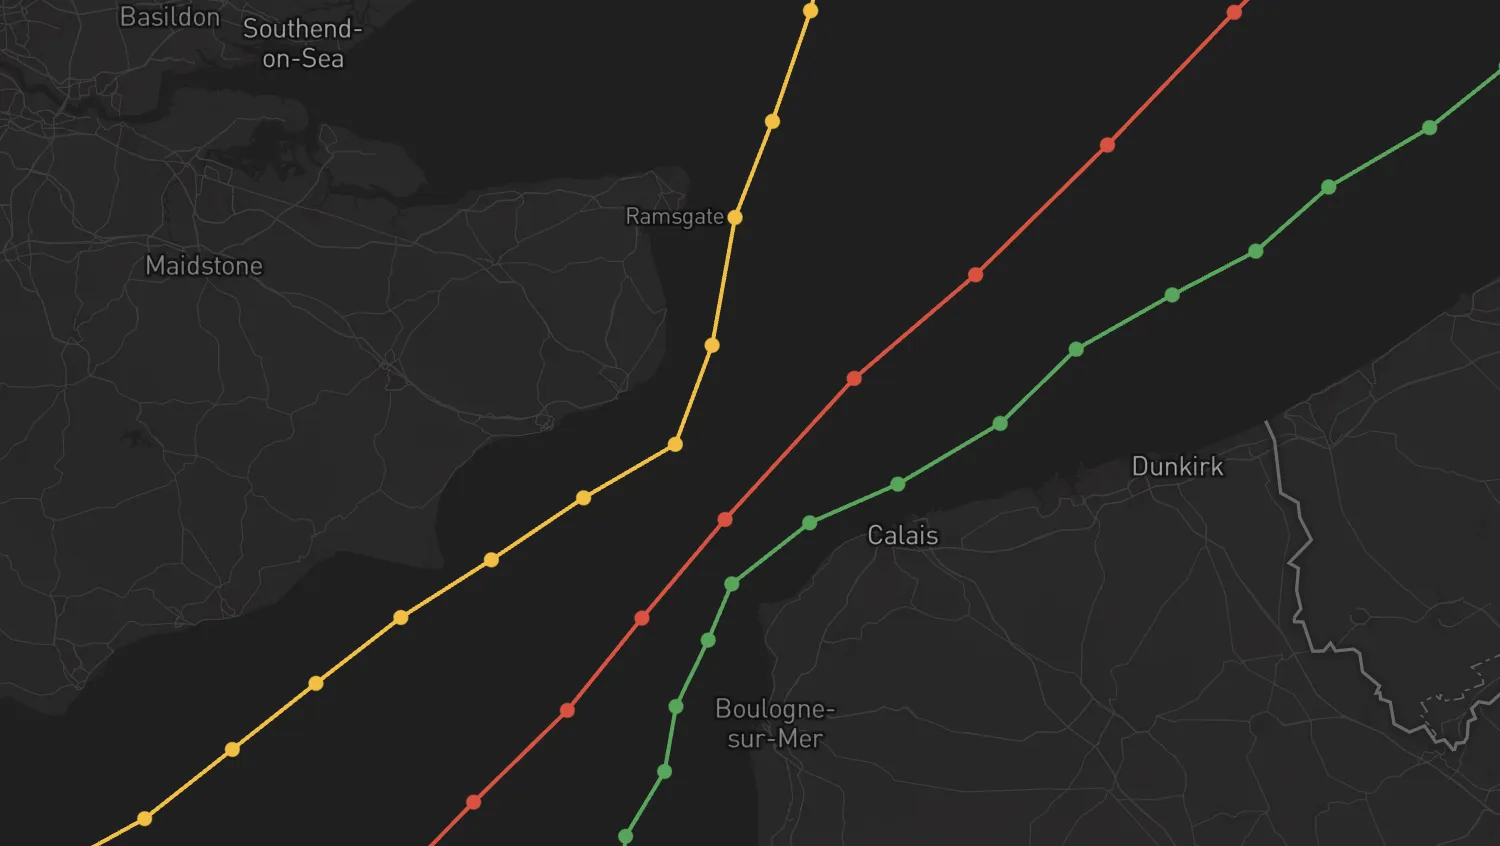
Observations Transitions
Customize what is visible at different zoom levels.
See example
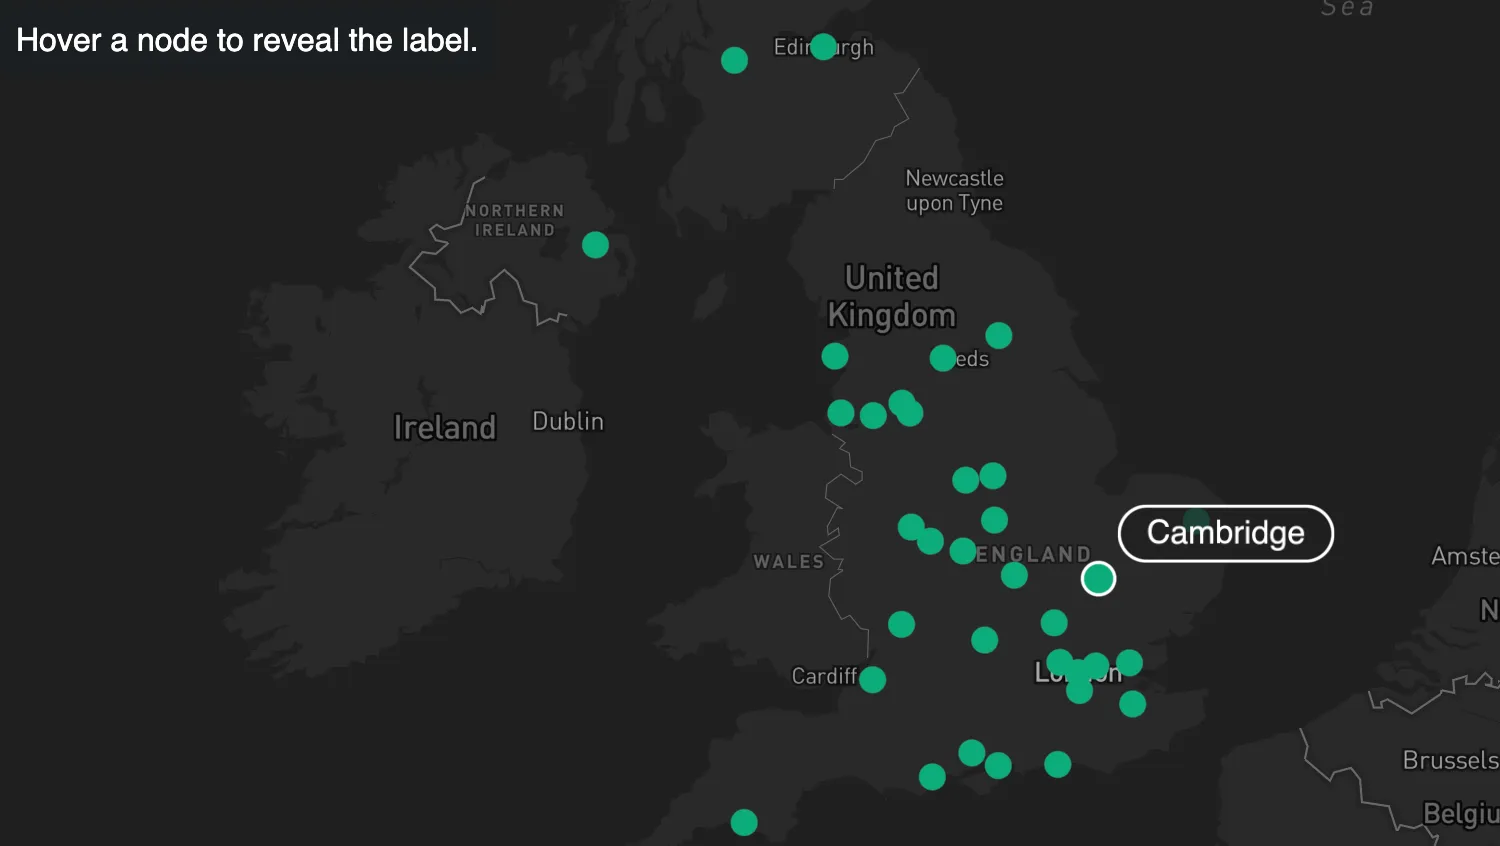
Revealing Hidden Labels
Hide labels by default and reveal them on demand.
See example
Styling
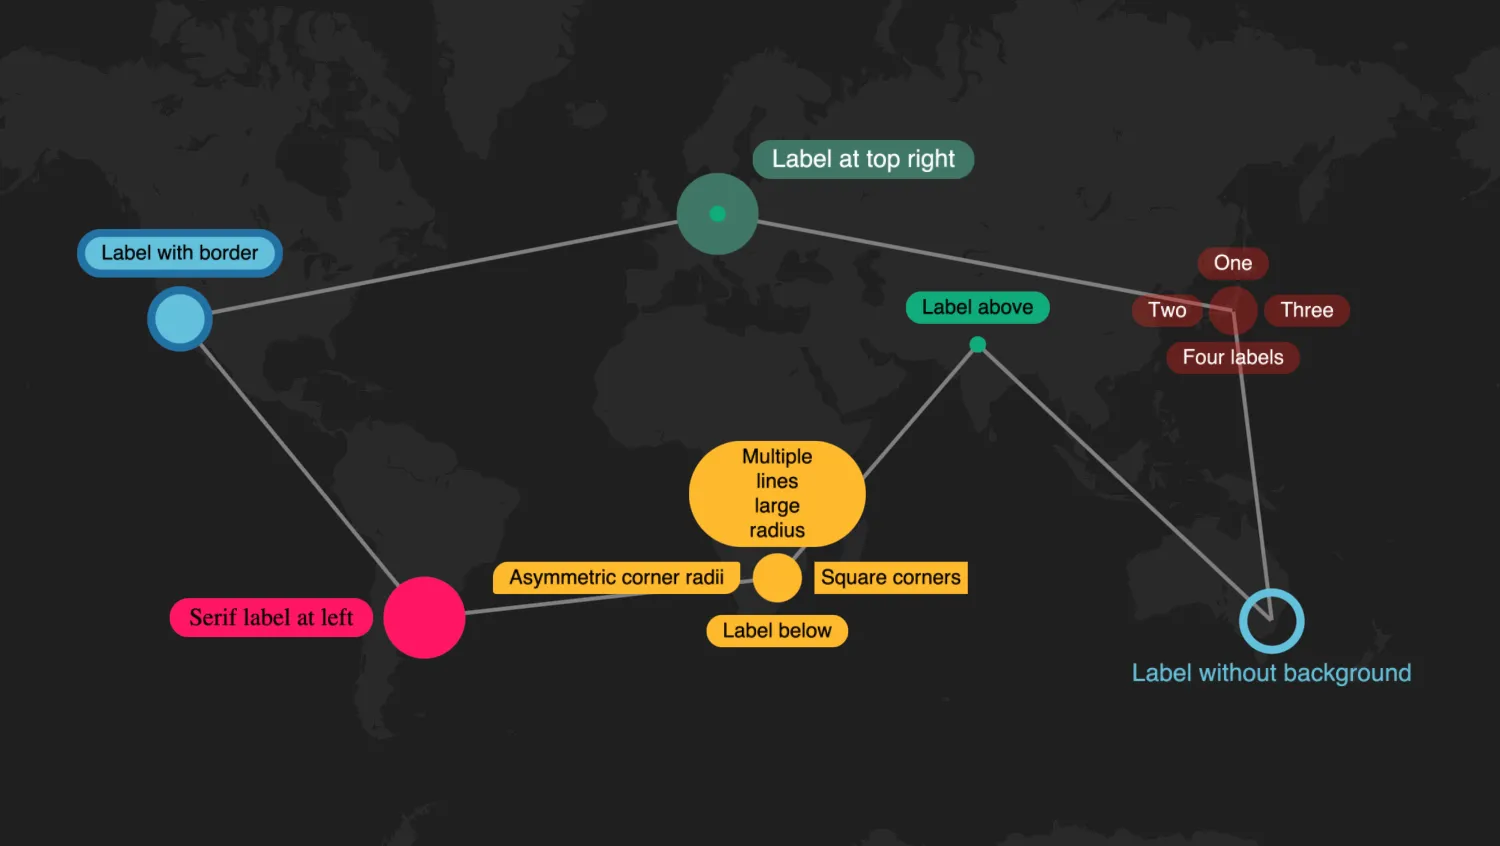
Style Nodes and Labels
Explore different styling options for nodes.
See example
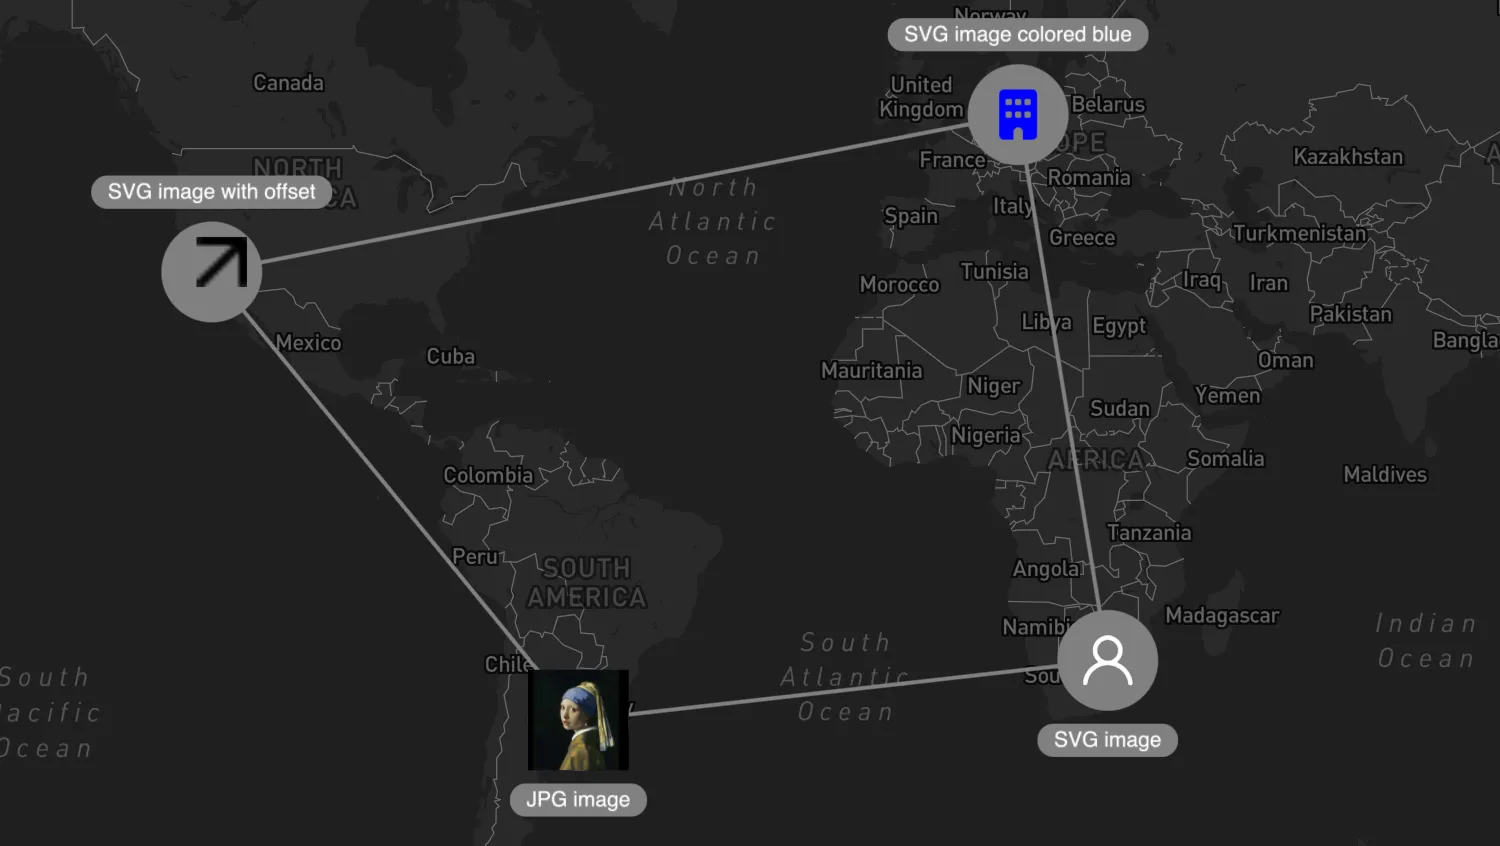
Add Images to Nodes
Style nodes with images.
See example
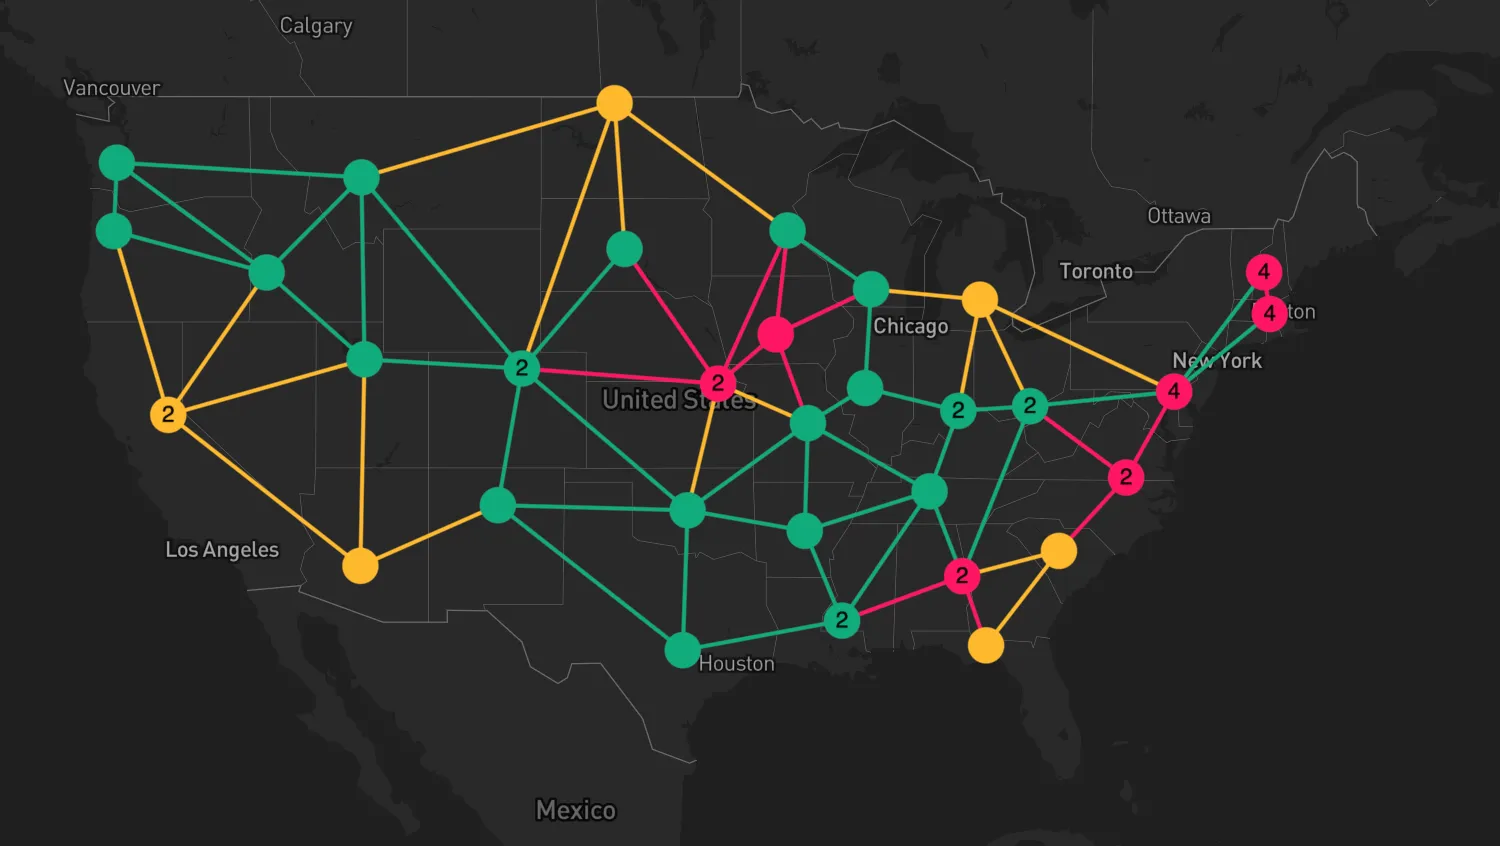
Style Combined Nodes
Style combined nodes and links using custom rules.
See example
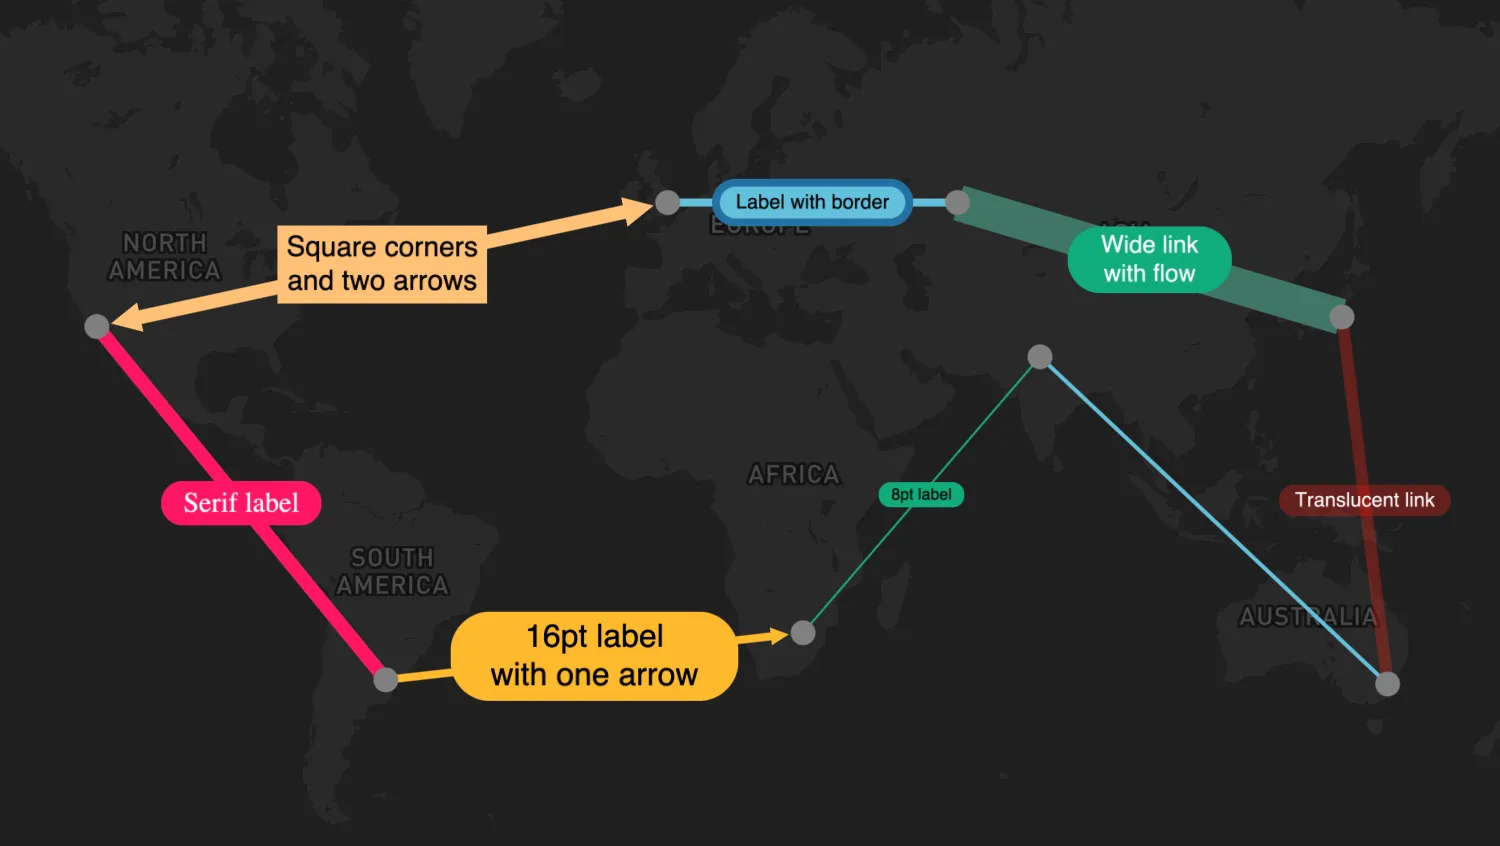
Style Links and Labels
Explore different styling options for links.
See example
Interactions
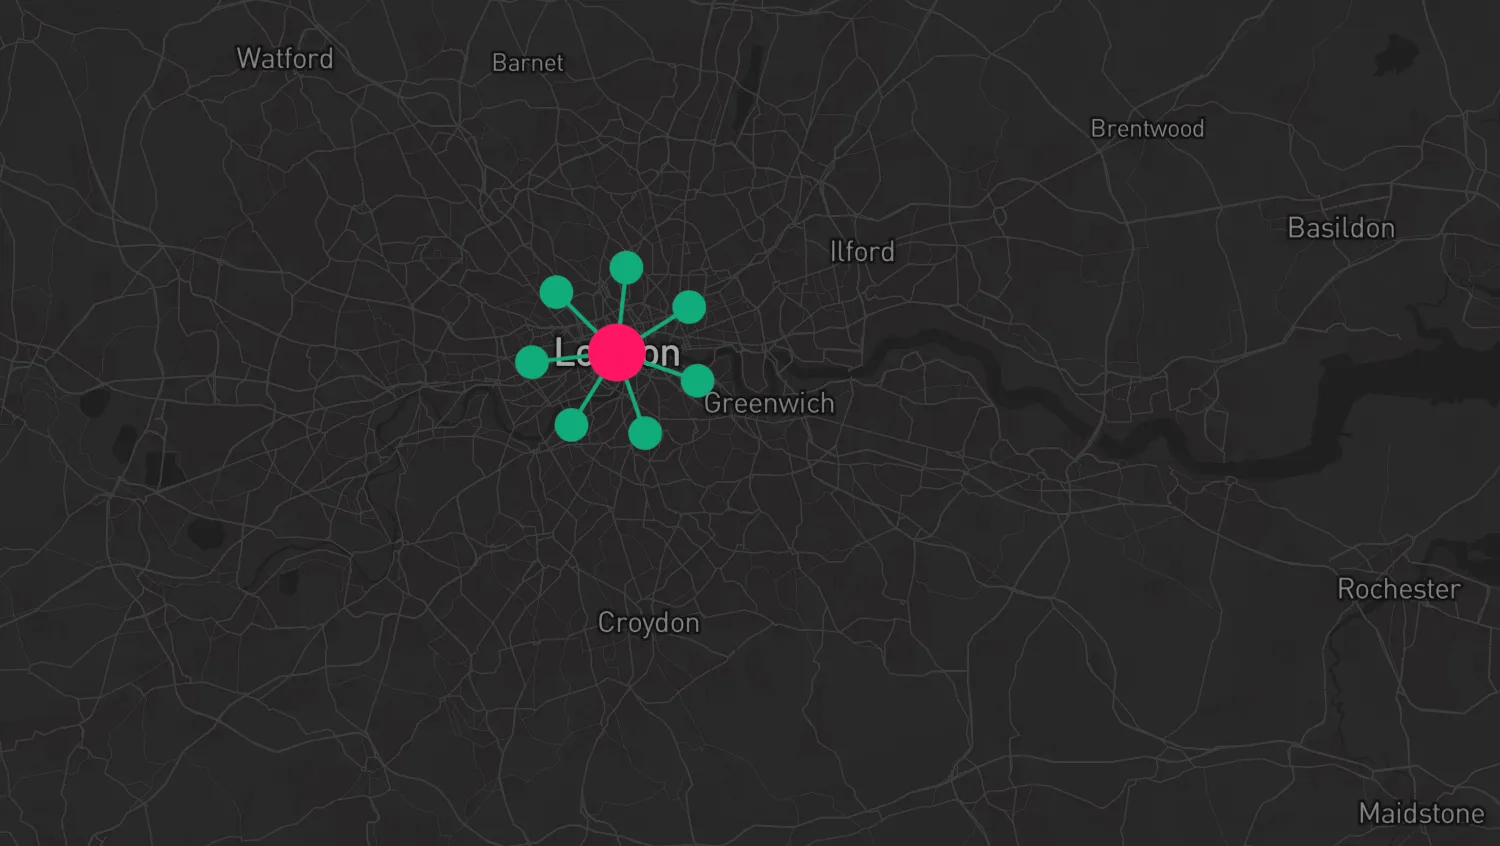
Highlight a Node
Highlight the hovered node with custom styling.
See example
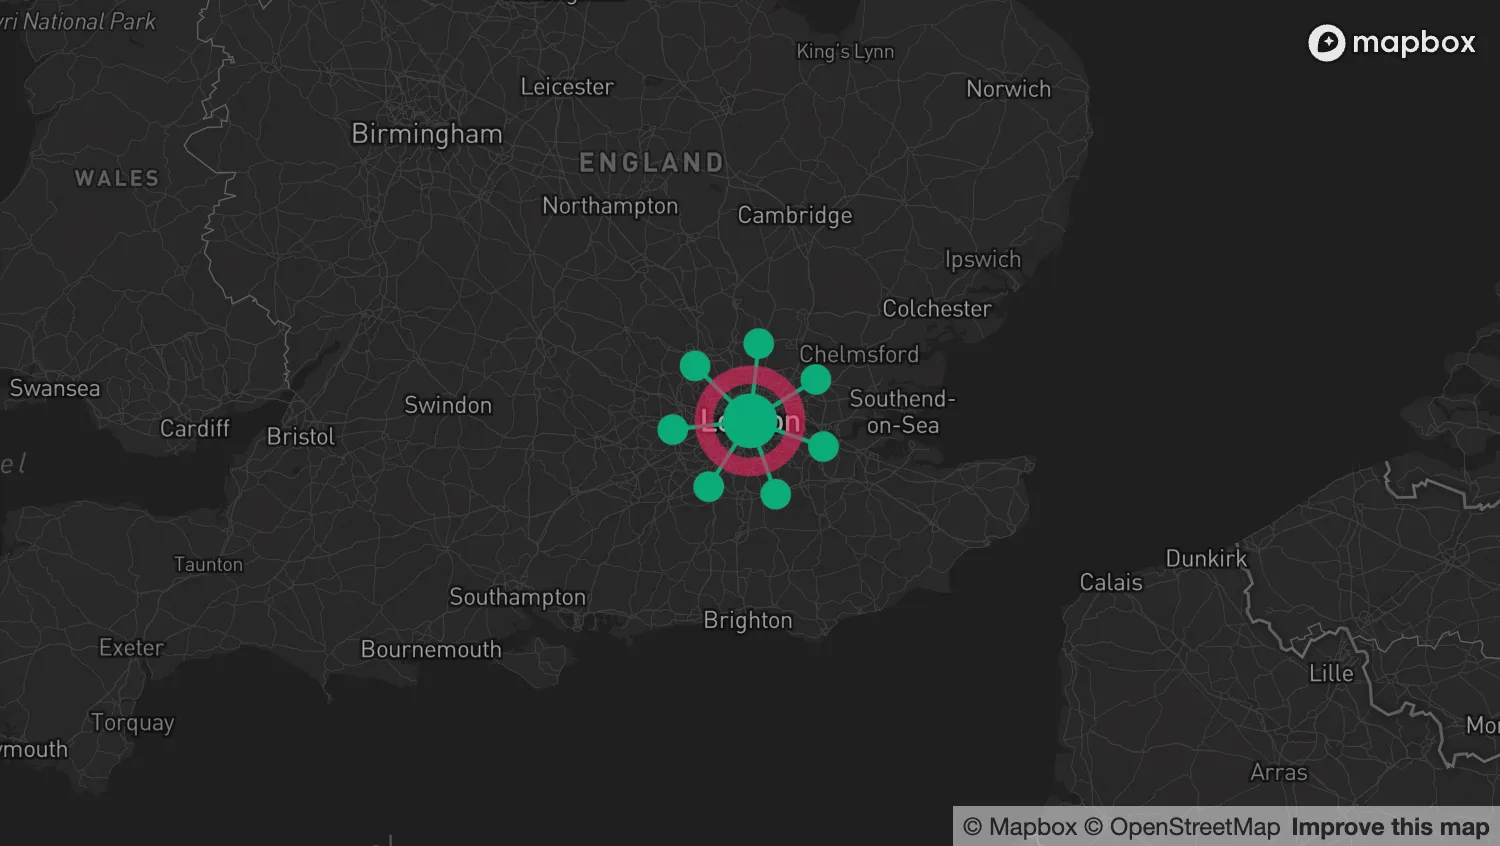
Ping a Node
Spotlight a node with an animated ping.
See example
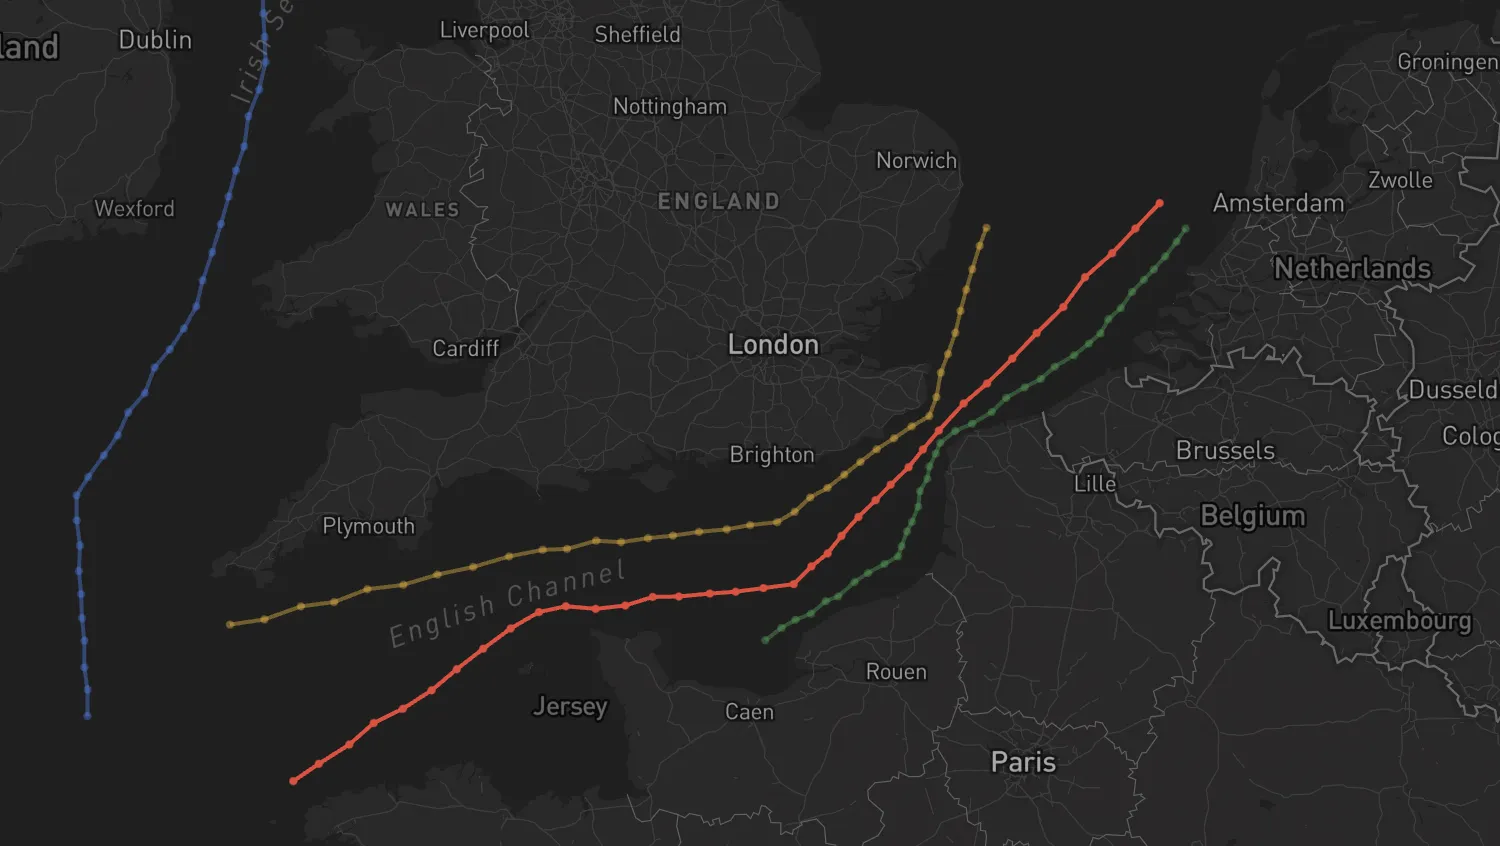
Highlight a Trajectory
Highlight the hovered trajectory with custom styling.
See example
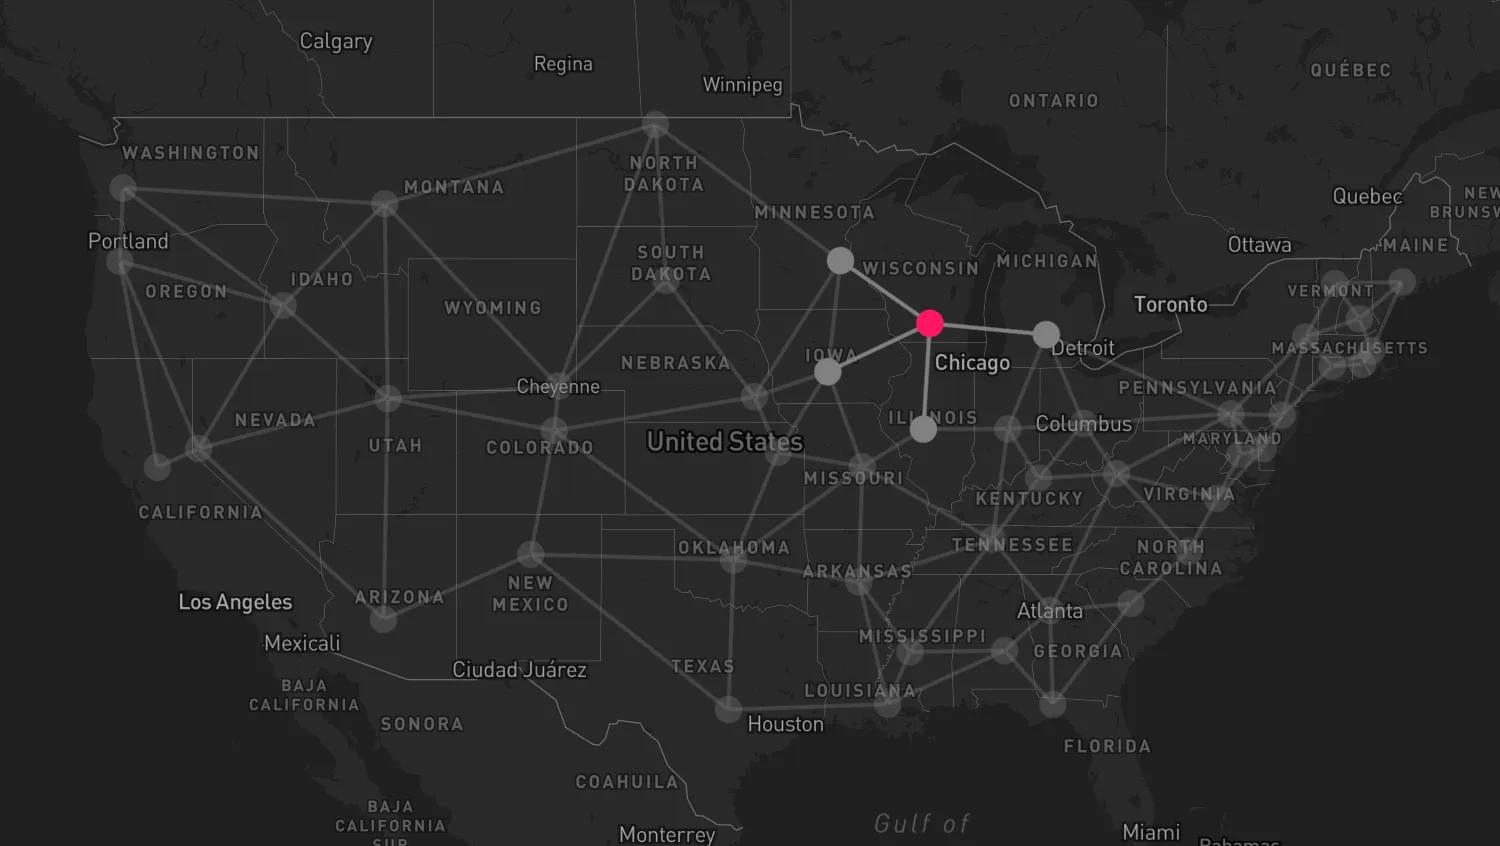
Highlight Neighbors
Highlight the neighbors of a hovered node.
See example
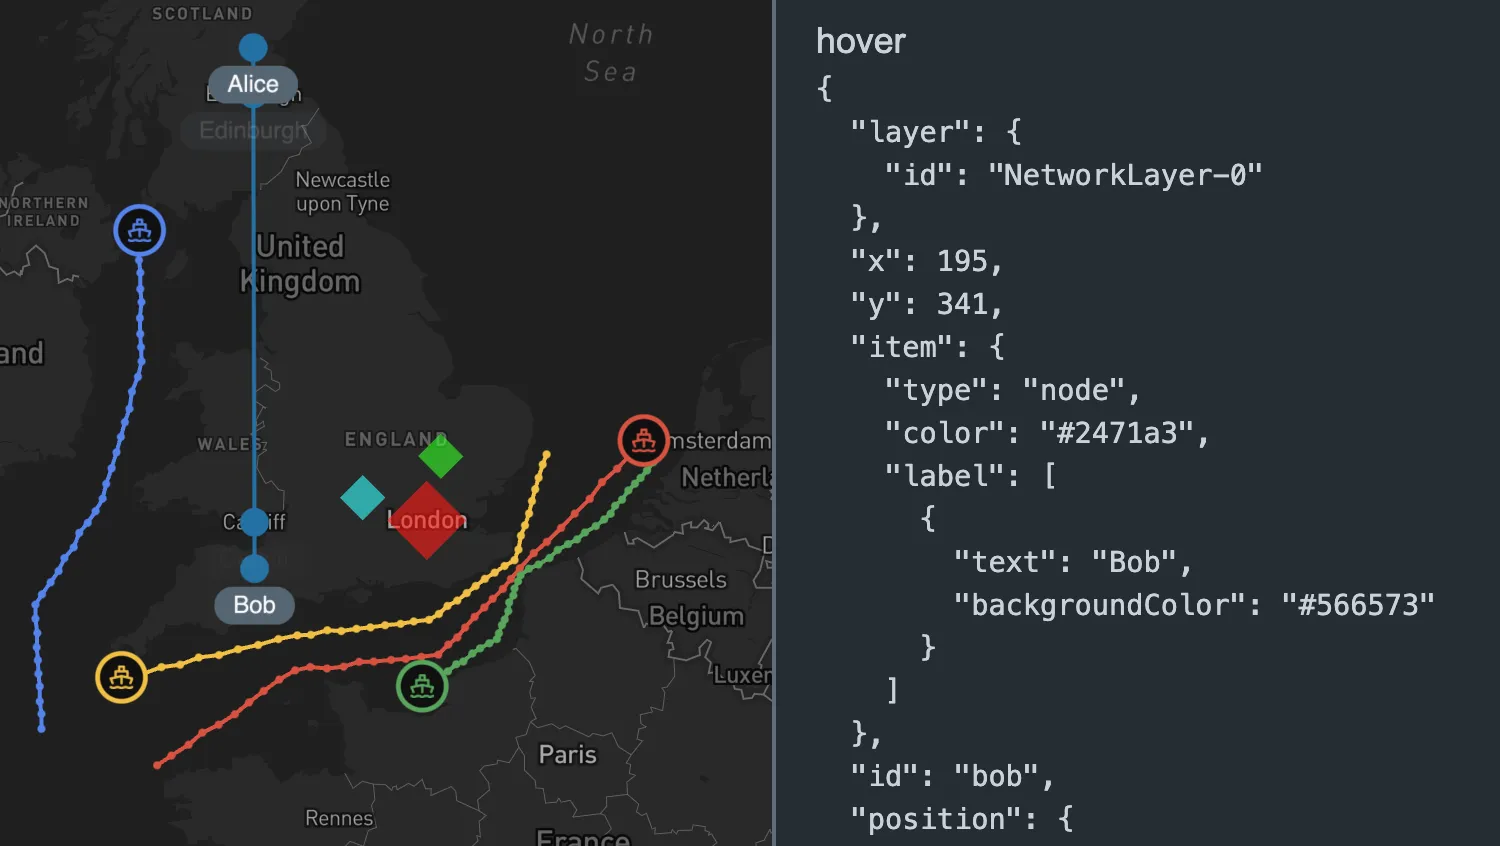
Event Handling
See how MapWeave handles interaction events.
See example
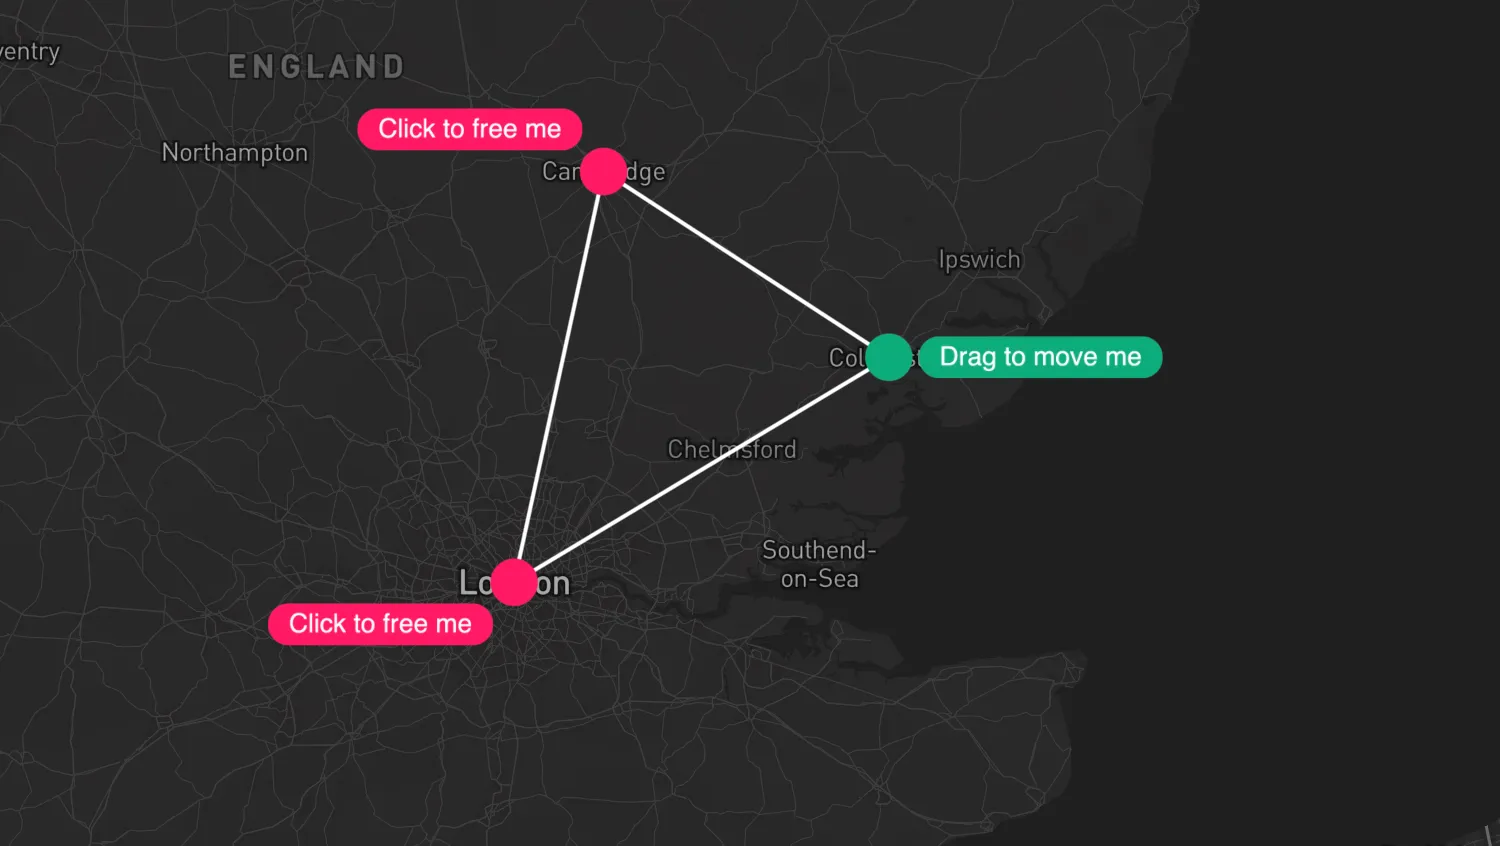
Relocate Fixed Nodes
Use interactions to move geolocated nodes.
See example