Overview
The timeline scale allows you to see when events occur and helps you navigate the timeline.
A linear scale is used by default, showing each individual time period, such as an hour, as the same width as any other.
Sometimes, however, events happen over multiple, separate intervals, in which case, a nonlinear scale, that condenses time periods without any events, can be useful.
This choice of scale, is referred to as the scale mode.
Similarly, sometimes, you might want to explore how events repeat over a period, such as a day or week. This is controlled using scale wrapping, sometimes referred to as "pattern of life" analysis.
Scale Mode
By default, KronoGraph spaces events along the timeline in relation to a linear scale. However, a dataset might have lots of events clustered closely together, followed by periods where no events occur. If this is the case, it can be useful to change the scaleMode to nonlinear to space the events proportionally, reduce the amount of empty space and allow for a larger time range to be seen at once.
The following timeline shows the dates of notable inventions and uses the nonlinear scale to stretch and compress time where needed, allowing more inventions to be shown in the same view. For example, there are more than 1500 years between the invention of paper and the printing press, but the nonlinear scale mode compresses the gap to make better use of the space in the timeline.
Default
Log in to view live examplestimeline.options({
scales: {
scaleMode: 'nonlinear'
}
});<Timeline
options={{
scales: {
scaleMode: 'nonlinear'
}
}}
/>By default, when an entity is focused, the timeline is rescaled for visible events. Disable this behavior by setting the rescale option to 'false'.
See the Nonlinear Scale Mode story to try it out.
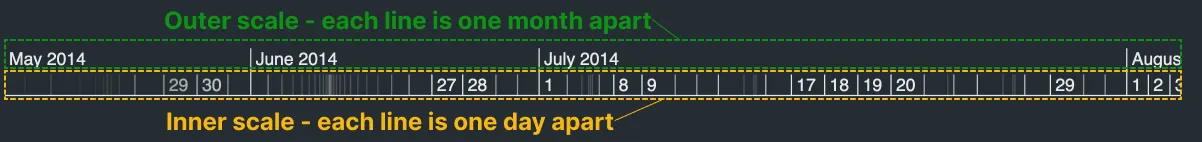
The nonlinear scale is made up of an inner and outer scale. The outer scale gives context while the inner scale provides a more accurate indication of the date and time. Each vertical tick mark is drawn at a regular time interval, which shows how much time is compressed or expanded on the scale.
Customize the display of the scale with dateOrder and twelveHourClock. Currently, dateTimeFormats and dateTimeNames aren't supported using the nonlinear scale.
Note that when the scale mode is set to 'nonlinear', time series charts will be hidden.
Scale Wrapping
By default, the timeline shows time progressing, and displays events in the order in which they occurred, using a linear timescale (see also Scale Mode).
Sometimes, however, rather than seeing events sequentially, you might want to see how they occur by day of the week, or by date of the month. KronoGraph allows you to do this by using scale wrapping, enabling you to visualize and investigate repeating patterns, sometimes referred to as "pattern of life" analysis.
The following example shows how events occurring over many months can be visualized according to what time of the week they happened.
When wrapped by week, you can zoom in to see detail, but you can't zoom out any further than a week (as that's what your scale is being wrapped by).
Scale Wrapping
Log in to view live examplesYou can change the timeline's scale wrapping by setting the wrapping option, for example:
options={{
  scales: {
    wrapping: 'week'
  }
}}
timeline.options({
  scales: {
    wrapping: 'week'
  }
});
KronoGraph provides the following scale wrapping options:
| Wrapping Option | Length of Scale | How Events are Positioned |
|---|---|---|
day | One day | By the hour of day at which they occurred |
week | One week | By the elapsed time since the start of their week |
month | 31 days | According to the date they occur within their month |
year | One year | By the elapsed time since the start of their year |
When scale wrapping is used:
- The scales show generic times, such as 'Monday', rather than specific dates and times. You can still zoom in to see details of events occurring over a part of the wrapping period. For example, if scale wrapping by week, you can zoom in to see activity for Fridays between 5 and 6pm.
- The timeline.fit() function fit() instance method fits the view to the whole wrapped interval (rather than to the range of time in which events occur).
Internally, scale wrapping uses a "base range" of times for each wrapping option, which it maps event times to. If you call timeline.range() If an onTimelineChange event containing a range object is invoked when the scale is wrapped, the times in the returned range event's range object are relative to this.
The base ranges for each wrapping option are:
| Wrapping | Start | End |
|---|---|---|
day | 12 am on Jan 1, 2000 | 12 am on Jan 2, 2000 |
week | 12 am on Monday, Jan 3, 2000 | 12 am on Monday, Jan 10, 2000 |
month | 12 am on Jan 1, 2000 | 12 am on Feb 1, 2000 |
year | 12 am on Jan 1, 2000 | 12 am on Jan 1, 2001 |
So, for example, if wrapping by week, and zooming in to 'Tuesday', timeline.range() the TimeRange object returns a start date of 12 am, January 4, 2000, and an end date of 12 am, January 5, 2000 (which was a Tuesday). Conversely, if you call timeline.range() as a setter, pass a value to the range prop, the dates you provide should be relative to the base range.
Timestamps passed to event handlers for UI events such as click or hover onTimelineClick or onTimelineHover are also relative to the base range.
Check out the Scale Wrapping story to see an example of scale wrapping in action.
Note that if scale wrapping is applied, time series charts will be hidden.
Scale Localization
Dates and times are displayed in the scale in US English format by default. You can use the dateOrder and twelveHourClock options for basic adjustment of the US English format.
For further customization of the displayed date and time you can use:
- dateTimeFormats for different scale zoom levels and wrapping options. Each one is a string containing formatting codes and/or literal characters.
- dateTimeNames for months and days of the week, as well as the AM/PM symbols.
timeline.options({
  scales: {
    dateTimeFormats: {
      date: 'yyyy-MM-dd',
    },
  },
});| Code | Definition | Example |
|---|---|---|
f | 1⁄10 of a second | 5 |
ff | 1⁄100 of a second | 50 |
fff | 1⁄1000 of a second | 500 |
ffff | 1⁄10000 of a second | 5000 |
fffff | 1⁄100000 of a second | 50000 |
ffffff | 1⁄1000000 of a second | 500000 |
fffffff | 1⁄10000000 of a second | 5000000 |
ffffffff | 1⁄100000000 of a second | 50000000 |
fffffffff | 1⁄1000000000 of a second | 500000000 |
s | seconds without leading zero | 5 |
ss | seconds with leading zero | 05 |
m | minutes without leading zero | 5 |
mm | minutes with leading zero | 05 |
h | hour using a 12-hour clock, without leading zero | 1 |
hh | hour using a 12-hour clock, with leading zero | 01 |
H | hour using a 24-hour clock, without leading zero | 1 |
HH | hour using a 24-hour clock, with leading zero | 01 |
t | first character of AM/PM symbol | A |
tt | AM/PM symbol | AM |
d | day of month without leading zero | 1 |
dd | day of month with leading zero | 01 |
ddd | short name of day of week | Mon |
dddd | full name of day of week | Monday |
M | number of month of year without leading zero | 1 |
MM | number of month of year with leading zero | 01 |
MMM | short name of month of year | Jan |
MMMM | full name of month of year used as part of a date | January |
MMMMM | full name of month of year used on its own | January |
yy | last two digits of year number | 21 |
yyyy | full year number | 2021 |
| Default Setting | Code | Example |
|---|---|---|
| centiseconds | .ff | .41 |
| milliseconds | .fff | .001 |
| hundredMicroseconds | .ffff | .0001 |
| tenMicroseconds | .fffff | .00001 |
| microseconds | .ffffff | .000001 |
| hundredNanoseconds | .fffffff | .0000001 |
| tenNanoseconds | .ffffffff | .00000001 |
| nanoseconds | .fffffffff | .000000001 |
| date | MMMM d, yyyy | January 13, 2025 |
| dateNoYear | MMMM d | January 13 |
| dateNoYearTime | MMMM d h:mm tt | January 13 4:51 PM |
| dateNoYearTimeSeconds | MMMM d h:mm:ss tt | January 13 4:51:13 PM |
| dateTimeSeconds | MMMM d, yyyy h:mm:ss tt | January 13, 2025 4:51:13 PM |
| dayOfMonth | d | 13 |
| dayOfMonthTimeSeconds | d h:mm:ss t | 13 4:51:13 PM |
| fullDayOfWeek | dddd | Monday |
| fullDayOfWeekTime | dddd h:mm tt | Monday 4:51 PM |
| fullDayOfWeekTimeSeconds | dddd h:mm:ss tt | Monday 4:51:13 PM |
| fullMonth | MMMM | January |
| fullMonthYear | MMMM yyyy | January 2025 |
| shortDayOfWeek | ddd | Mon |
| shortMonth | MMM | Jan |
| time | h:mm tt | 4:51 PM |
| timeSeconds | h:mm:ss tt | 4:51:13 PM |
| timeSecondsTenths | h:mm:ss.f tt | 4:51:13.4 PM |
| timeMilliseconds | h:mm:ss.fff tt | 4:51:13.586 PM |
| timeMicroseconds | h:mm:ss.ffffff tt | 4:51:13.586296 PM |
| timeNanoseconds | h:mm:ss.fffffffff tt | 4:51:13.586296041 PM |
| year | yyyy | 2025 |
You can see some examples of date and time formatting for different locales in the Scales Options story.