Jan is Product Manager for MapWeave. He works on geospatial visualization capabilities that help teams analyze connections and events in their geographic context.
Anti-money laundering
copy url
Graph Timeline Risk and Compliance
Use this showcase if you’re building an application where analysts need to investigate suspicious financial activity across connected accounts. It shows how a graph and timeline can work together to reveal not only where money moved, but how a sequence of transactions began to look suspicious.
What the showcase demonstrates
The showcase presents a suspected money-laundering operation involving individual and business accounts. The graph shows net flow between accounts, with transaction values shown on the links. The timeline shows the payments behind those flows, allowing analysts to move from an account-level picture to the individual transfers that created it.
This matters because laundering behavior can be hard to spot when each payment is viewed on its own. In this example, Woody Rutledge moves money from a Dragon Casino business account through his personal checking account and into ShareInt Trading. The funds later move through Ned Rubio and an offshore account before reaching a legal entity. Seen separately, this activity may not immediately stand out, but when seen as a connected sequence, the flow becomes much easier to question.
Users can combine accounts, highlight flagged transactions and view risk scores. When suspicious payments are highlighted, the graph and timeline update together so analysts can inspect the same activity from both perspectives.
What you can evaluate
For product and engineering teams, this showcase demonstrates how the SDKs can support AML investigation workflows. It shows coordinated graph and timeline views, account grouping, and various styling capabilities for both links and nodes.
The workflow supports a core AML task: follow the money across connected accounts, then explain the sequence of flows that are suspicious.
Presented by

Jan Girman
Product Manager
Jan is Product Manager for MapWeave. He works on geospatial visualization capabilities that help teams analyze connections and events in their geographic context.
More from Cambridge Intelligence
See all →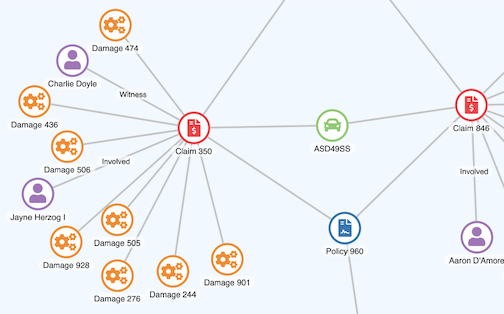
Risk and Compliance
Insurance fraud analysis
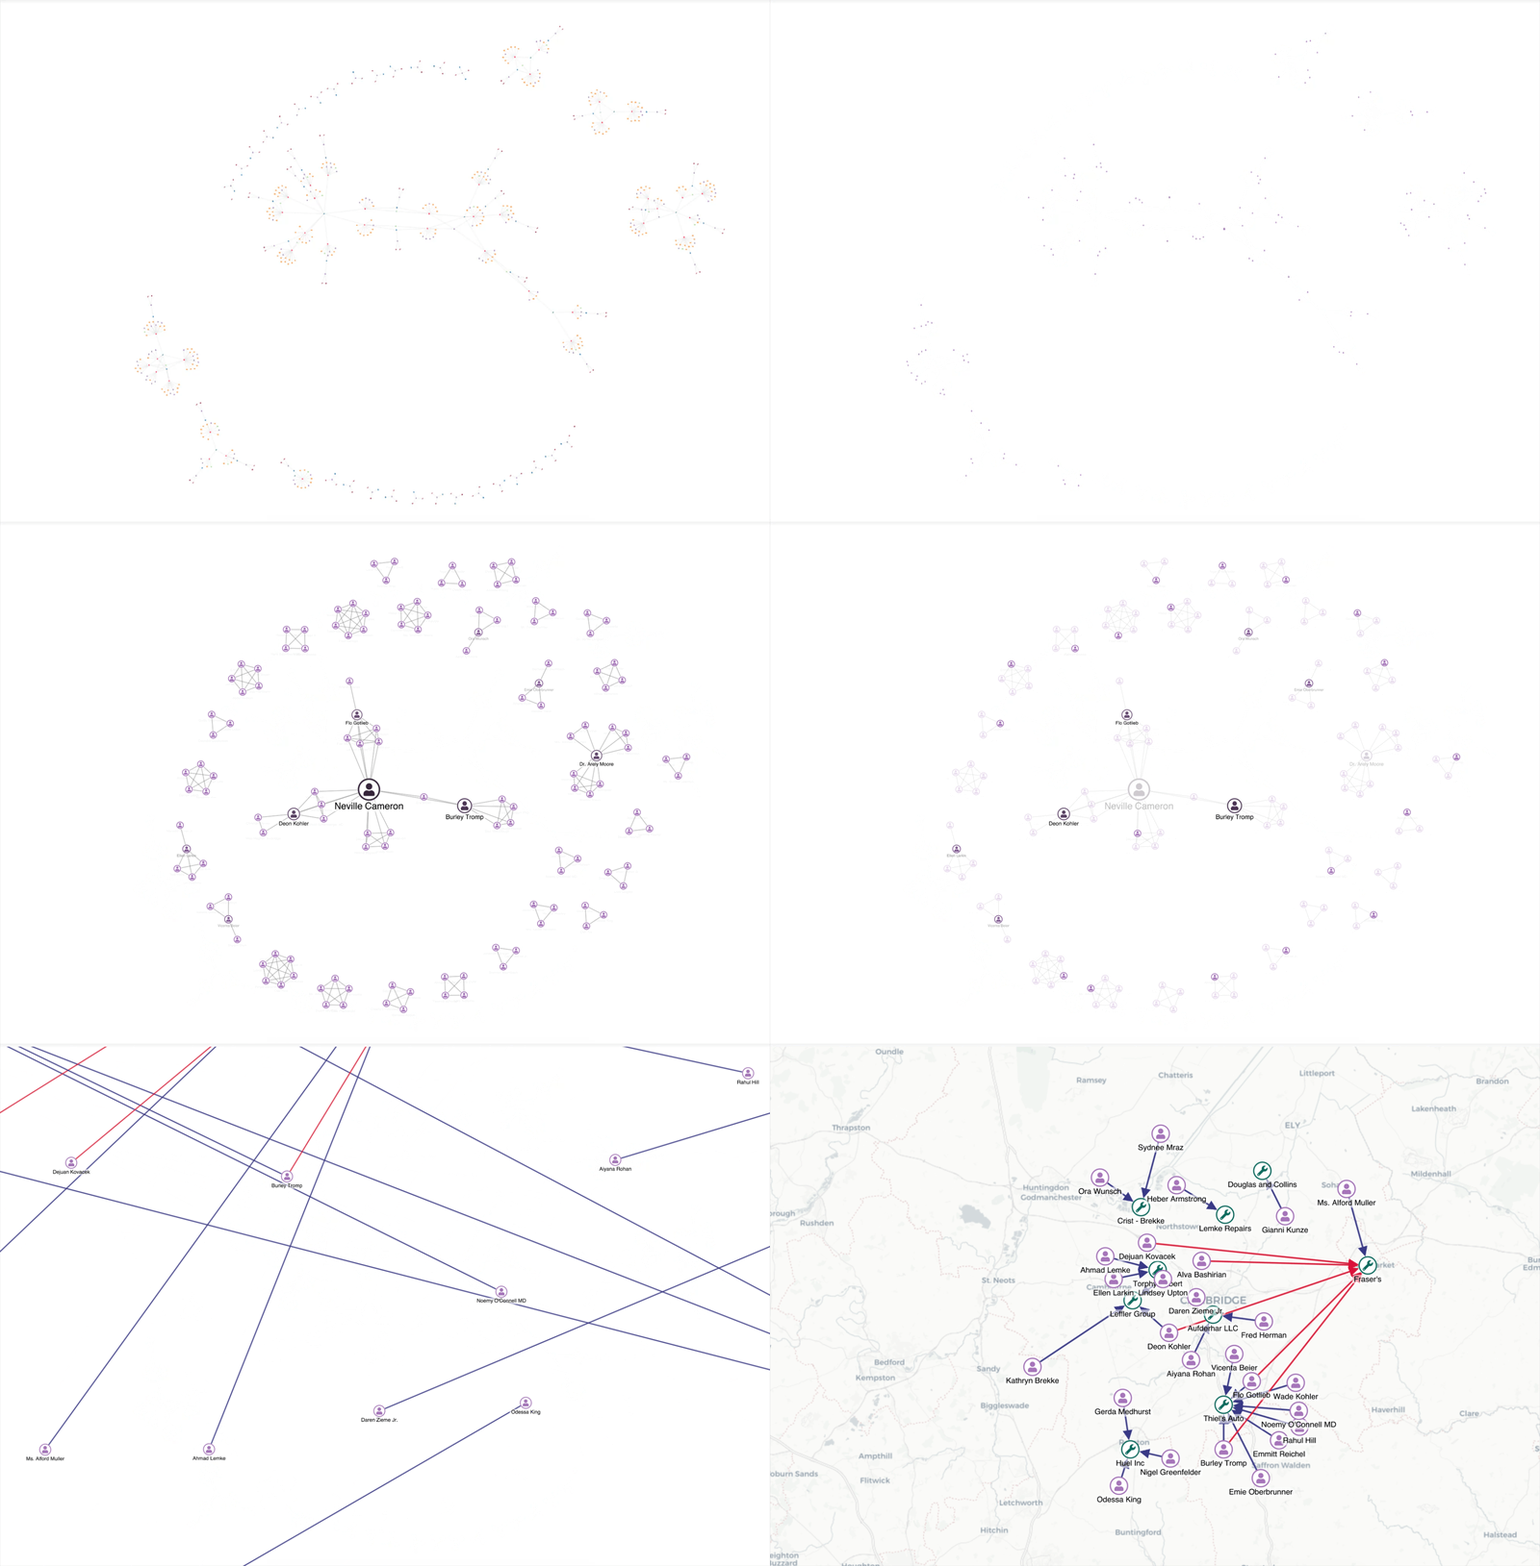
Use this showcase if you’re building an application where analysts need to investigate insurance claims from more than one angle. It shows how a fictional claims dataset can be remodelled into different network views, making suspicious behavior easier to spot than it would be in the raw data alone.
View showcase
Intelligence and Security
Data fusion investigations
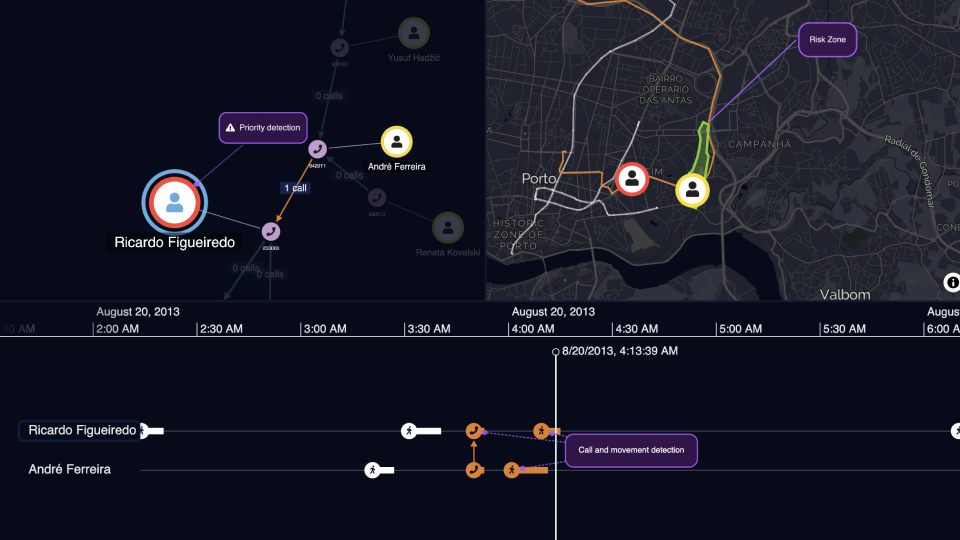
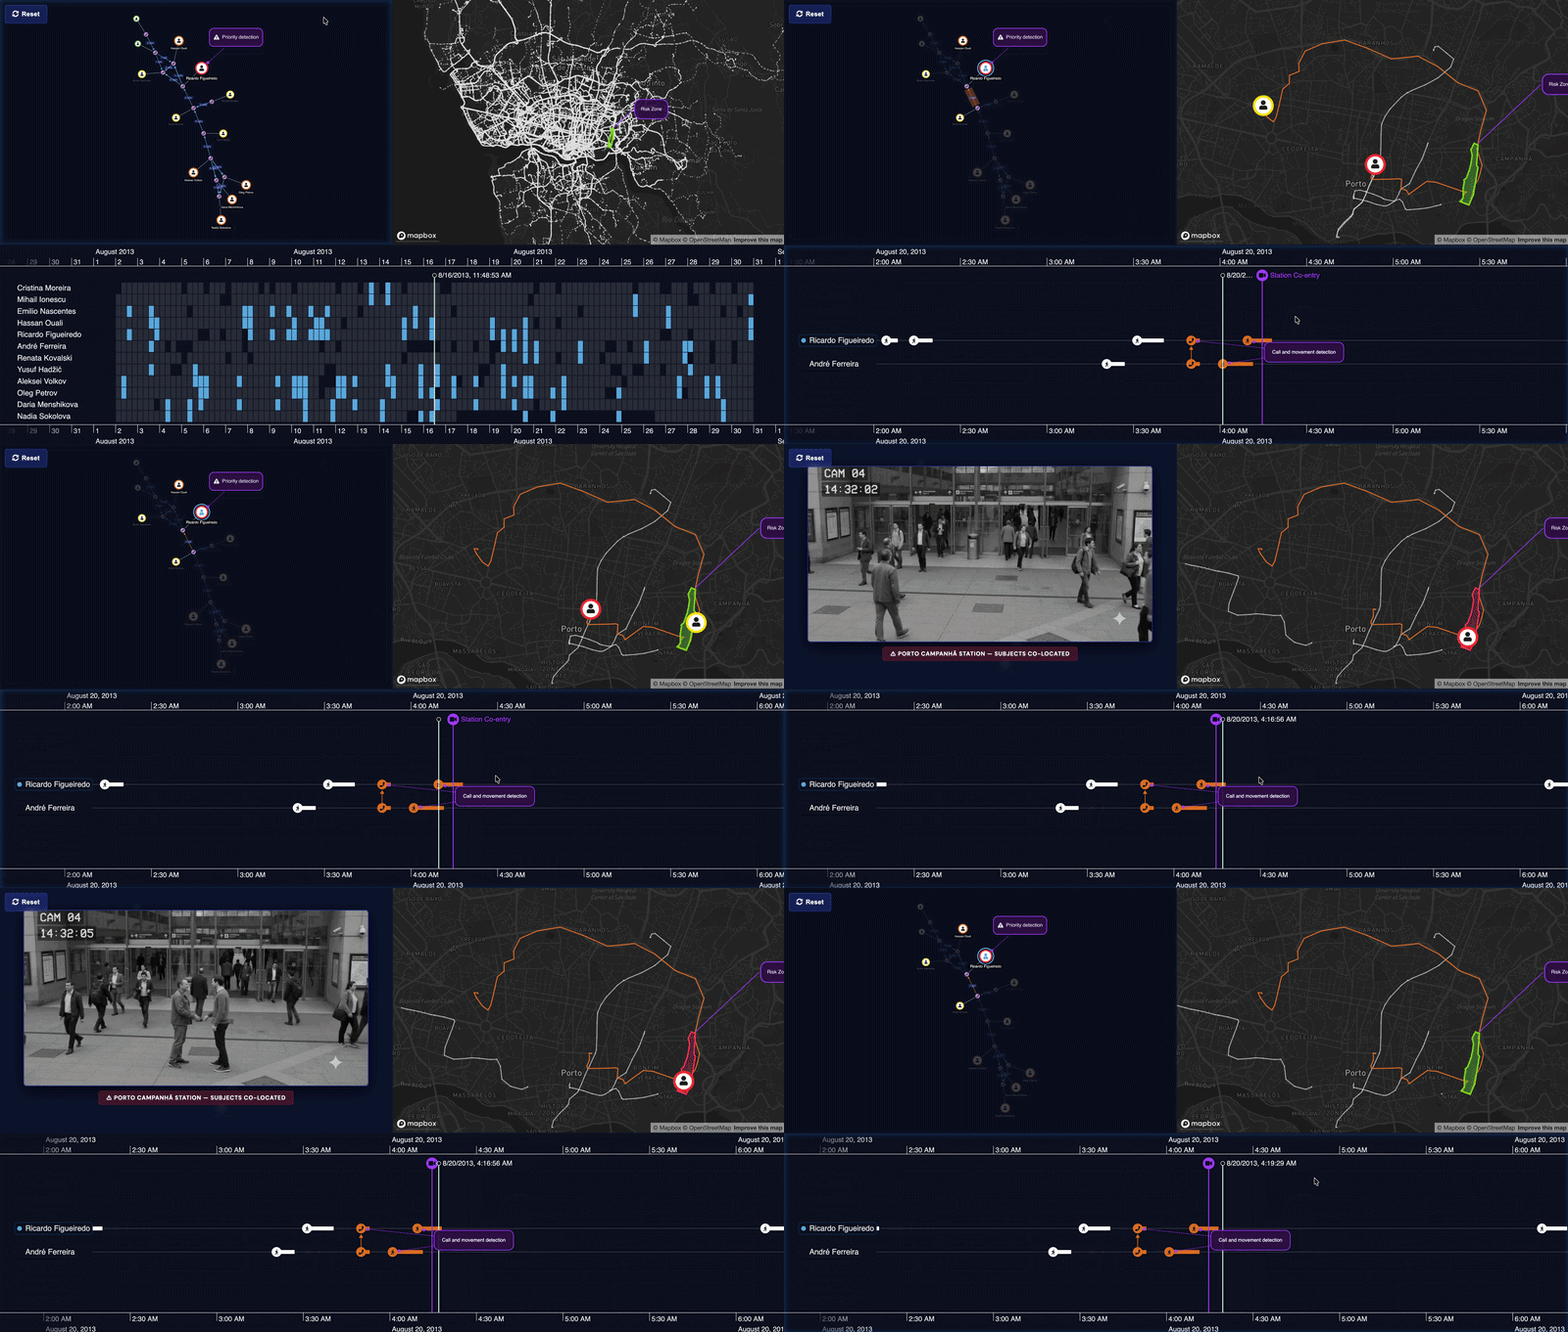
Use this showcase if you’re building an investigation application that needs to connect different data types that complement each other. It shows how a synchronized graph, timeline and map can turn lawful-intercept-style data into a single tool that offers investigators a clearer account of a person’s activity.
View showcase
Intelligence and Security
Phone call analysis
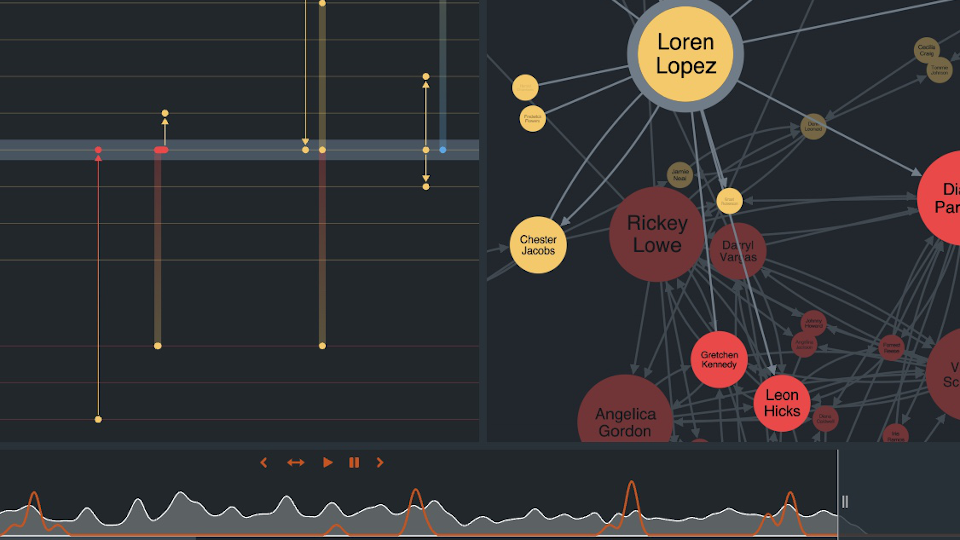
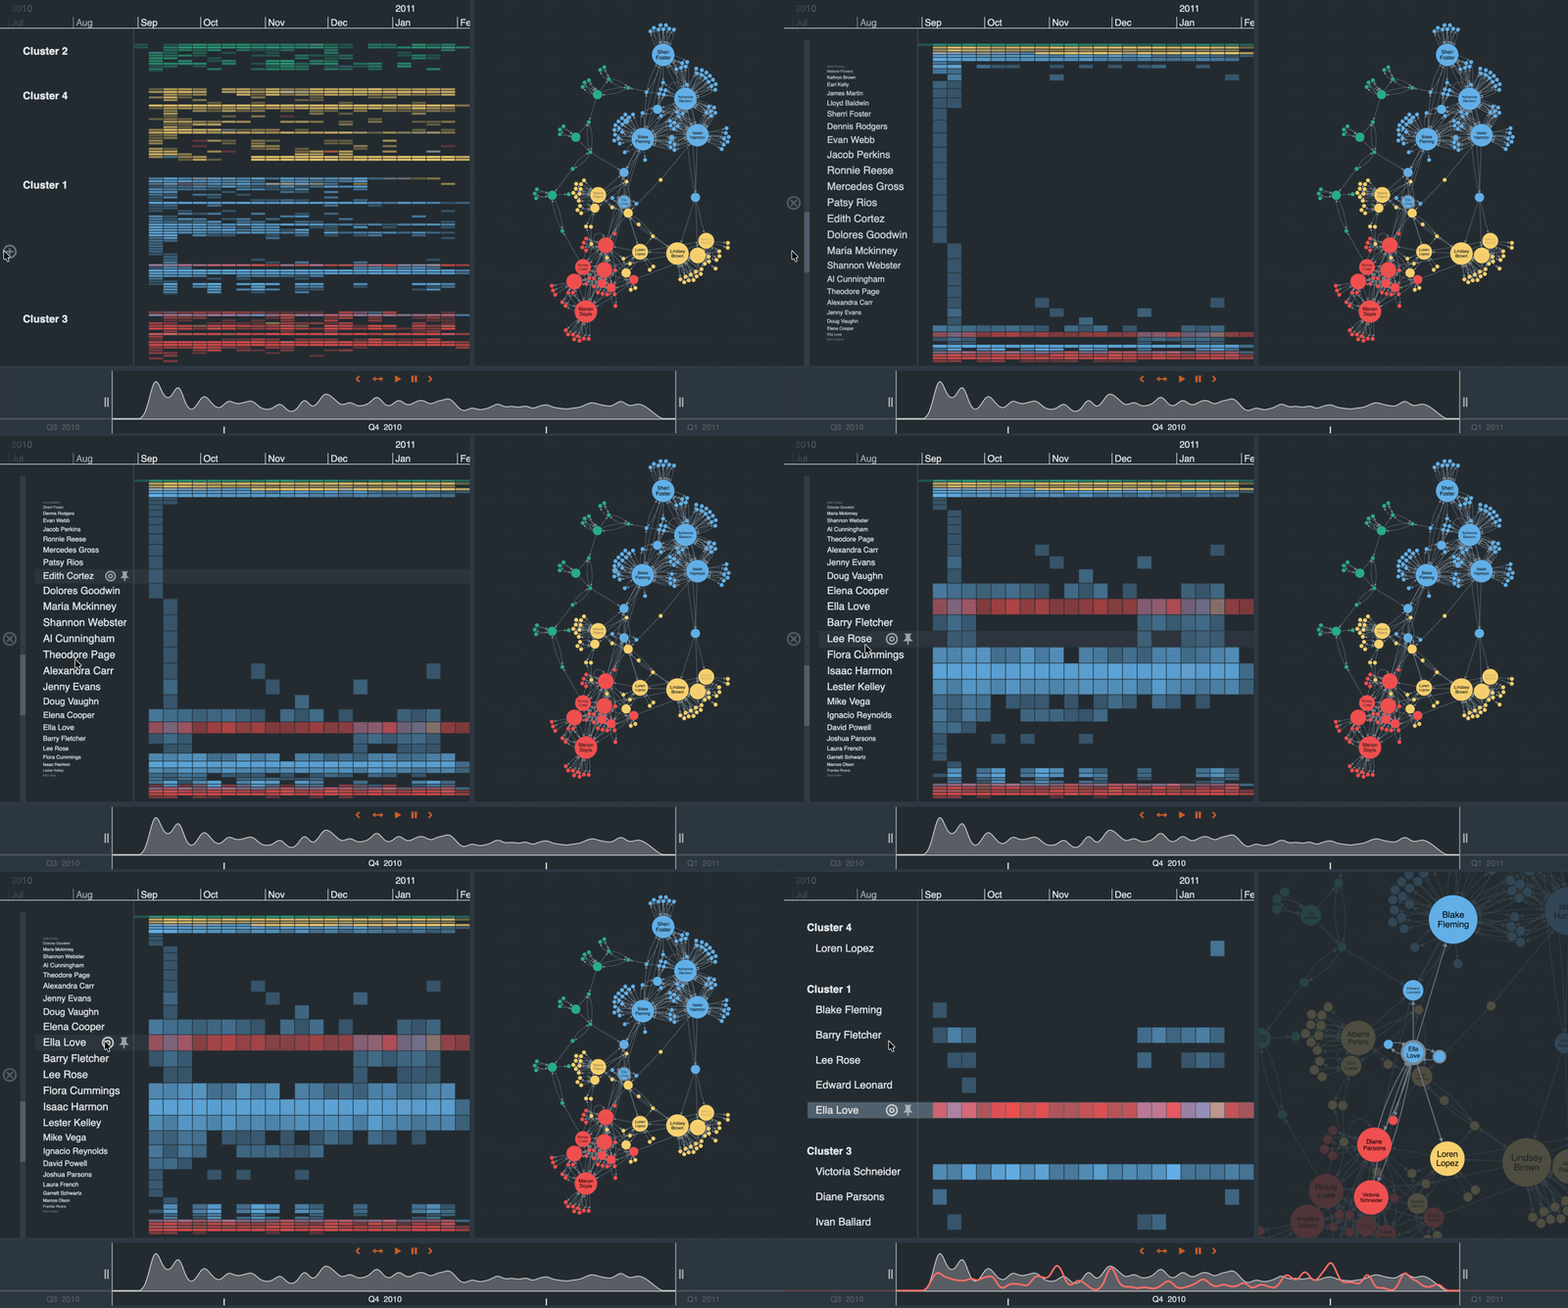
Use this showcase if you’re building an application where analysts need to reconstruct the sequence of calls between people. A network view can show that two individuals are connected, but the timing and volume of their calls can reveal whether that contact was routine, unusual or escalating.
View showcase