What the showcase demonstrates
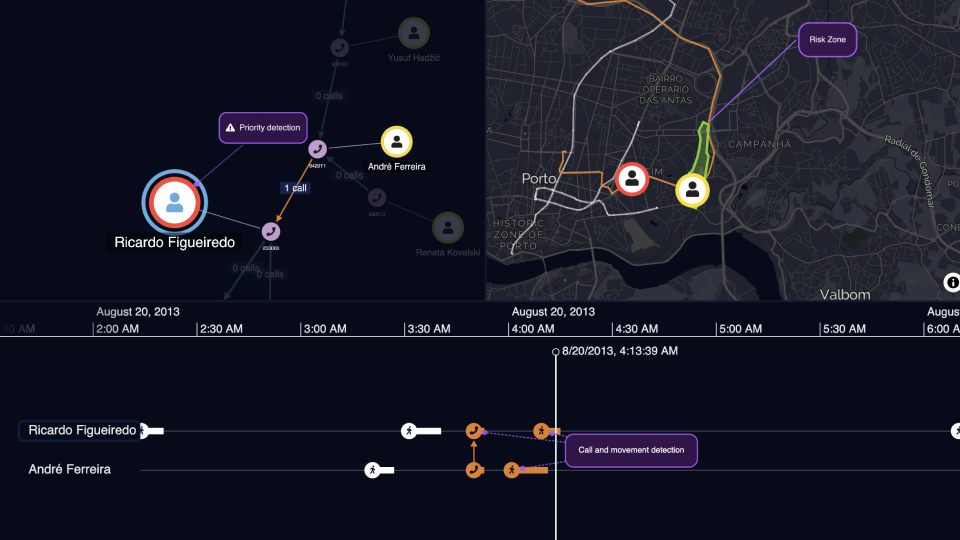
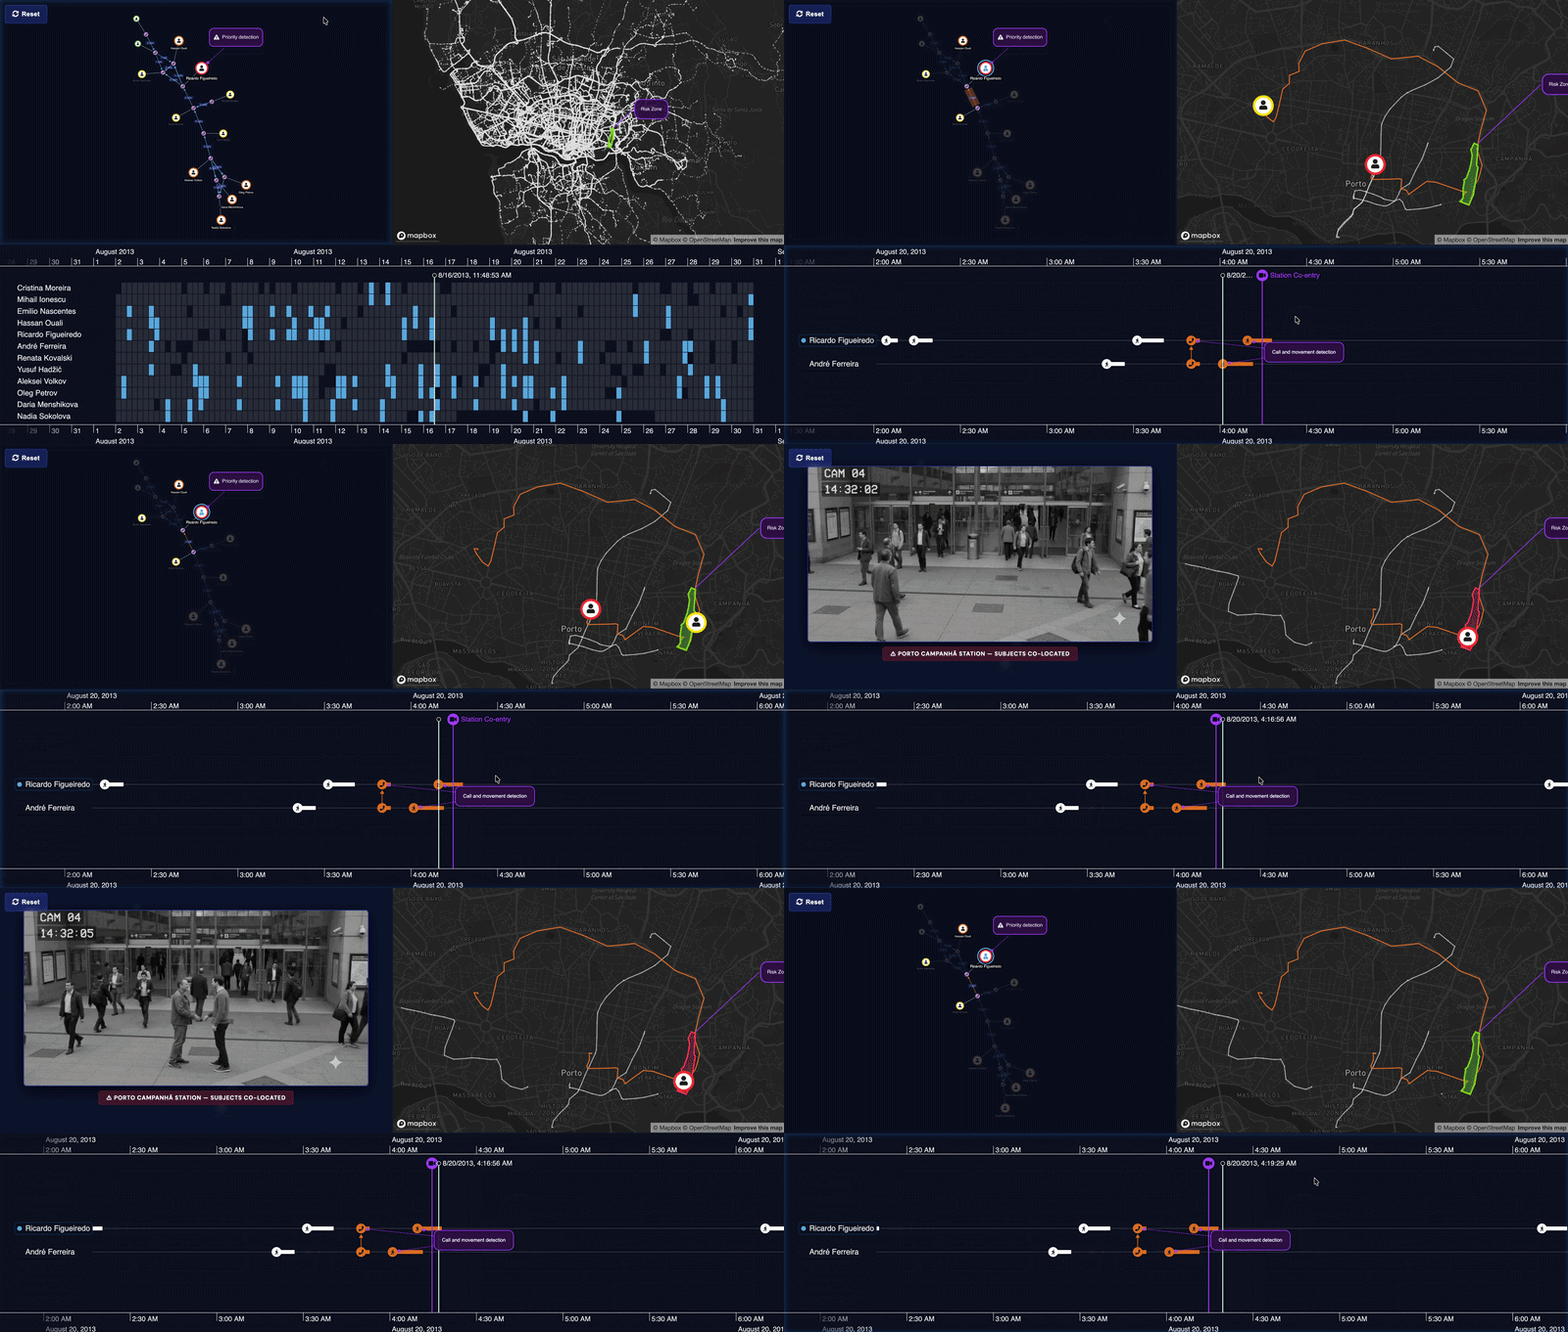
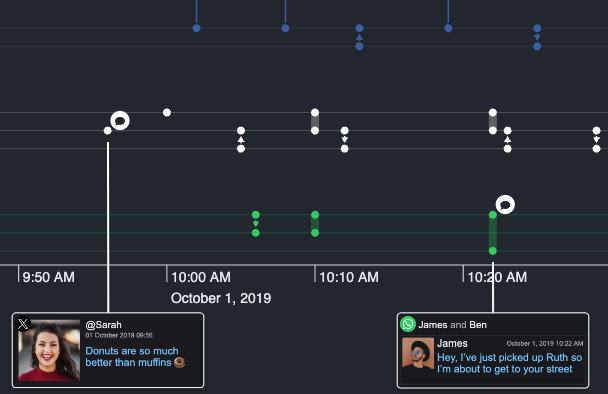
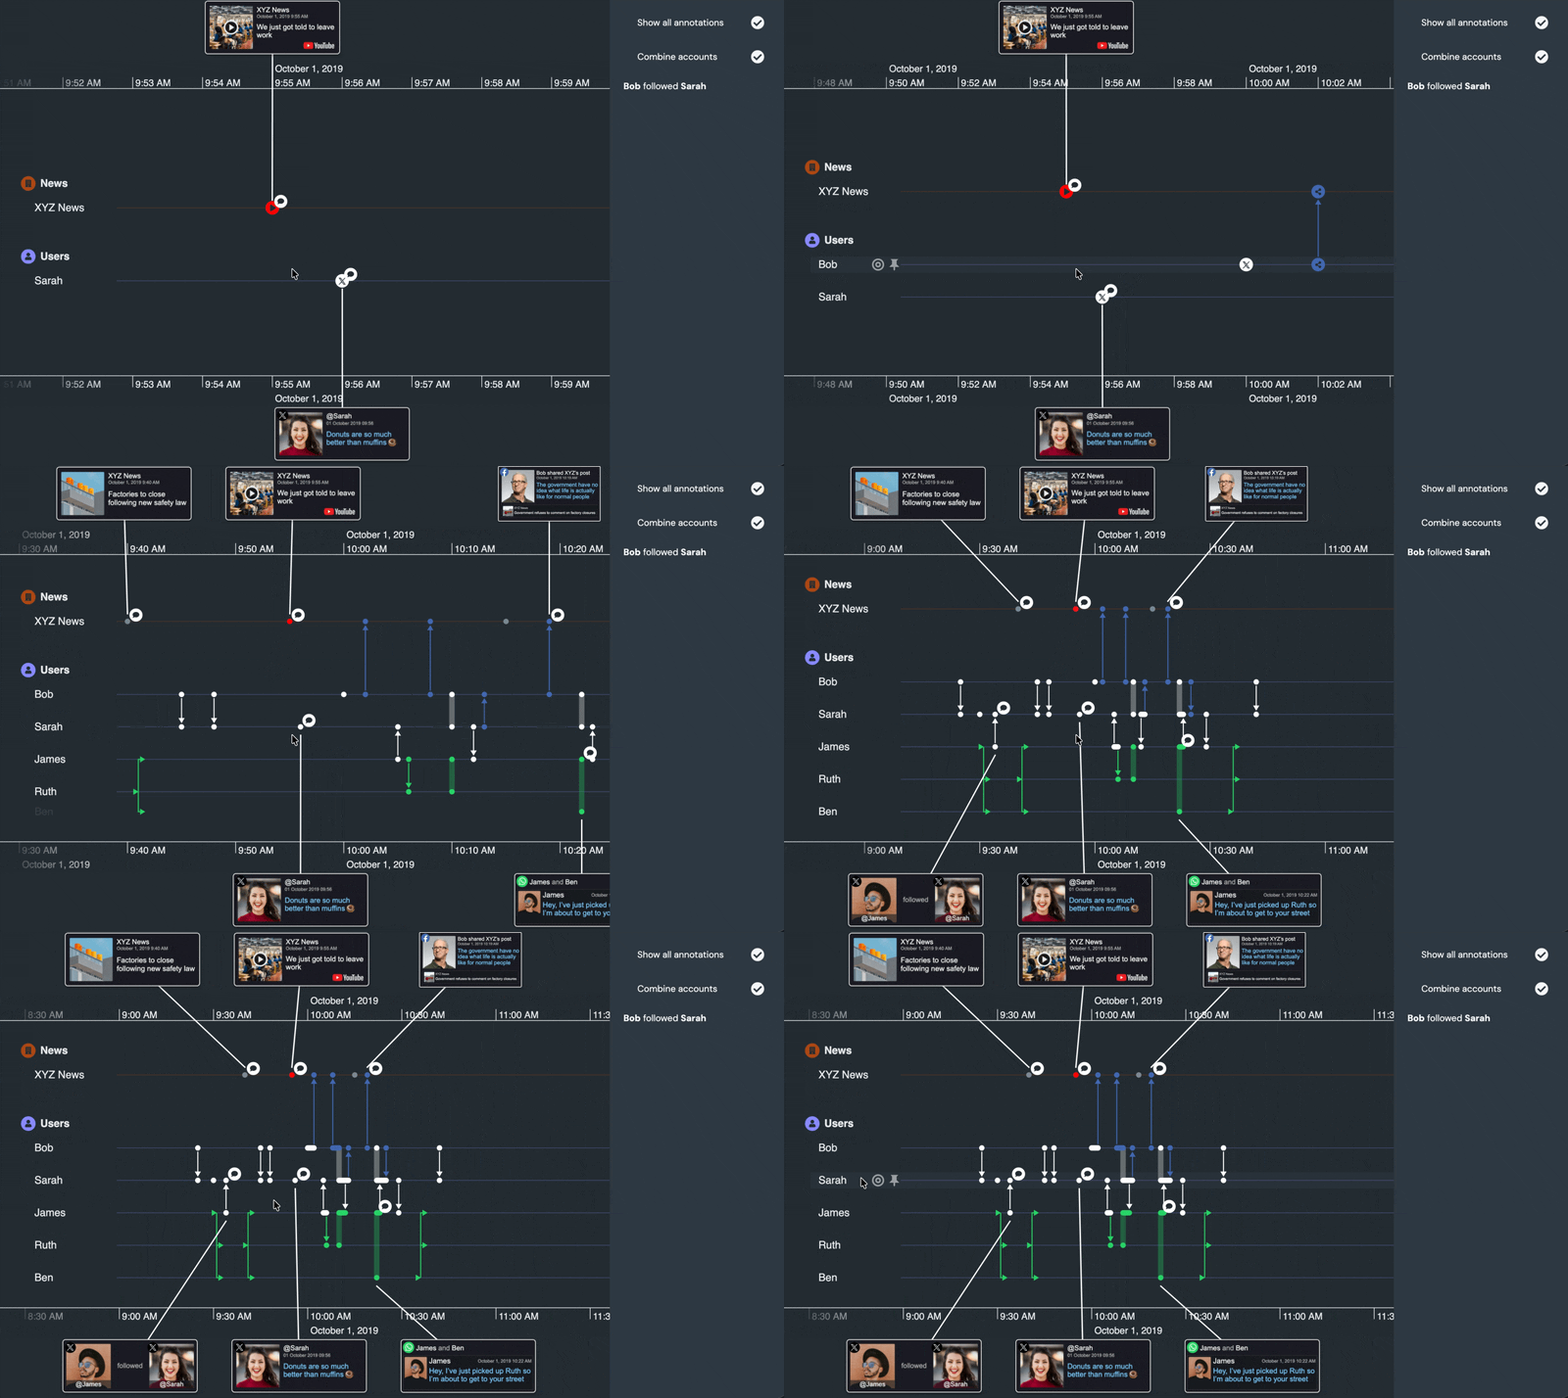

The showcase pairs a communication graph with a synchronized timeline. Selecting a person or connection in the graph brings the relevant call activity into focus on the timeline, so analysts can see when conversations happened and how they developed over time.
The timeline can also drive the investigation. Zooming into a specific period filters the graph to show the people and calls active in that time window, helping users move from a broad communication network to the moments that need closer attention.
In this example, the workflow highlights a month when Edward Leonard received an unusually high number of calls from Albert Peters. The graph shows how they are connected in the network, while the timeline shows when their communication volume changed.
What you can evaluate
For product and engineering teams, this showcase demonstrates how the SDKs can support communication analysis workflows that combine connected data with time-based events. It shows how graph selection, timeline zooming, heatmaps and synchronized filtering can help users investigate relationships without losing the sequence of activity behind them.
The workflow adds time to the network: a user can see who contacted whom, but also when the calls happened, how often they occurred and when the pattern started to stand out.