What the showcase demonstrates
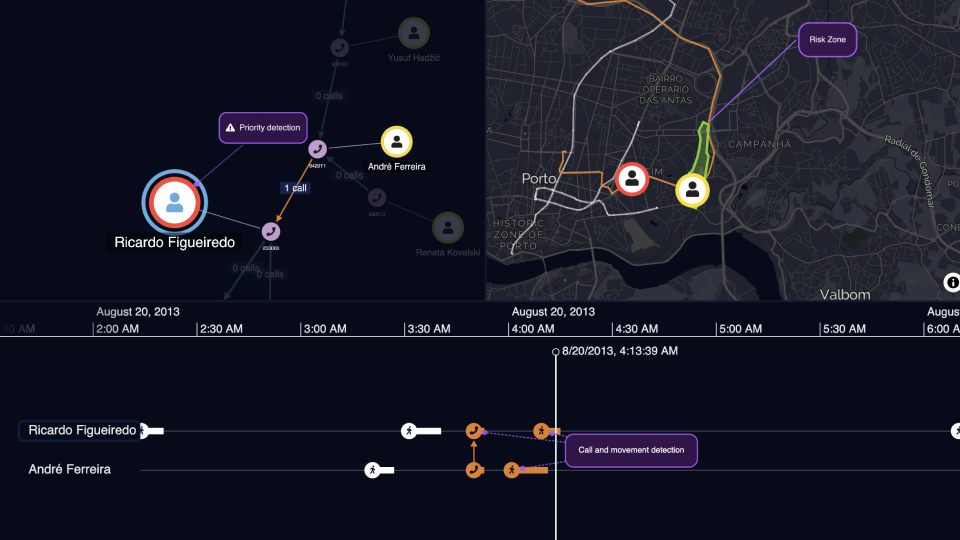
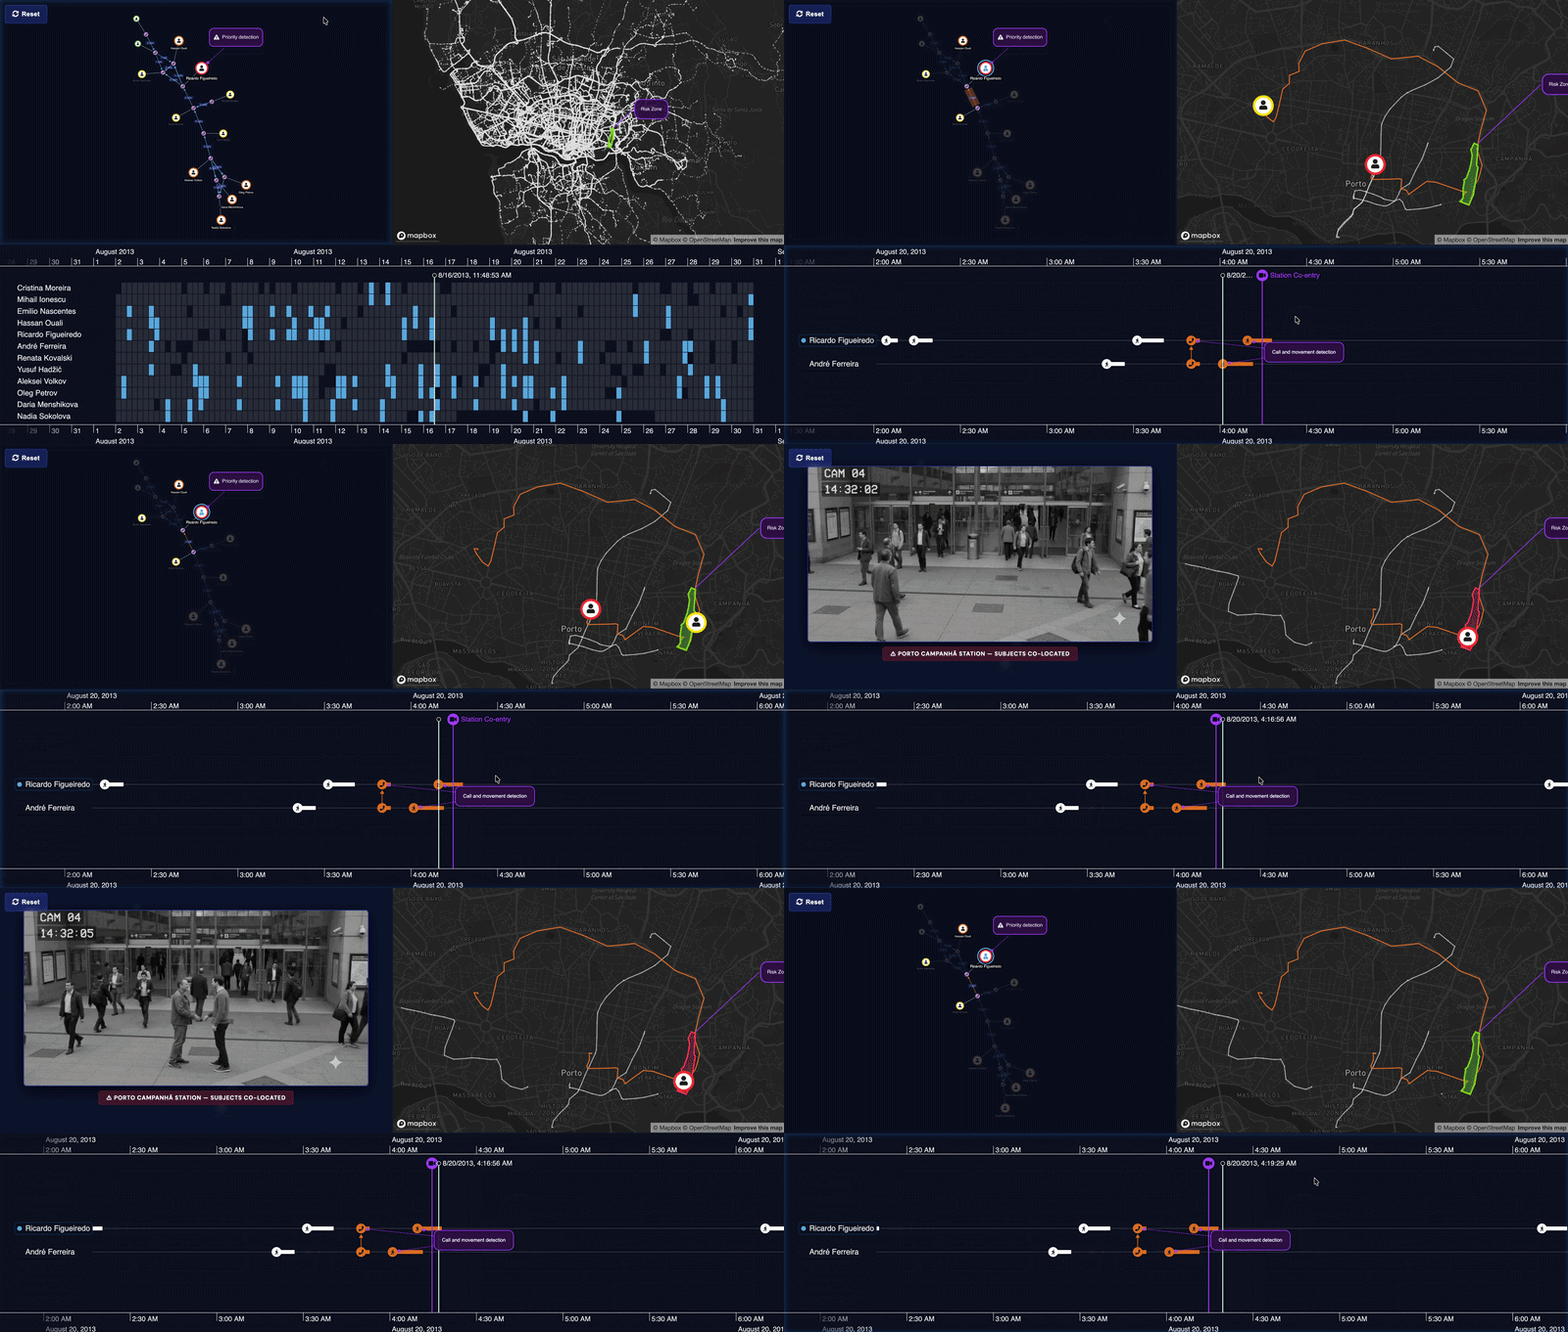
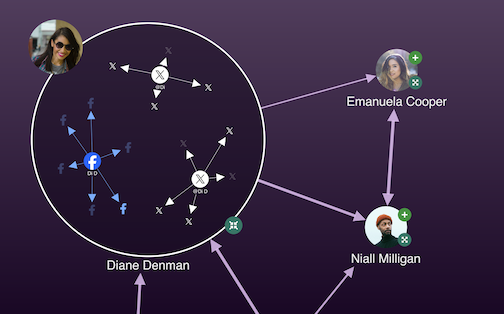
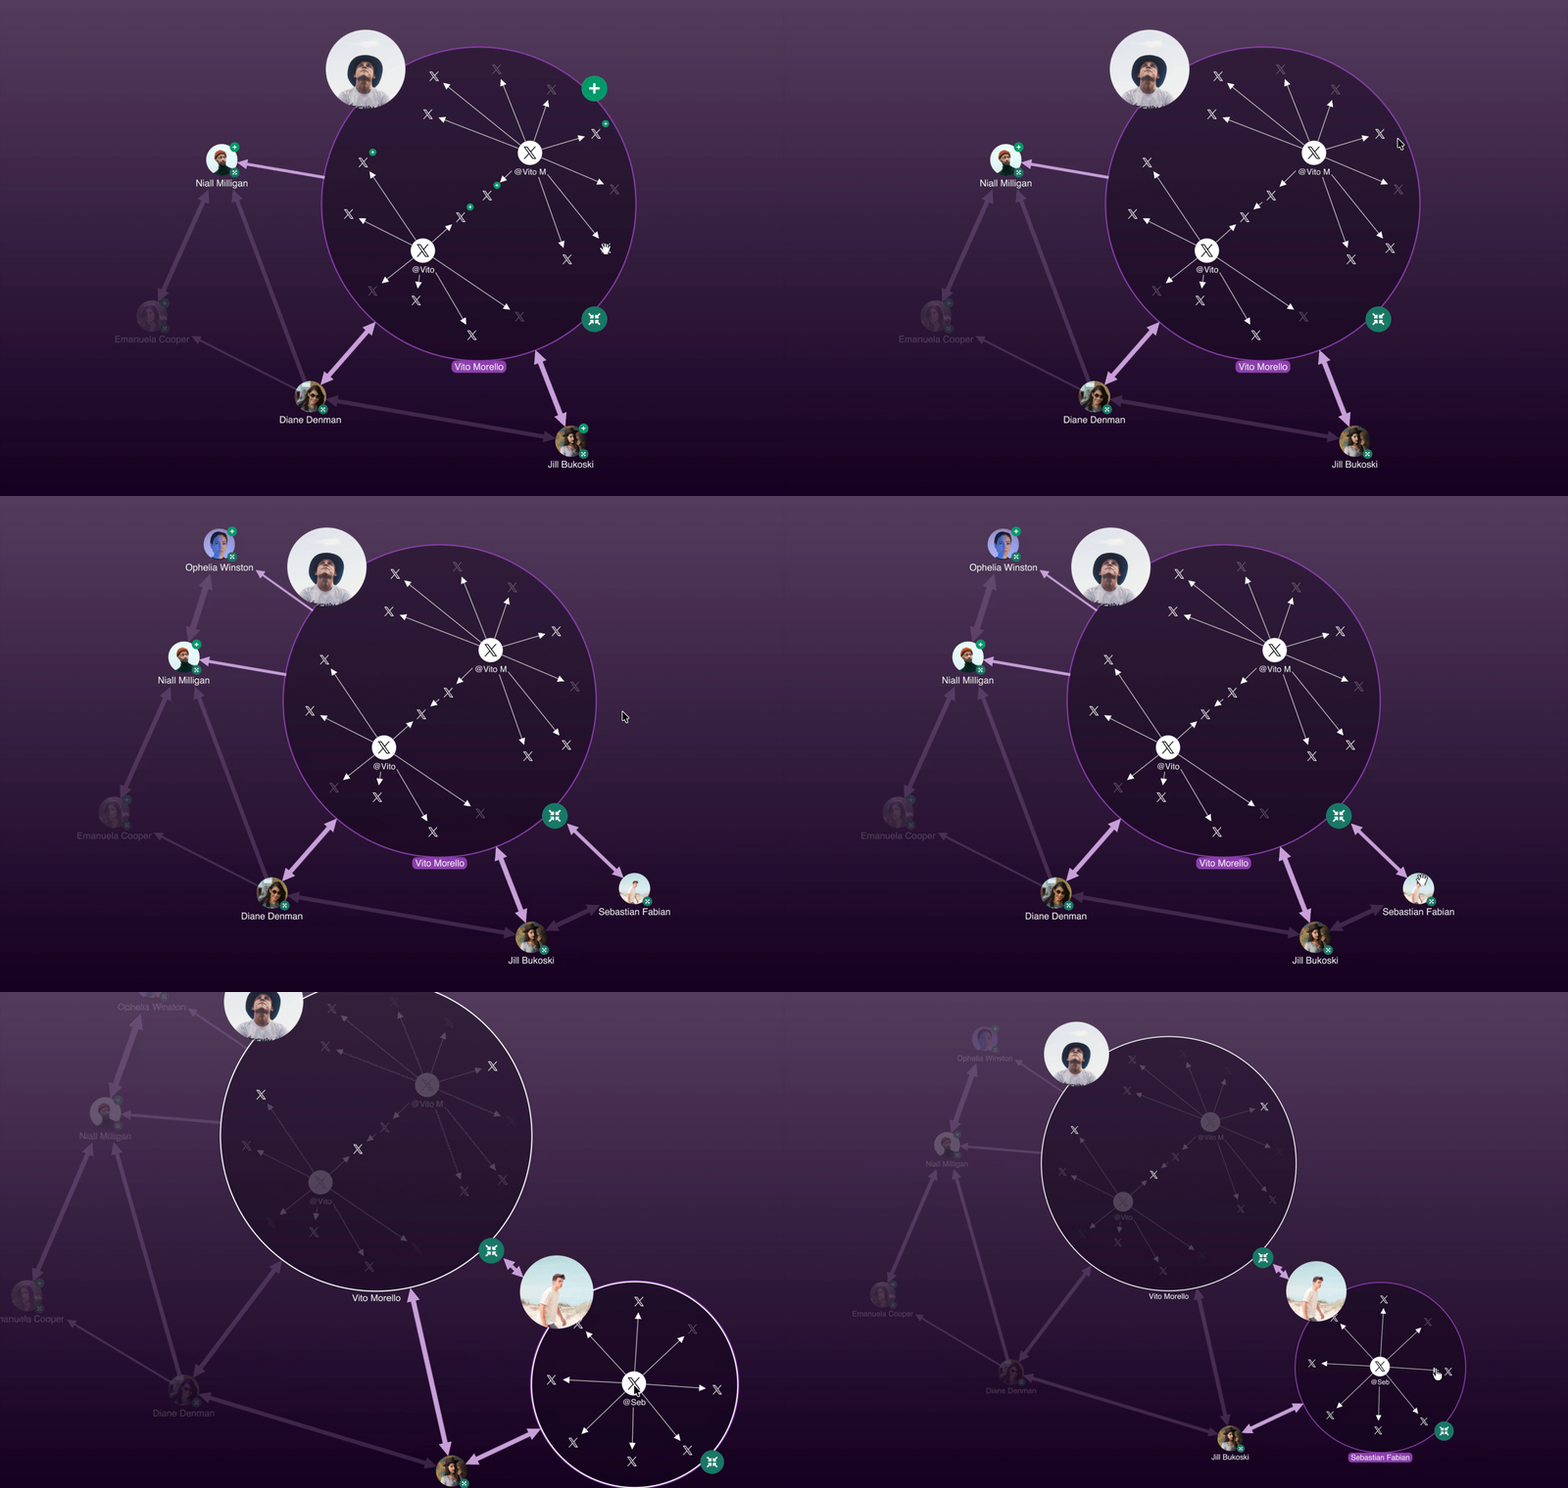

The showcase focuses on creating and editing annotations directly in the chart. A user can investigate the network, identify something significant and add explanatory text directly beside the relevant data or to the chart in general. The insight stays attached to the visual context, rather than being moved into a separate note detached from the chart interface.
Annotations and their text size scale according to the user’s zoom level. This ensures they remain readable during chart exploration. The annotation design can be customized to fit the surrounding application from simple labels to richer interface controls.
This makes the feature useful beyond personal note-taking. In an investigation, an annotation can explain why a node matters. In a review workflow, it can preserve the reasoning behind a decision. When a chart needs to be shared, preserving the annotations gives other people the context they would otherwise need to reconstruct for themselves.
Annotated charts can be exported in multiple formats, making it easier to include the chart in documents, reports or presentations.
What you can evaluate
For product and engineering teams, this showcase demonstrates how the SDKs can support annotation workflows inside graph visualizations. It highlights positioning, custom styling, editable labels and exportable annotated views.
The workflow supports a core analysis task: capture the insight where it appears and be able to share that chart and annotated explanation together for easy review.