Jan is Product Manager for MapWeave. He works on geospatial visualization capabilities that help teams analyze connections and events in their geographic context.
Artillery supply chain
copy url
Graph Geospatial Supply Chain
Use this showcase if you’re building an application where users need end-to-end visibility across a complex supply chain. It shows how geospatial network analysis can connect strategic dependency mapping with the operational reality of routes and movement on the map.
What the showcase demonstrates
The showcase presents a subset of Russian artillery supply chain data, based on the published "Ore to Ordnance" analysis of artillery manufacturing and disruption opportunities. It combines a network view with a map, providing geospatial context. Users can move between the structure of the supply chain and the physical geography behind it.
Rather than treating logistics as a flat list of sites and shipments, the workflow lets users step through the chain and see how materials progress toward artillery production. At each stage, the network shows dependency relationships. The map then grounds those relationships in physical space, using synthesized routes and transport modes to illustrate how goods could move between sites.
This is where the strategic and tactical views reinforce each other. The graph shows how the supply chain is structured while the map shows where those relationships play out, turning abstract dependencies into routes, locations and operational context.
NATO-standard military symbology gives the entities a domain-specific visual language, making the showcase feel closer to a real defense or intelligence workflow than a generic supply chain diagram.
What you can evaluate
For product and engineering teams, this showcase demonstrates how the SDKs can support geospatial network analysis for strategic supply chains. It shows how dependency analysis, map-based context and domain-specific styling can work together in a single application.
The workflow supports a core supply chain analysis task: trace the chain from source to delivery, then understand the sites and routes that make each stage operationally significant.
Presented by

Jan Girman
Product Manager
Jan is Product Manager for MapWeave. He works on geospatial visualization capabilities that help teams analyze connections and events in their geographic context.
More from Cambridge Intelligence
See all →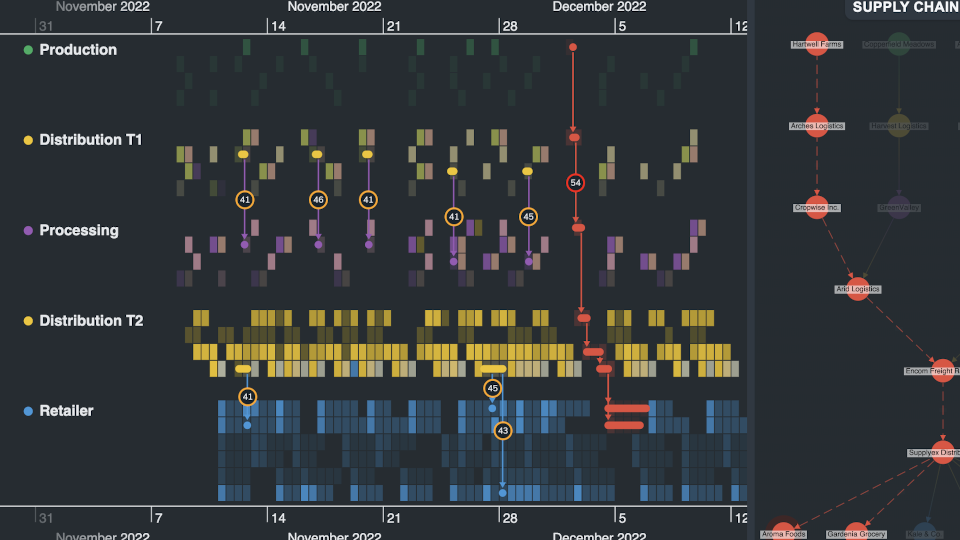
Supply Chain
Supply chain investigation
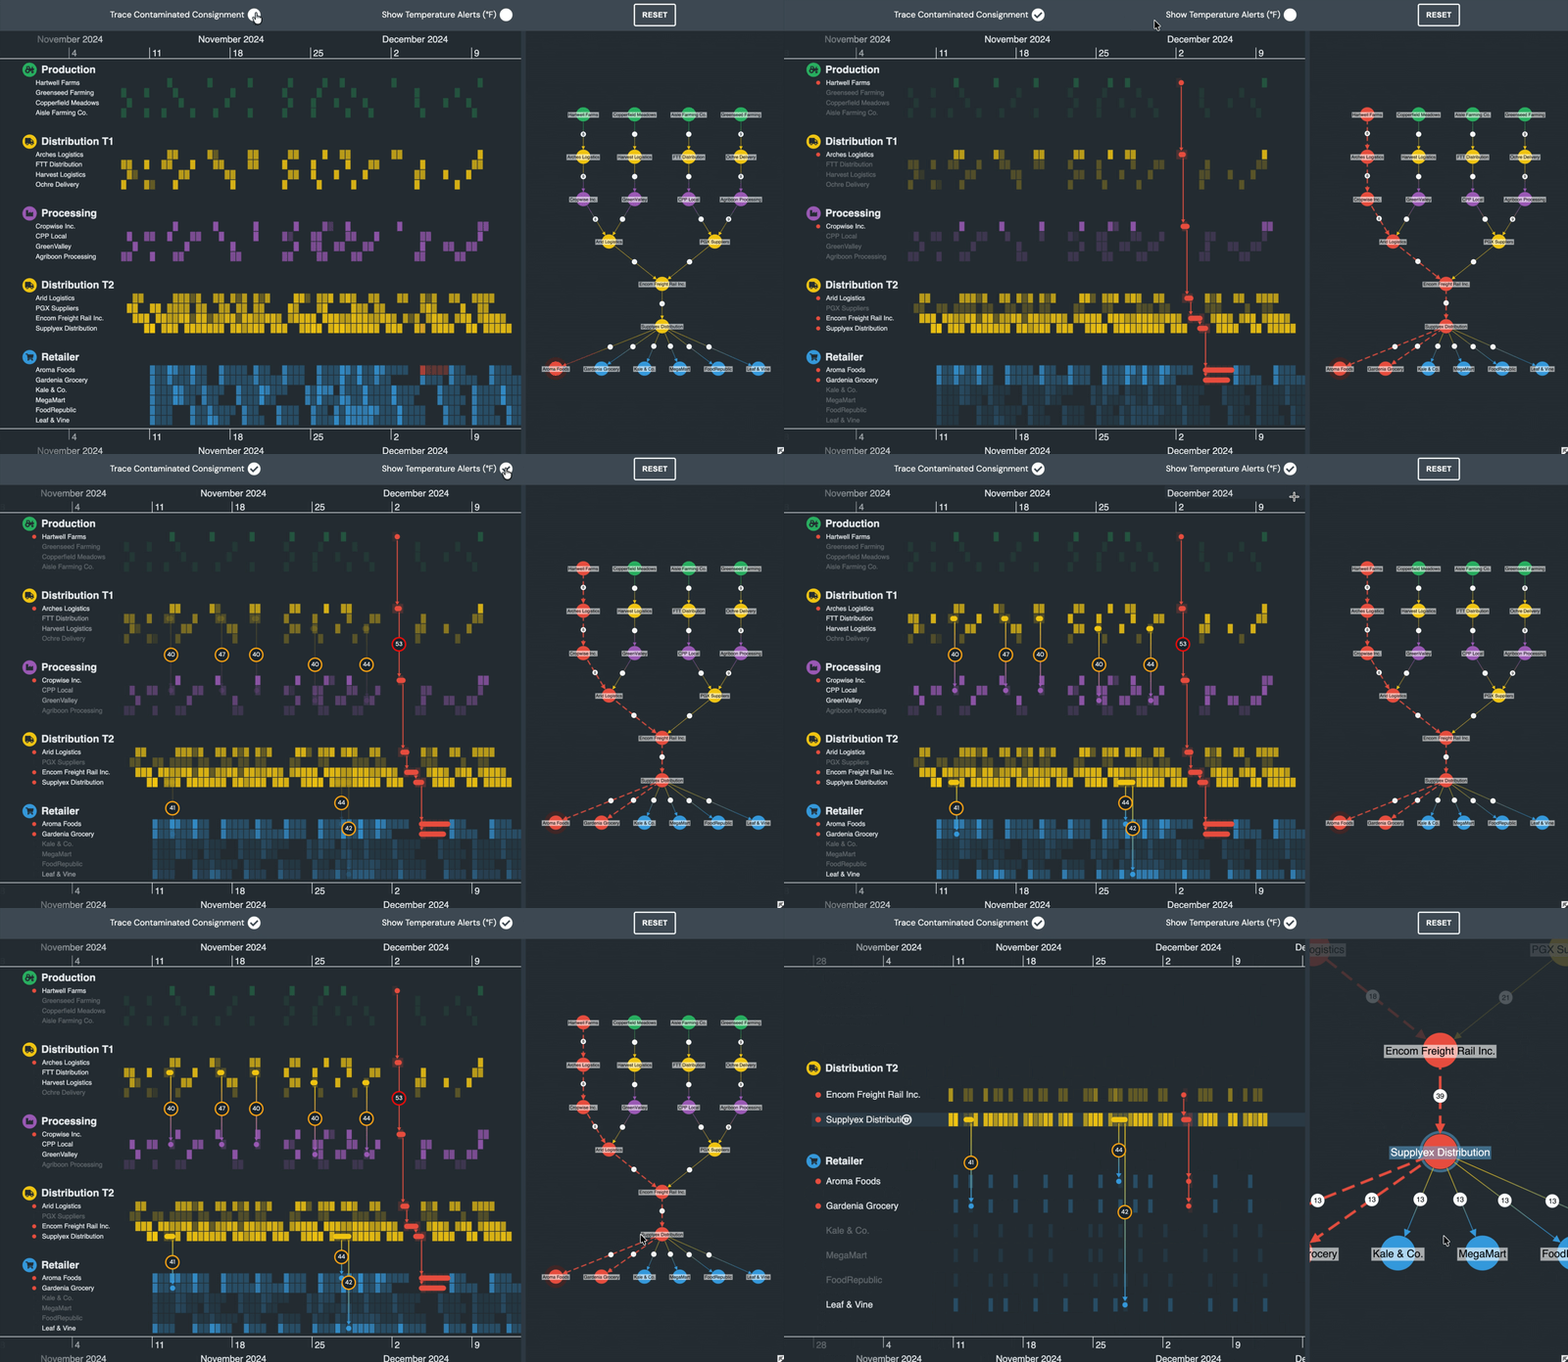
Use this showcase if you’re building an application where users need to investigate product issues across a logistics network. It shows how timeline and network views can help teams follow a contaminated consignment from retailer back to source, and then identify where action may be needed.
View showcase
Intelligence and Security
Data fusion investigations
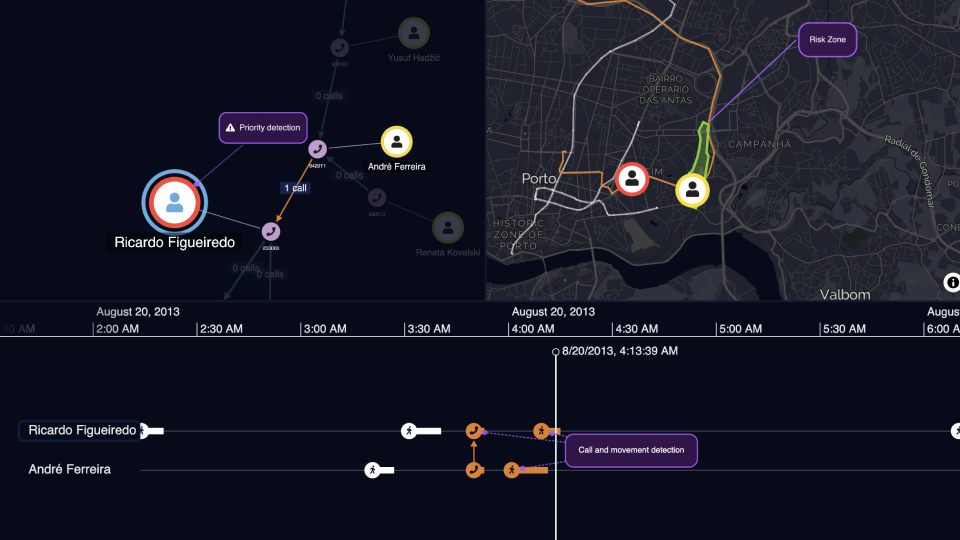
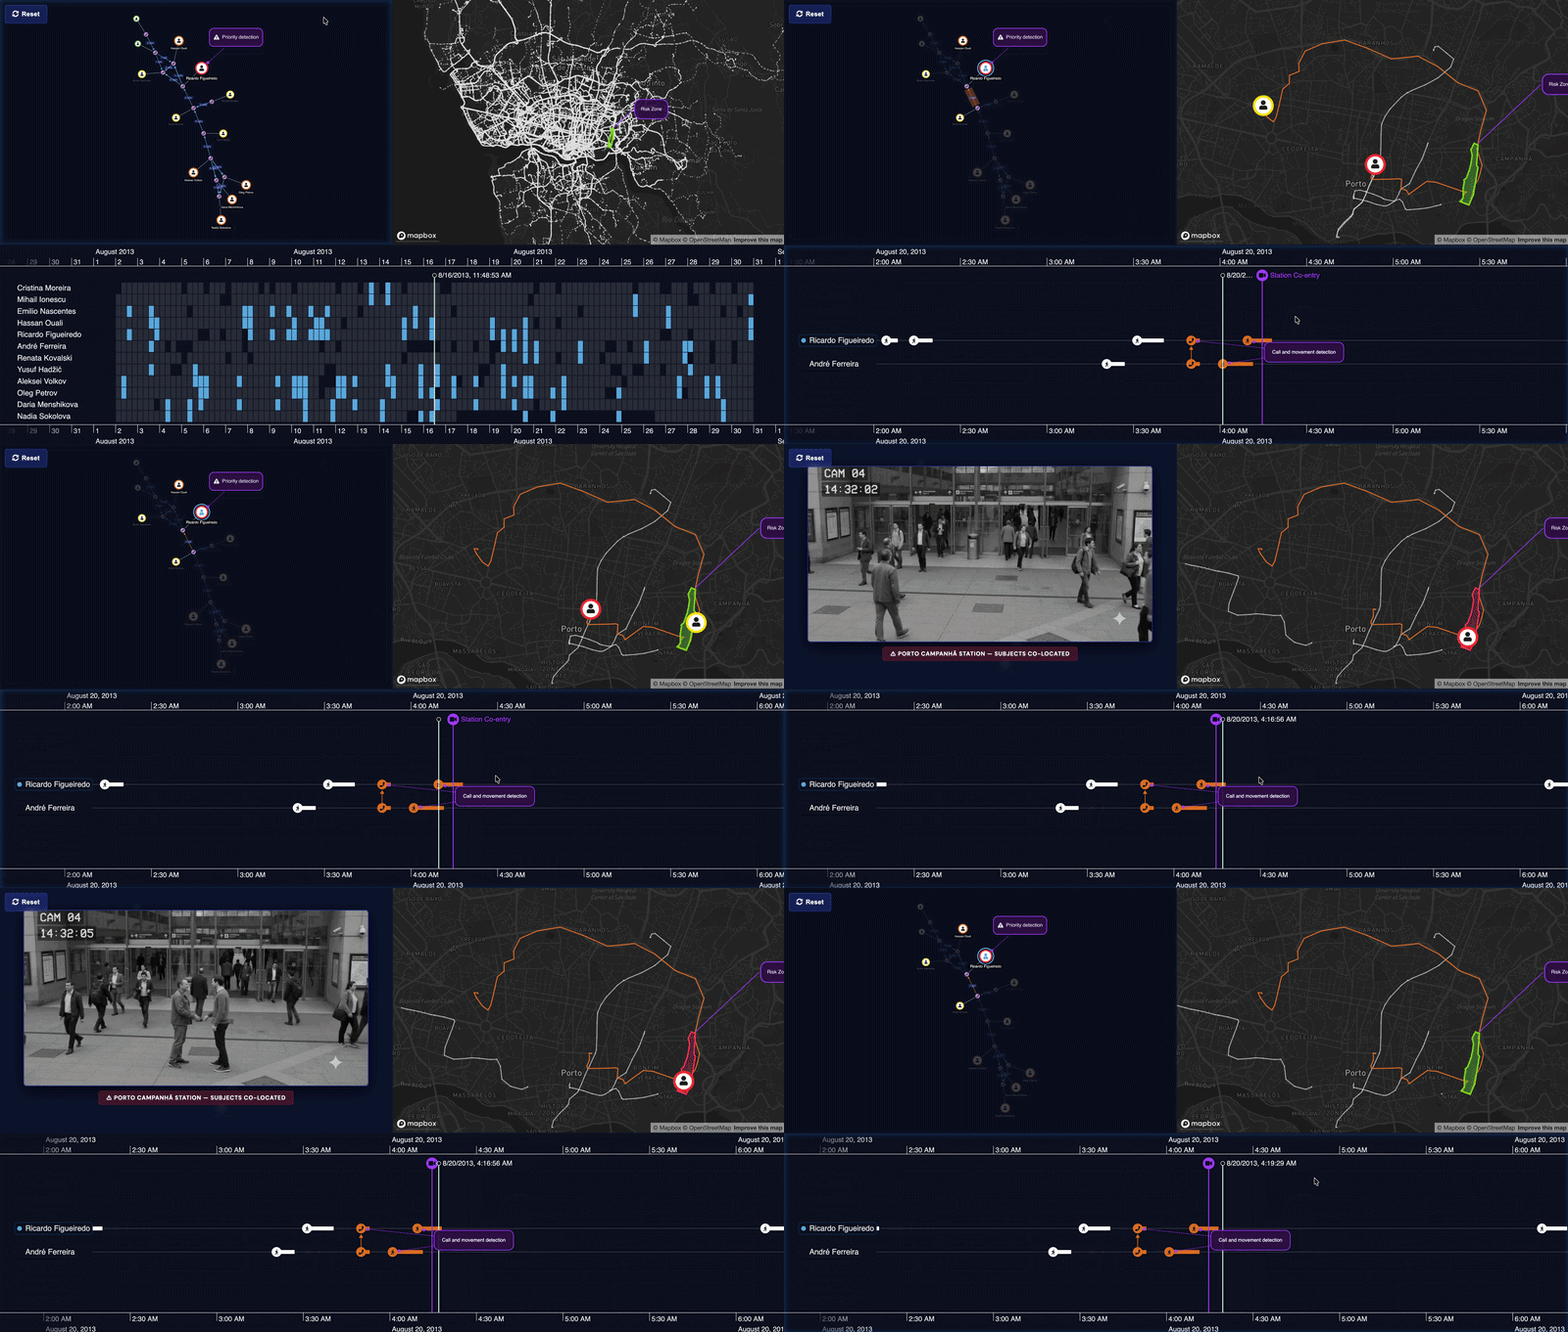
Use this showcase if you’re building an investigation application that needs to connect different data types that complement each other. It shows how a synchronized graph, timeline and map can turn lawful-intercept-style data into a single tool that offers investigators a clearer account of a person’s activity.
View showcase
Intelligence and Security
Social media analysis
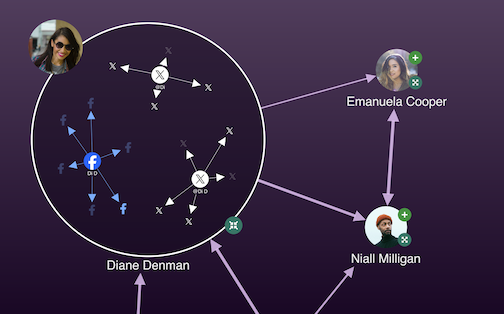
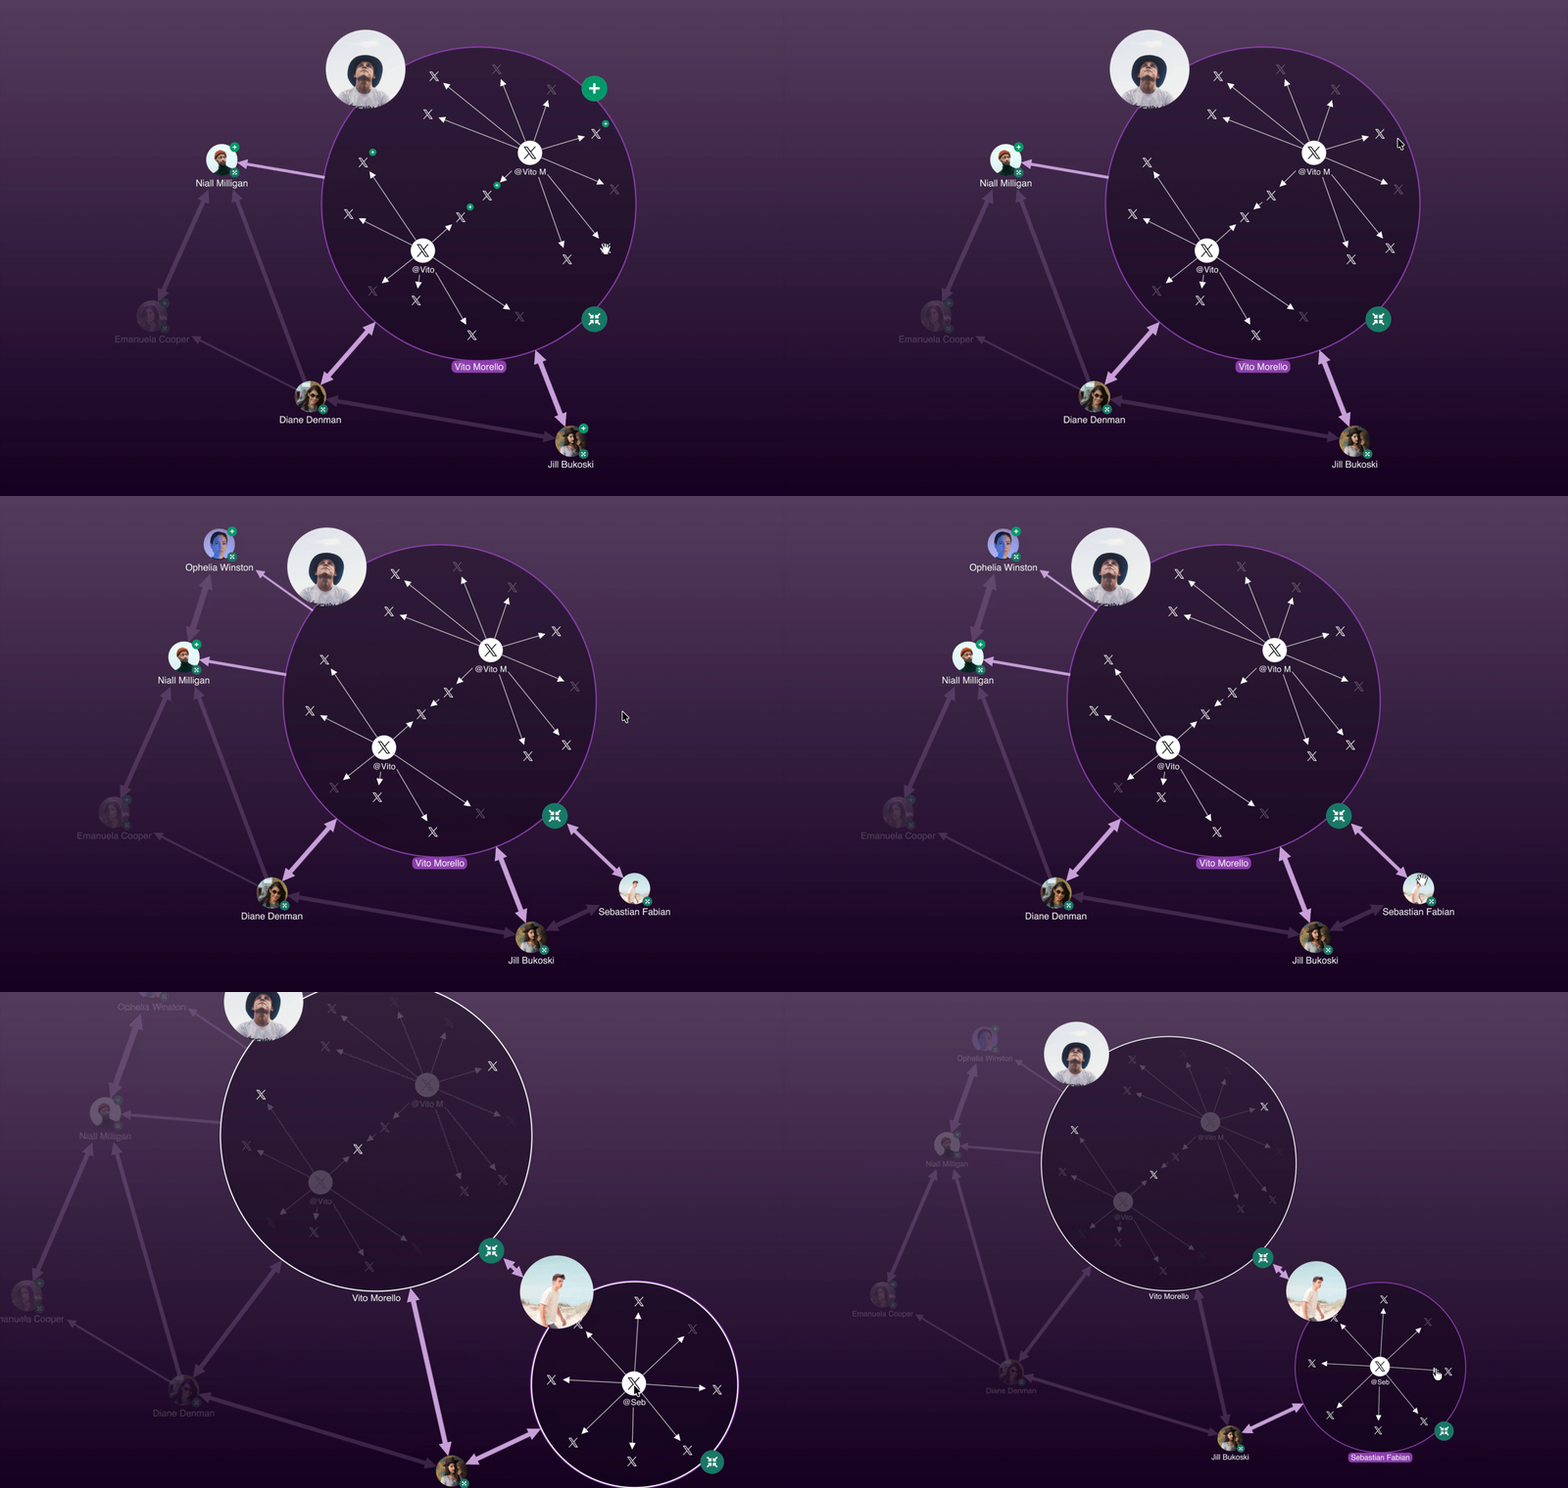
Use this showcase if you’re building an application where analysts need to connect online identities, accounts and posts across social media platforms. It demonstrates how entity resolution can turn scattered identifiers into a clearer network, so relationships are easier to interpret at the level of people and groups rather than individual accounts alone.
View showcase