Pete leads the team of product managers and product designers at Cambridge Intelligence, with a particular focus on product strategy, team learning, and understanding the needs of our customers.
Cloud monitoring
copy url
Graph Timeline Cyber Security
Use this showcase if you’re building an application where users need to investigate cloud incidents across connected services. It shows how service topology, alert status and time-based context can work together and help explain where the issue started and what is affected.
What the showcase demonstrates
The showcase visualizes a set of cloud services and their associated health alerts. The service dependency chart lets users visually inspect the system with the option to switch between a sequential view and a more organic layout, depending on how they want to survey the topology.
A user can focus the chart by service type, such as databases, queues, gateways or caches. Selecting a node reveals details including health status, team ownership and version, while the timeline narrows to the relevant alert history. This makes it easier to move from a broad operational picture to the service that needs attention.
The alerts list provides a second route into the investigation. Filtering by critical, degraded or healthy status updates the dependency chart and timeline together, so the visual network always reflects the current alert context. Selecting an individual alert brings the affected service into focus and shows supporting detail alongside it.
The timeline is especially useful for understanding sequence. In this example, it helps users identify which service reached a critical state first, then follow how the issue propagated to other affected parts of the system.
What you can evaluate
For product and engineering teams, this showcase demonstrates how the SDKs can support cloud observability and incident triage workflows. It shows synchronized service dependency, alert-list and timeline views, along with filtering, layout switching and alert-driven navigation.
The workflow helps users move from a high-priority alert to its wider operational impact: which service was affected, when it became critical and how the issue propagated through dependent services.
Presented by

Pete Wood
Product Team Lead
Pete leads the team of product managers and product designers at Cambridge Intelligence, with a particular focus on product strategy, team learning, and understanding the needs of our customers.
More from Cambridge Intelligence
See all →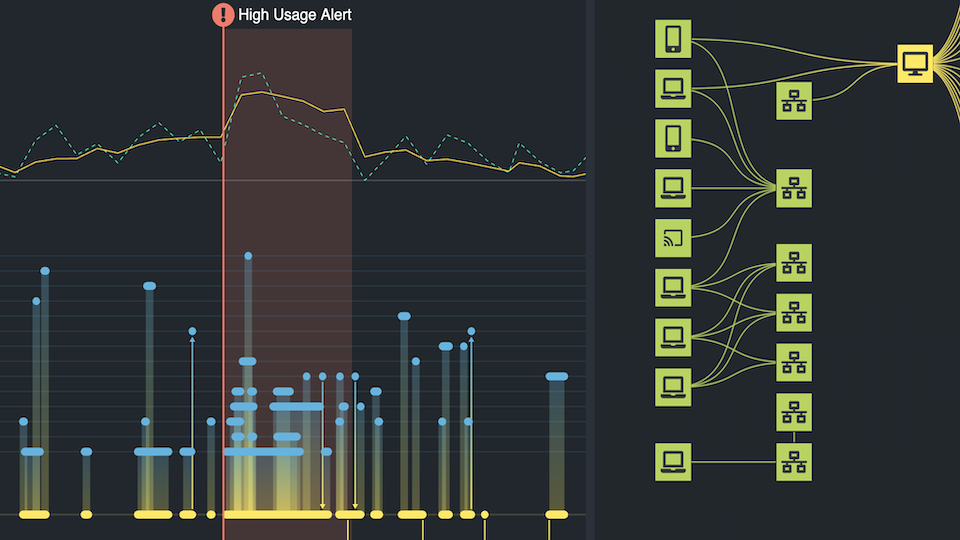
Cyber Security
Network traffic analysis
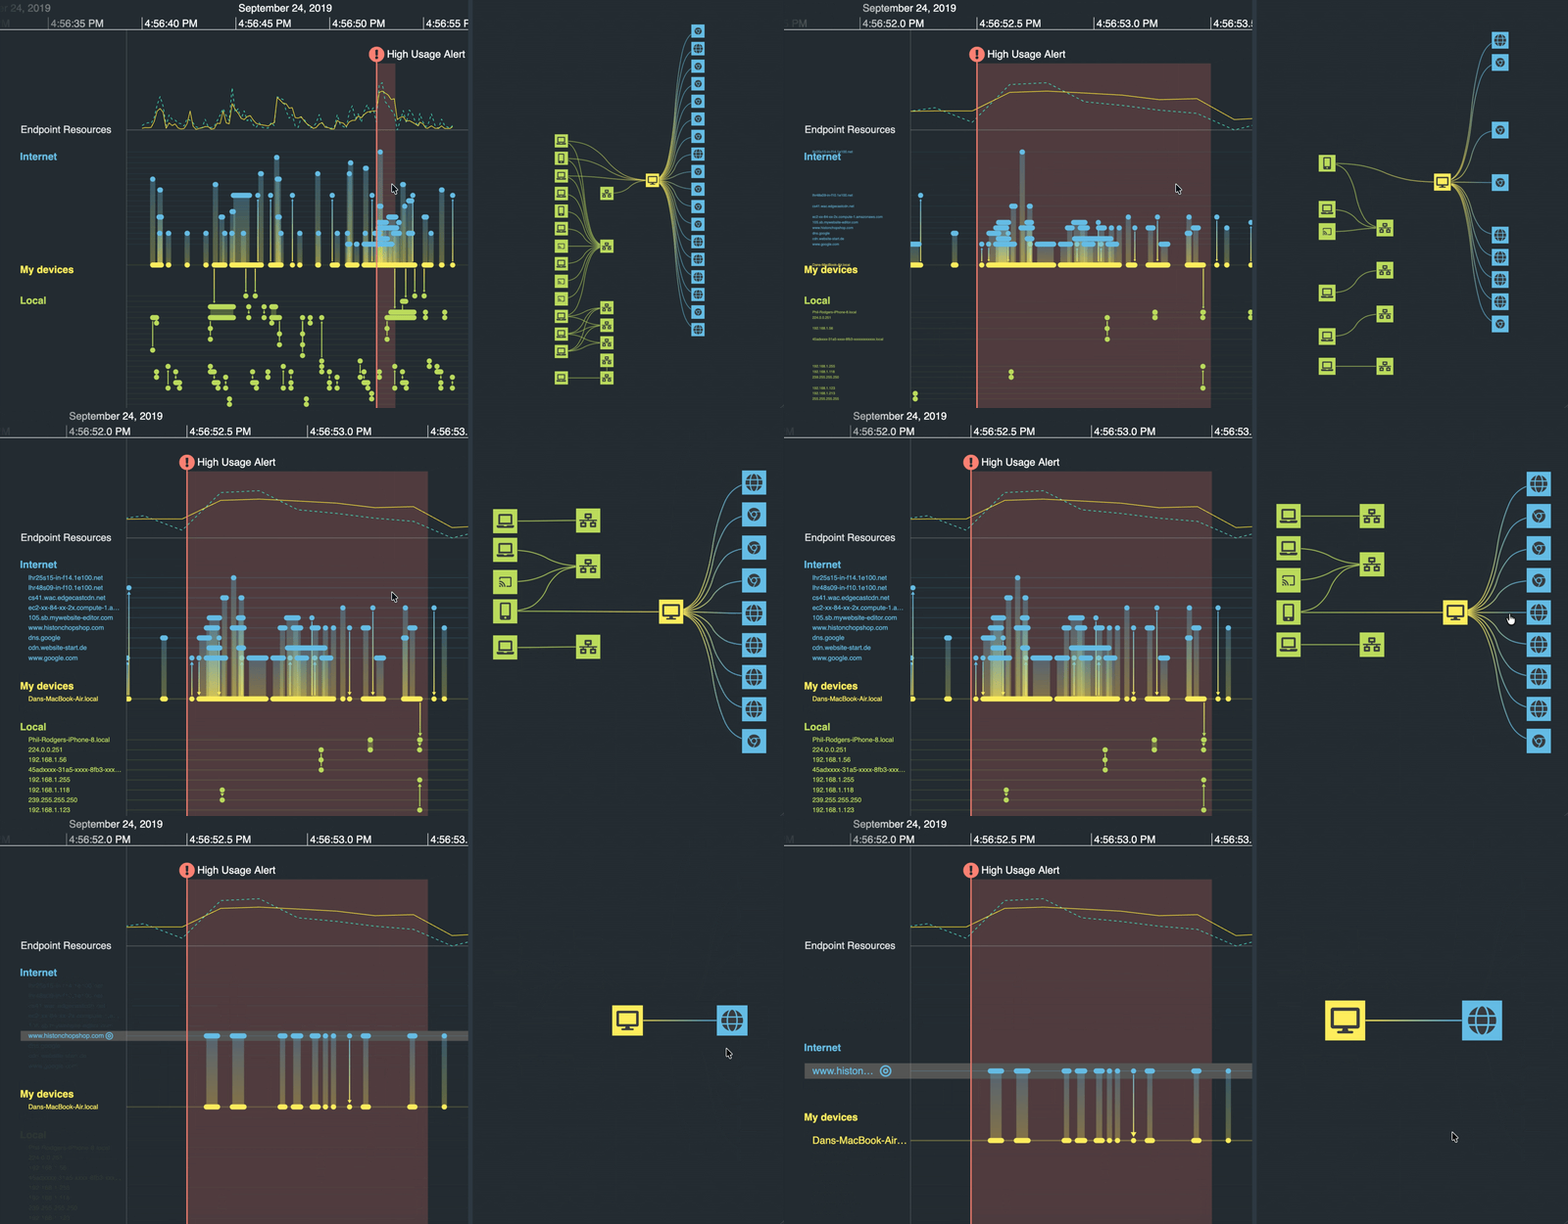
Use this showcase if you’re building an application where analysts need to investigate network activity from timestamped log data. It shows how traffic records can become a visual sequence, making unusual behavior easier to spot than it would be in raw log files.
View showcase
Cyber Security
Cloud security
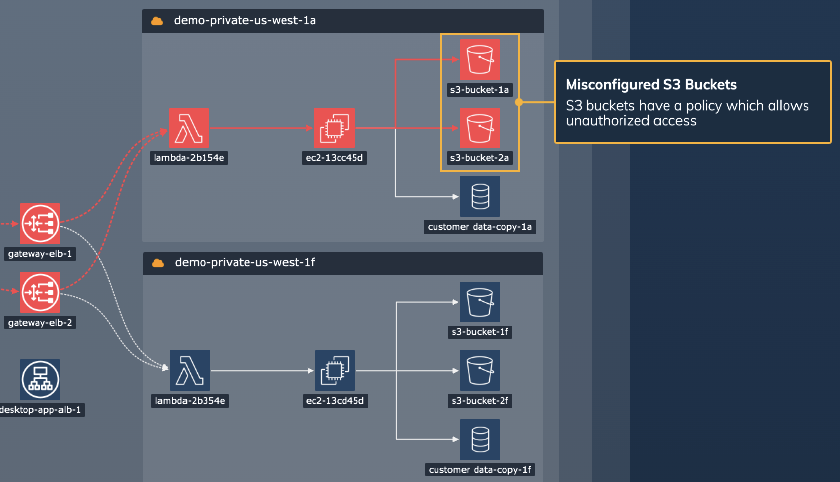
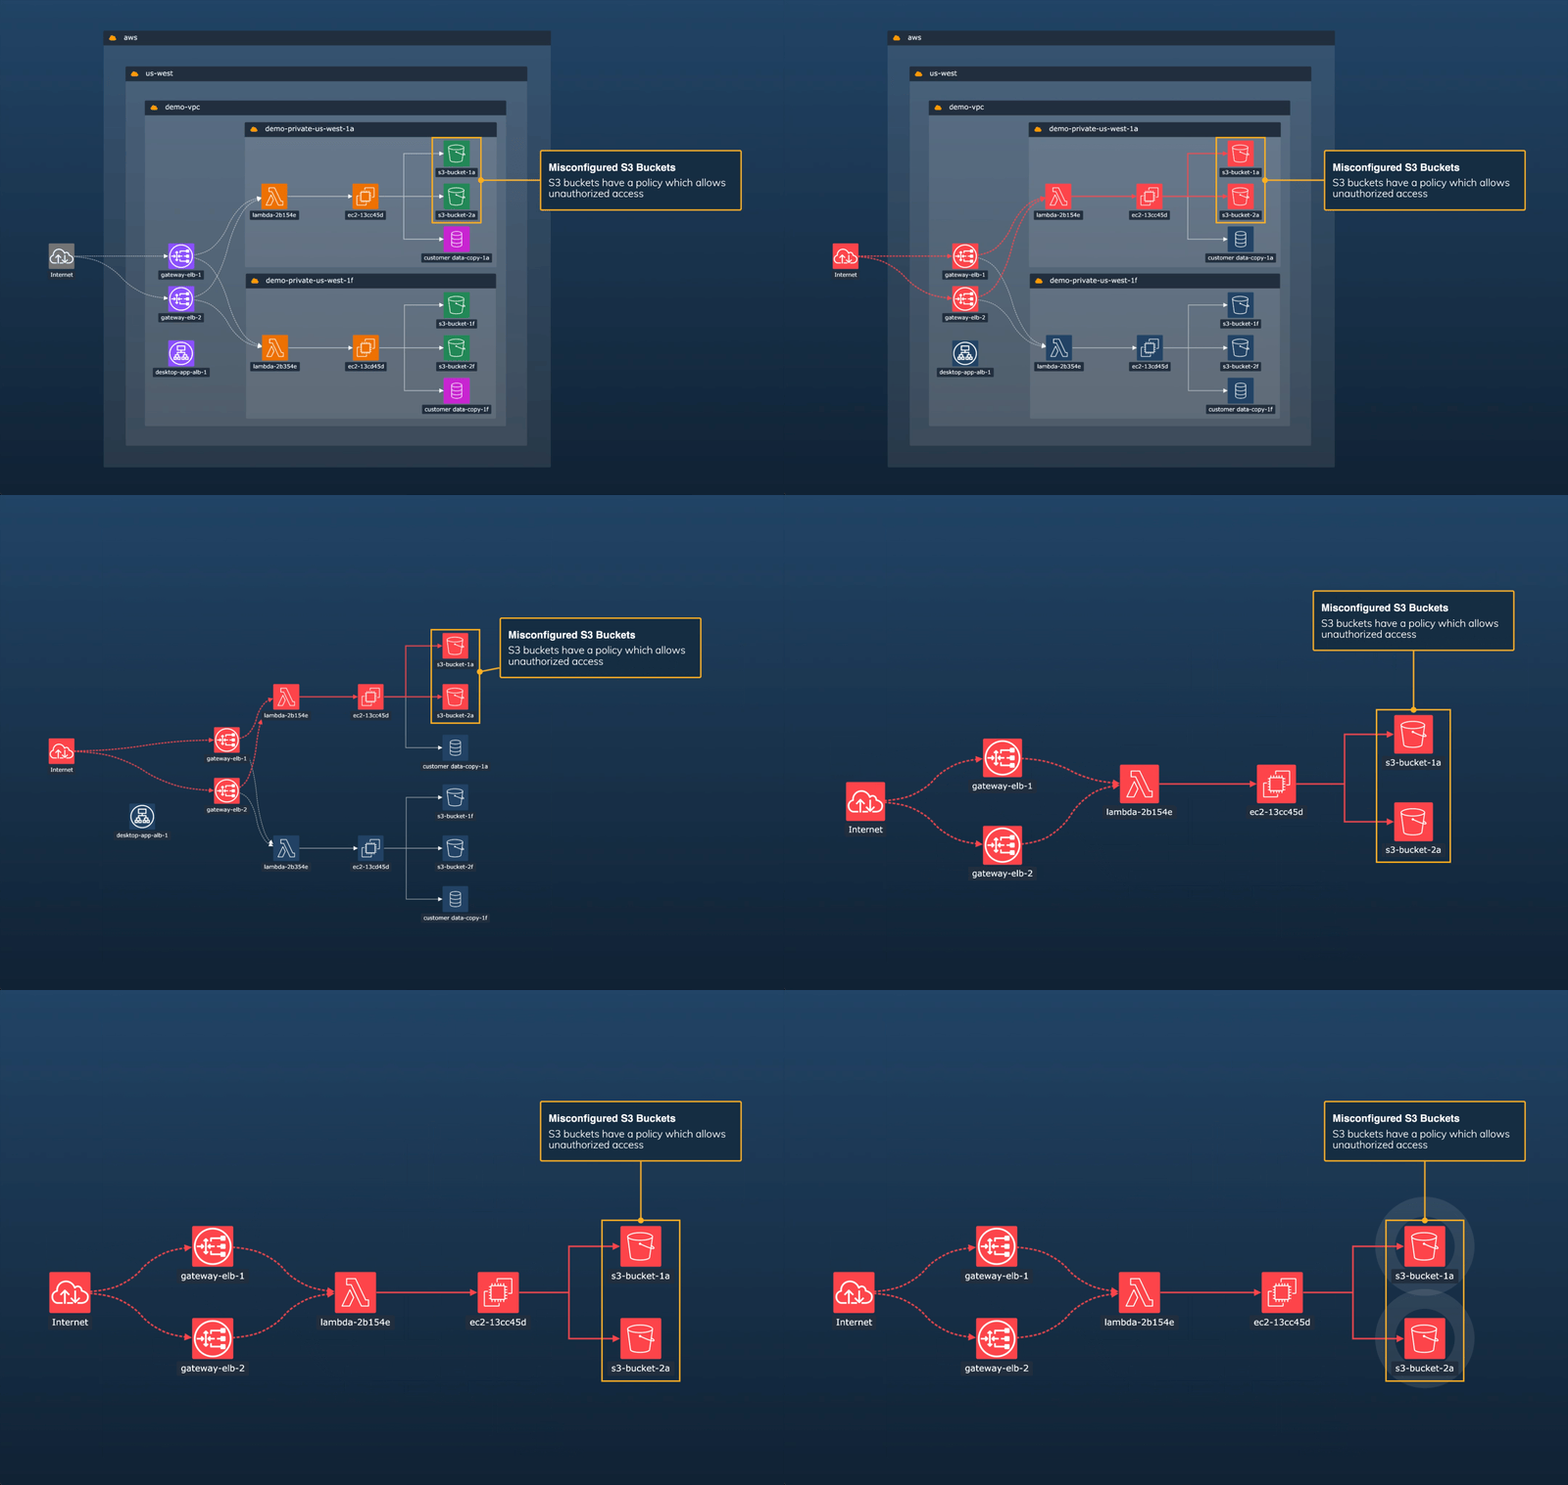
Use this showcase if you’re building an application where users need to understand cloud infrastructure, assess exposure and communicate or investigate attack paths clearly. It shows how a cloud environment can be arranged into a visual model that is easier to scan, with services, gateways, functions and storage components grouped by their role in the architecture.
View showcase
Cyber Security
Cyber impact analysis
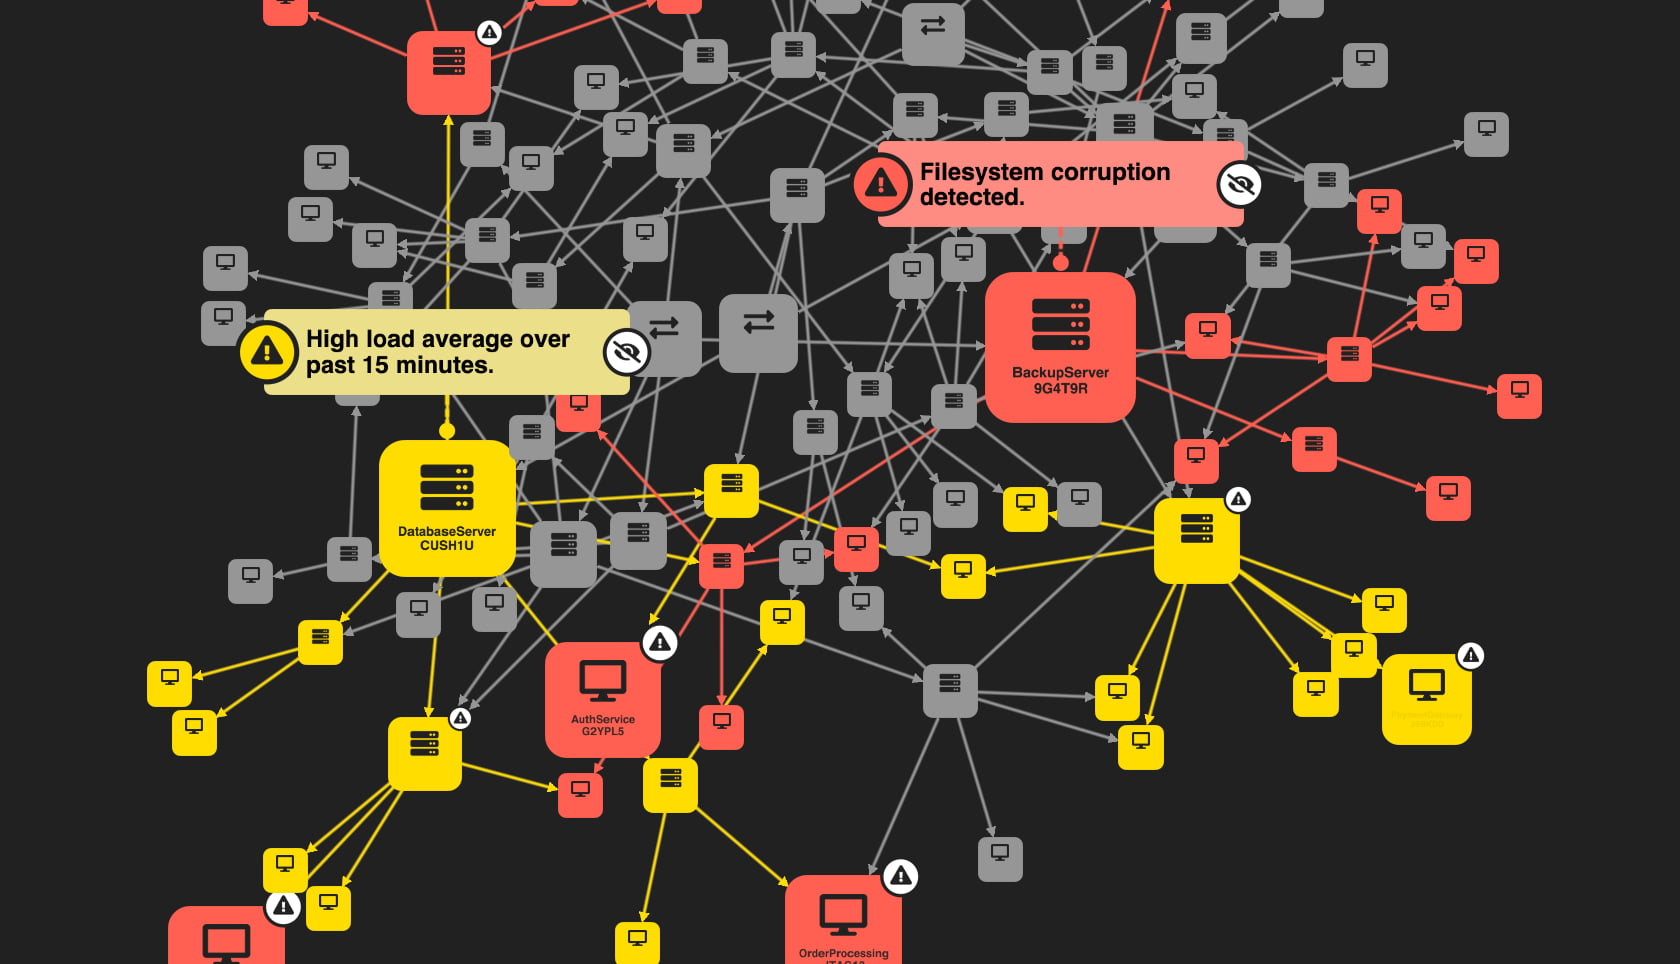
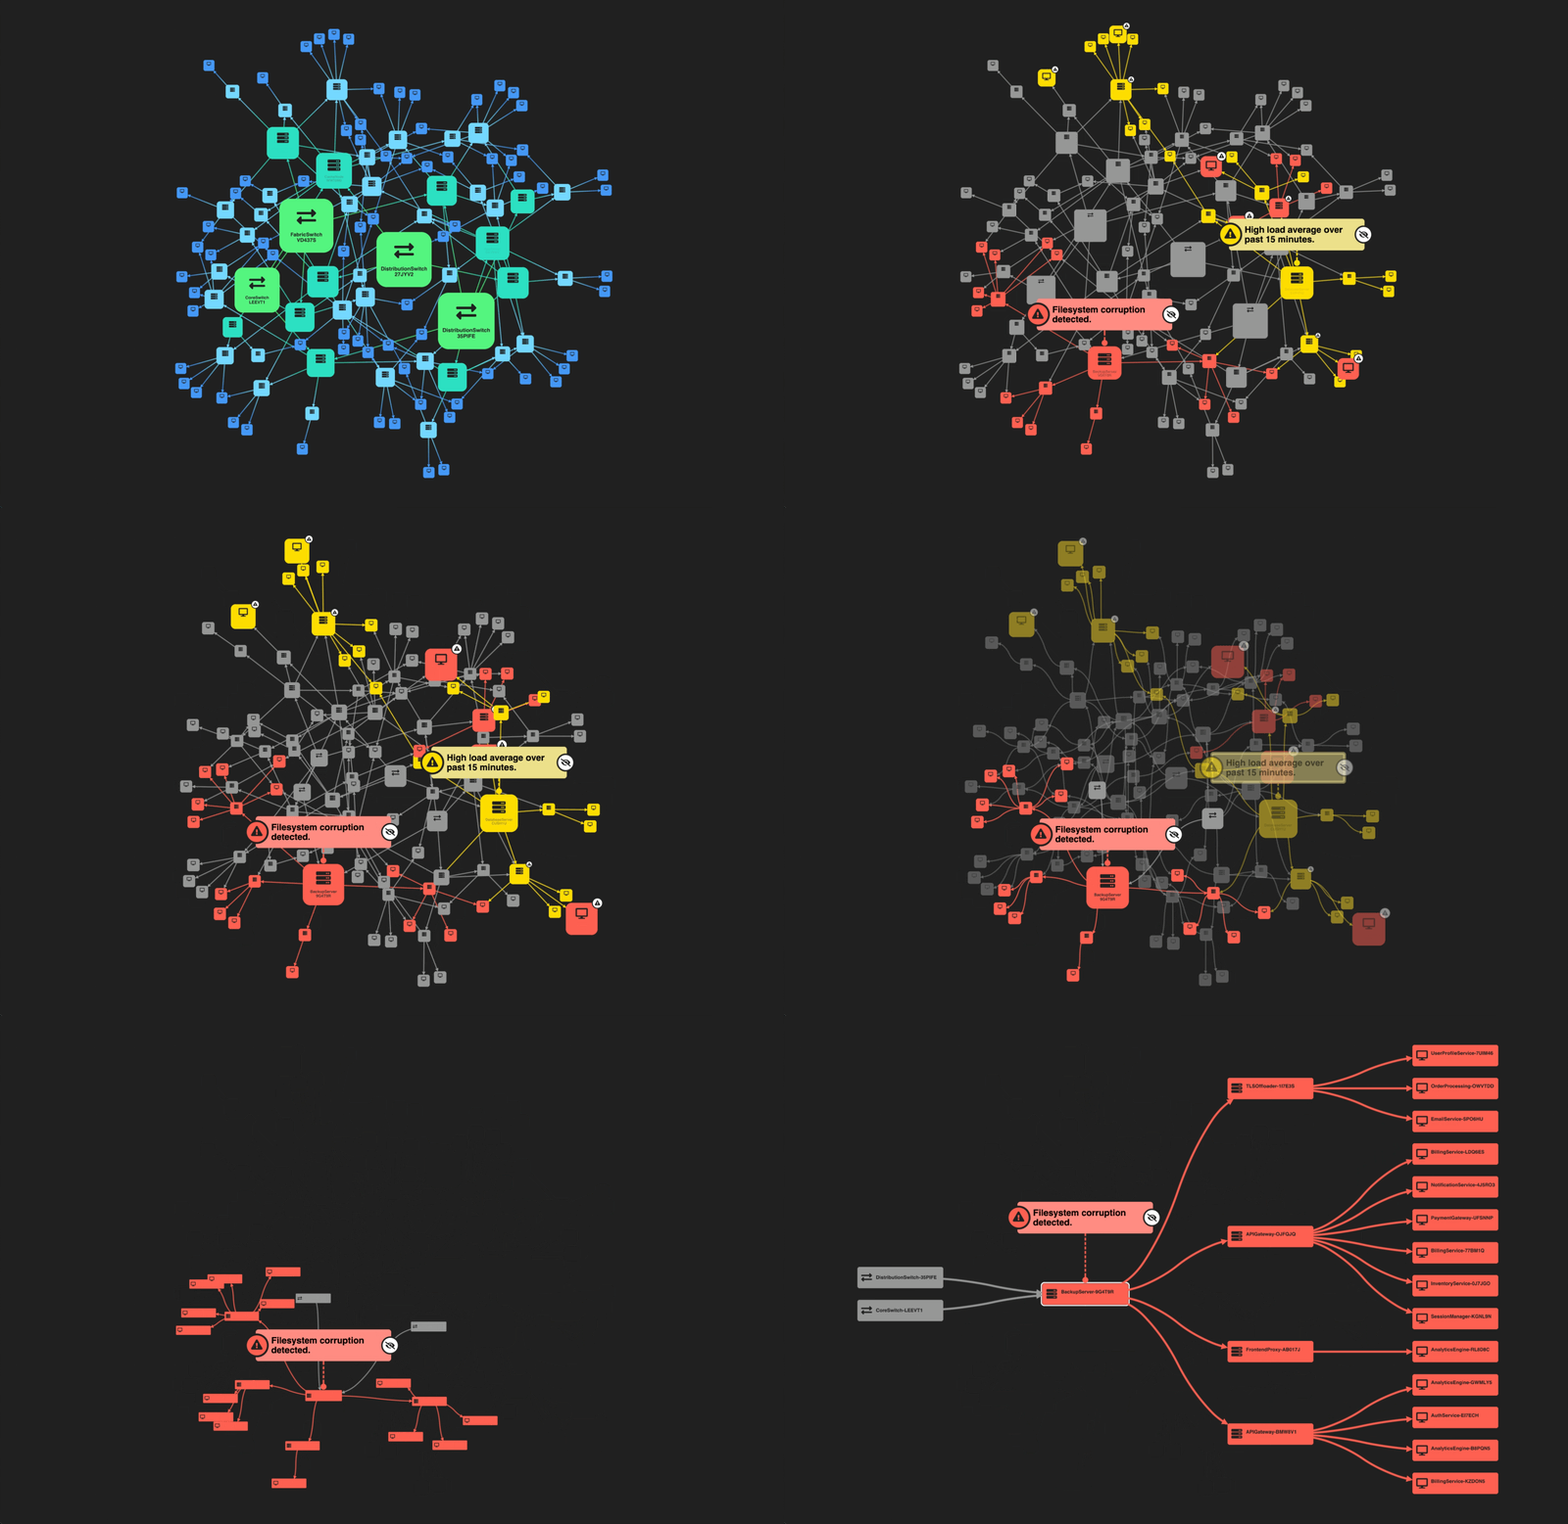
Use this showcase if you’re building an application where users need to understand how issues could cascade through a cyber network. It shows how the context of dependencies can turn alerts into a clearer picture of operational impact: which systems matter most, what relies on them and where disruption could spread.
View showcase