What the showcase demonstrates
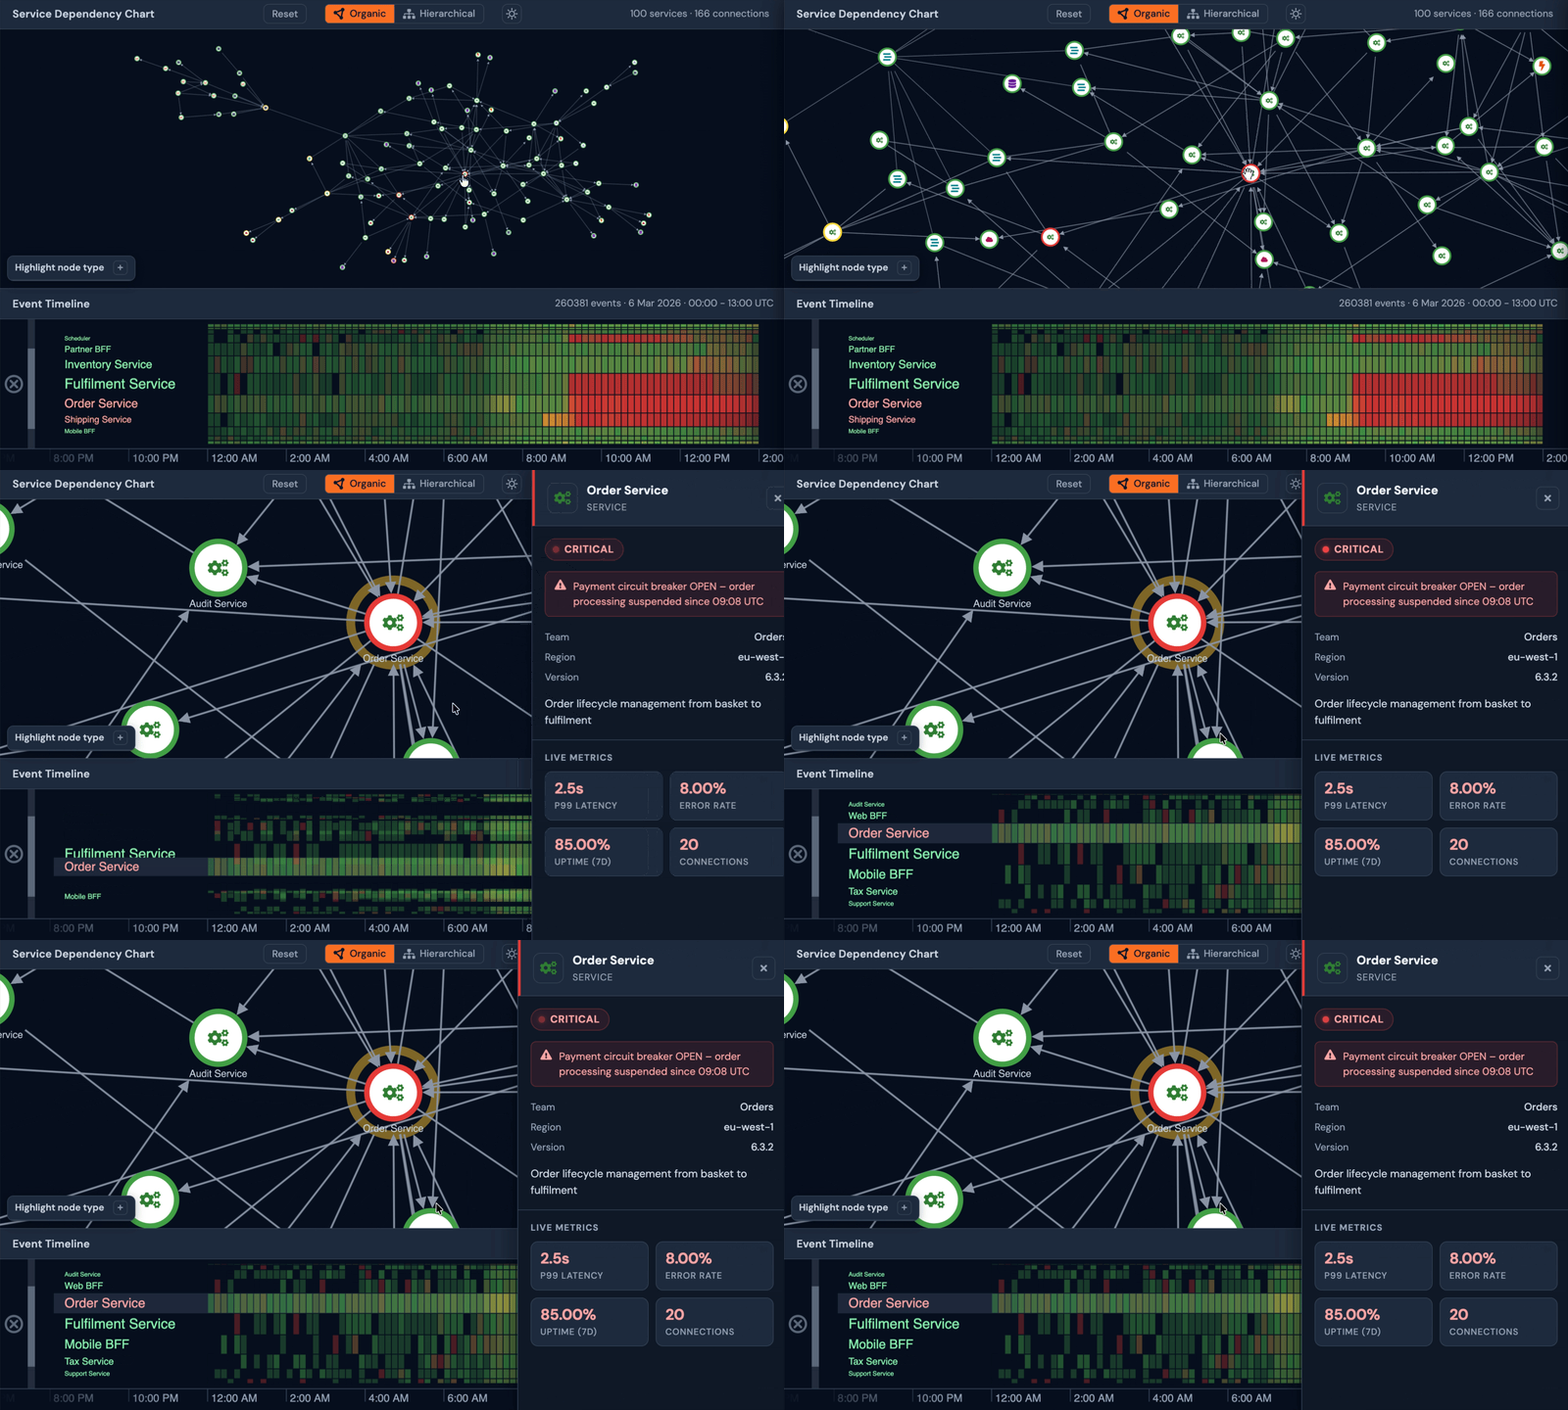

The showcase visualizes a cyber network where node size reflects dependency impact. In the Impact Analysis view, larger nodes represent systems with more downstream dependencies, giving users an immediate way to identify the parts of the network that could cause the most disruption if they failed.
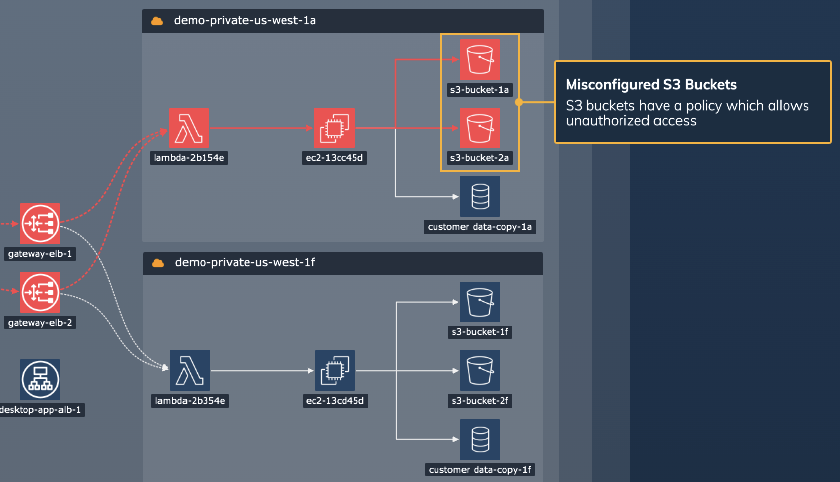
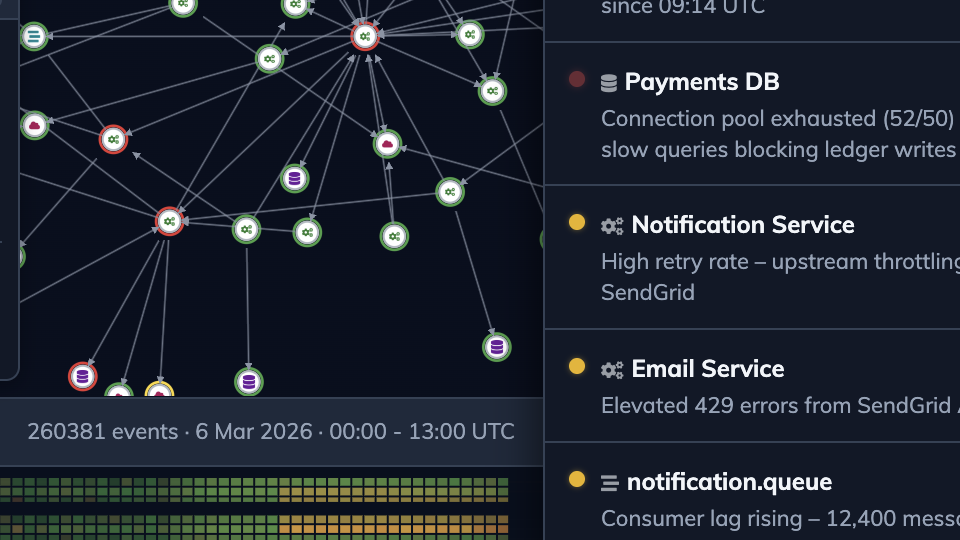
The Alerts List view brings warnings and errors to the foreground, accompanied by annotations. Instead of treating every alert as equal, the interface sizes affected nodes by dependency impact, helping users distinguish isolated problems from issues that could have a wider blast radius. The graph and list stay synchronized, so users can move between a visual network and an alert-led workflow without losing context.
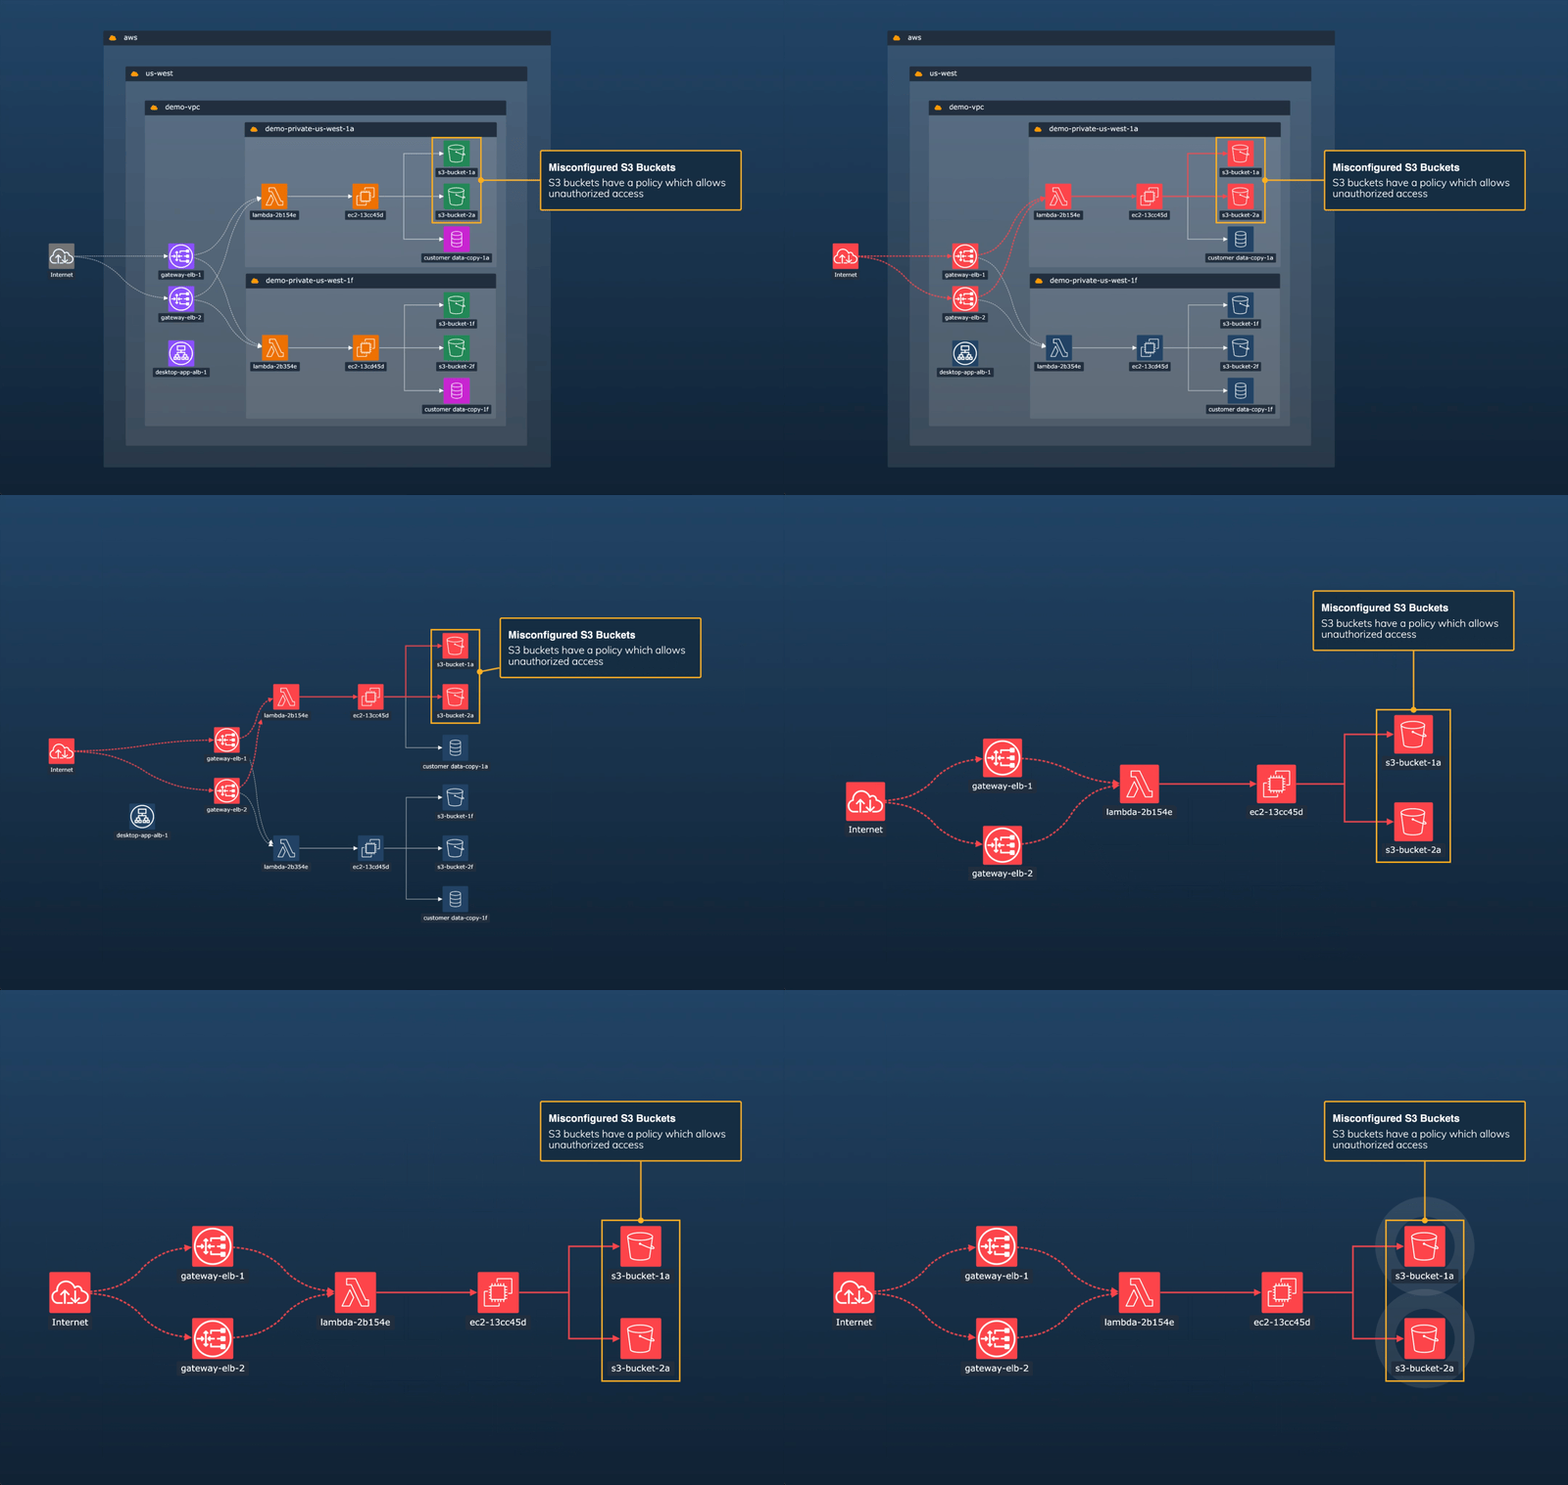
Hovering over a node reveals its dependencies. Selecting it provides a more focussed, hierarchical view of affected systems, making the downstream impact easier to trace when the original view is too dense to interpret quickly.
What you can evaluate
For product and engineering teams, this showcase demonstrates how the SDKs can support impact analysis and alert triage in connected cyber data. It shows dependency-based sizing, annotations, synchronized graph and list views, sequential layouts and interaction patterns for inspecting affected systems.
The workflow turns alerts into impact analysis: showing a warning or error, its dependencies and how far the disruption could reach.