What the showcase demonstrates
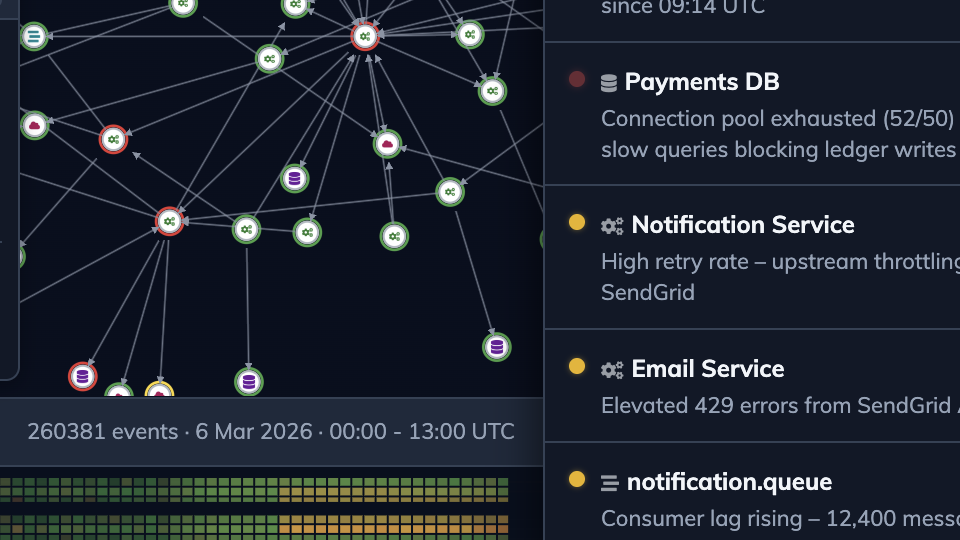
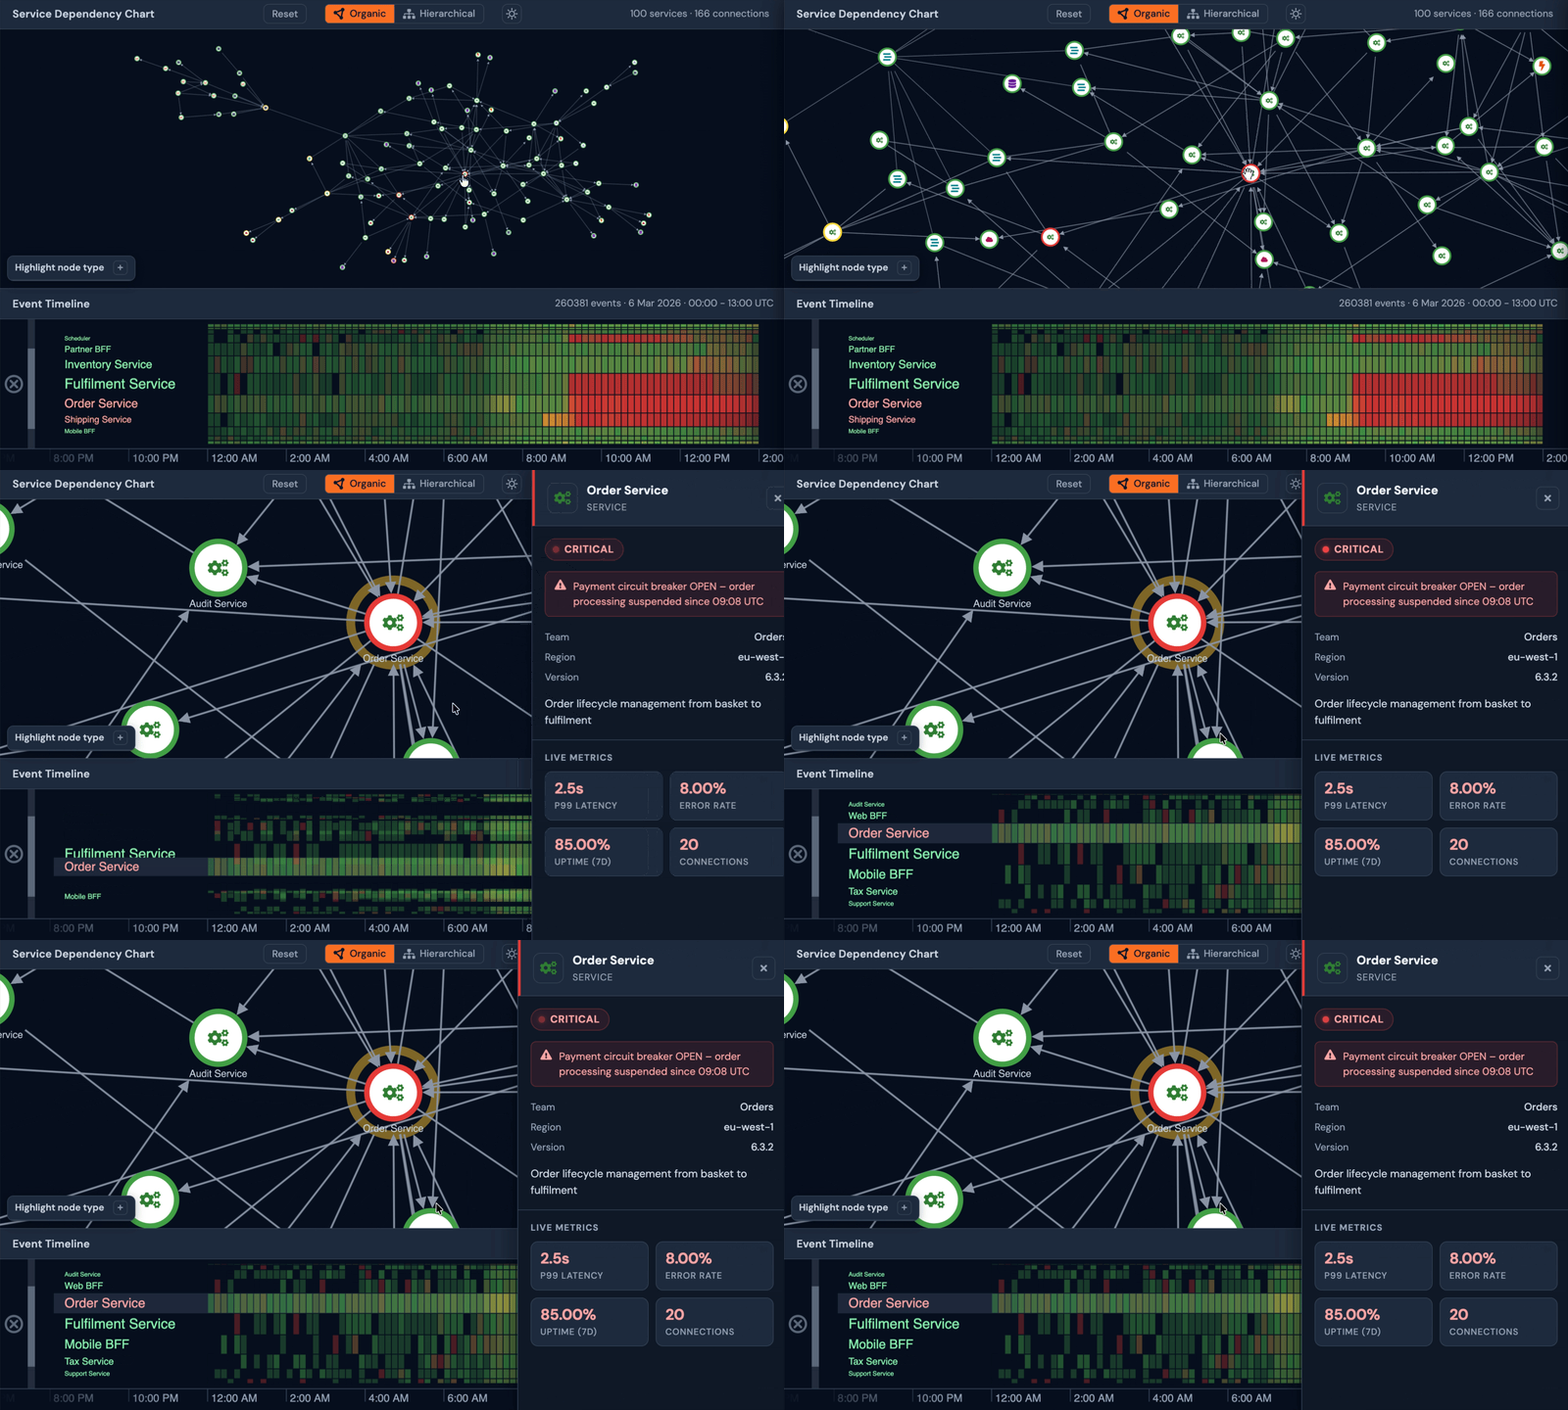
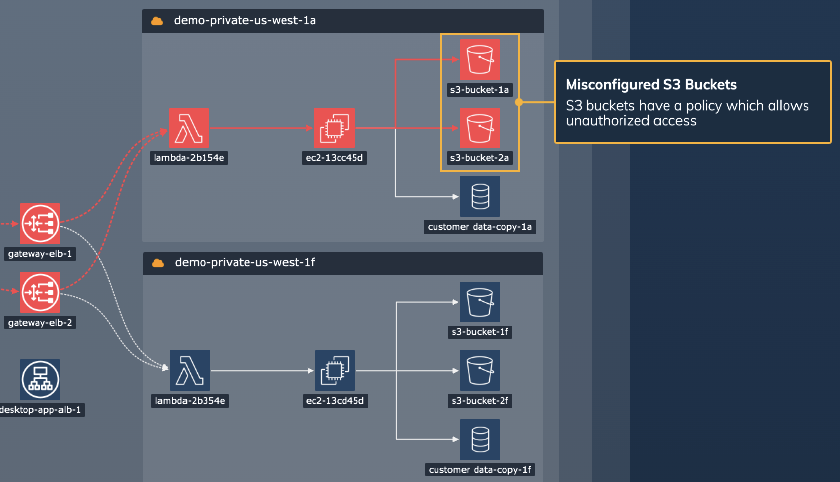
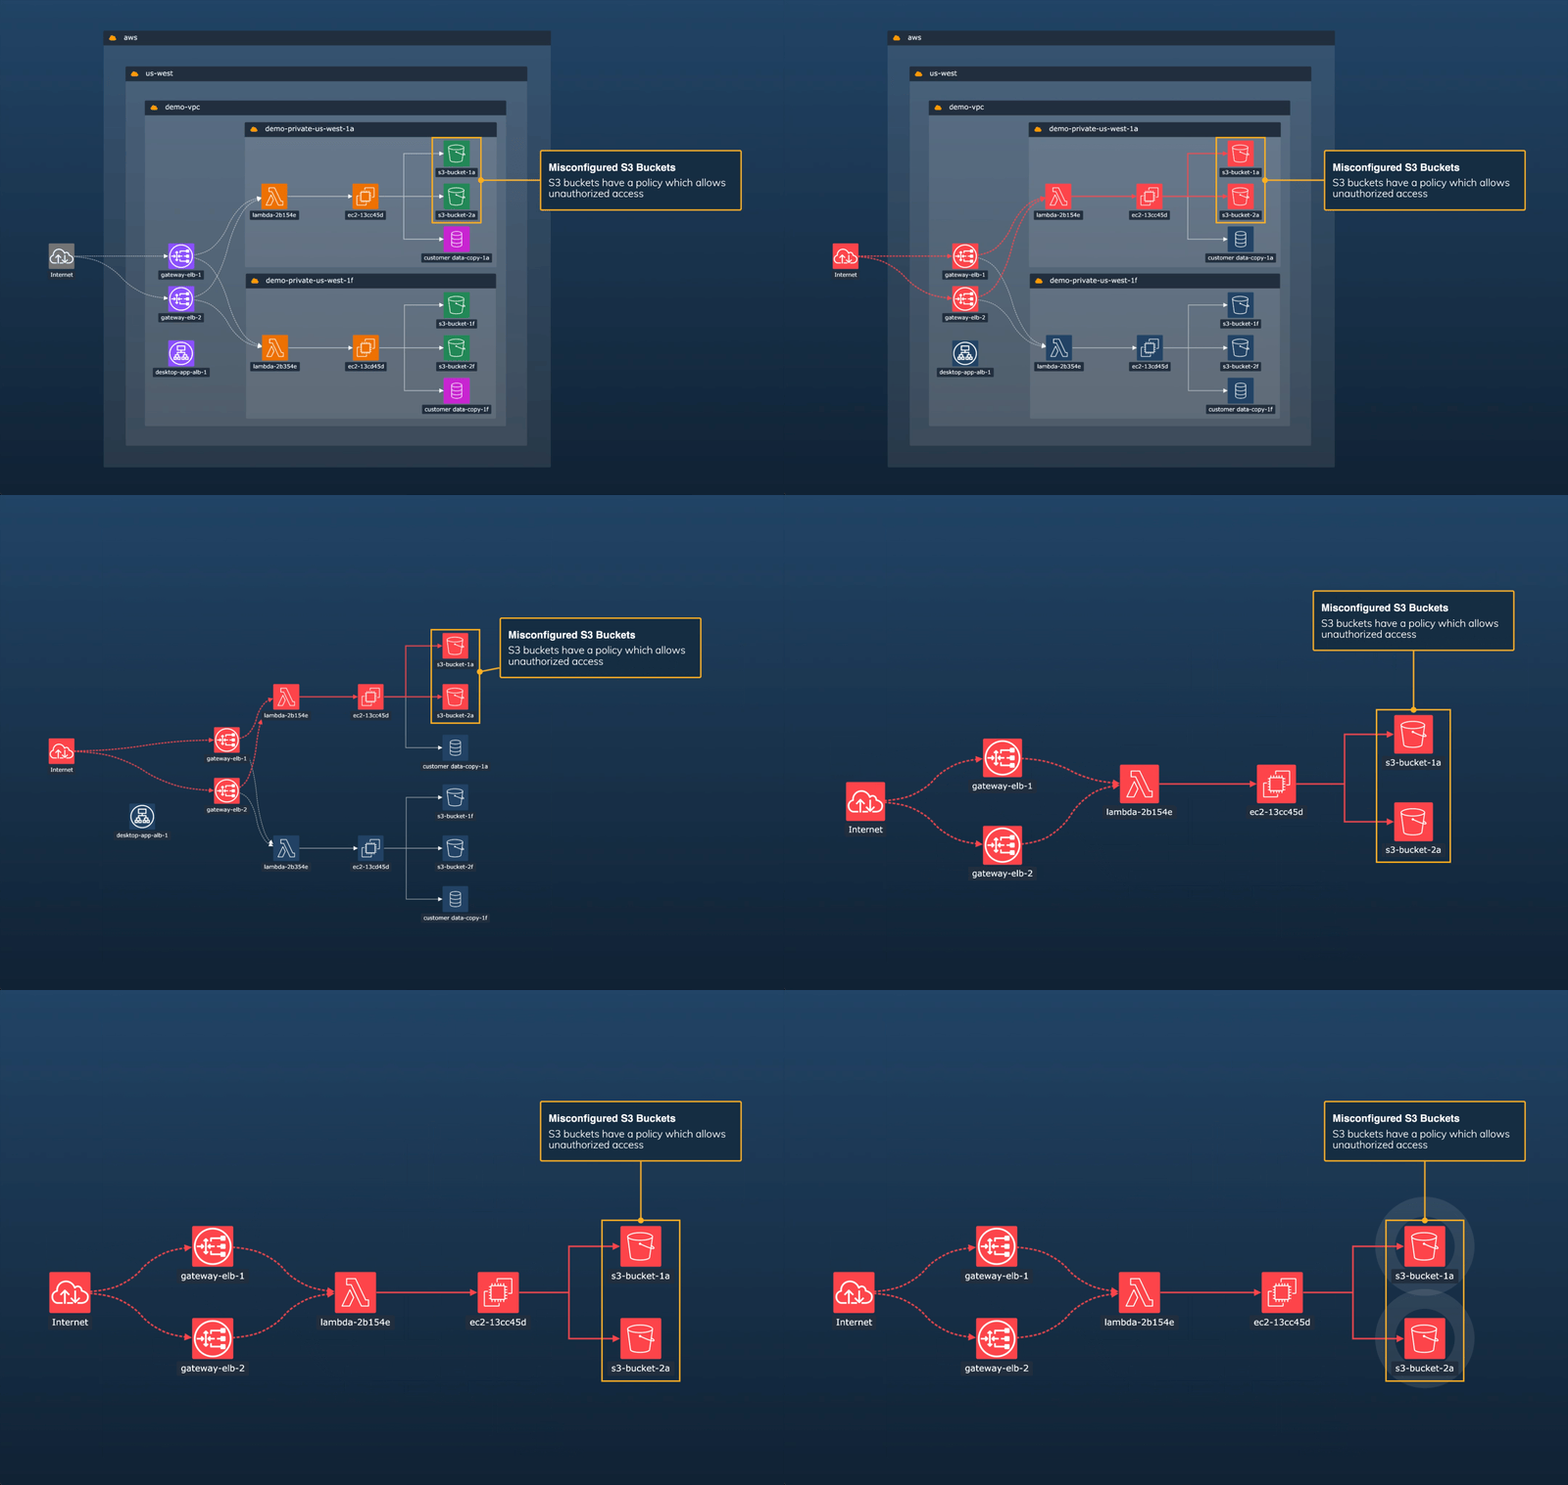

The showcase presents a network traffic log as a timeline alongside a topology graph. Instead of scanning rows of log data, analysts can see when activity happened and where alerts sit within the wider pattern.
The graph shows the systems and external destinations involved, and hovering over a node highlights its corresponding item in the timeline. Likewise, hovering over an item in the timeline highlights the corresponding route in the topology view. This helps analysts connect a moment in time with the machines, IP addresses or websites involved.
Using a KronoGraph time series chart, the continuous view of time series data makes it really easy to see where the CPU and memory usage spiked (together with the alert), and it guides the user where exactly they should be zooming in. In this example, the workflow helps analysts examine which external sites were visited before and after a user accessed the "Histon Chop Shop" website.
What you can evaluate
For product and engineering teams, this showcase demonstrates how the SDKs can support forensic analysis of network traffic. It highlights synchronized timeline and topology views, temporal filtering, time series charts, and alert overlays for investigating log data visually.
The workflow supports a core network forensics task: turn timestamped logs into a sequence analysts can follow and then connect suspicious activity to the systems involved.