- We have updated some internal branding.
3.10.1
3.10.0
Features
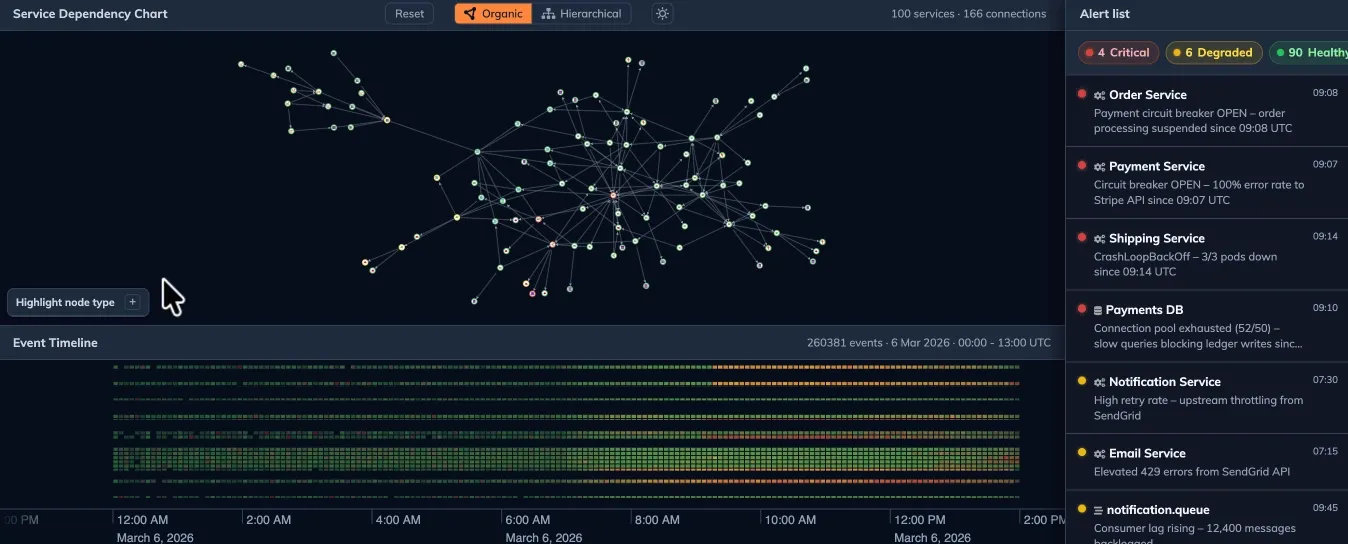
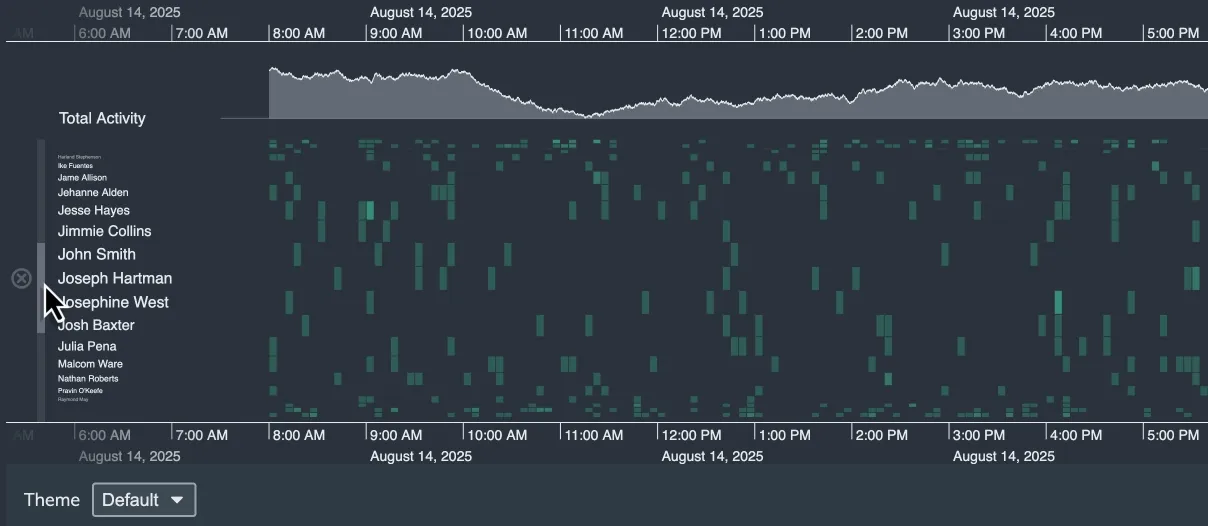
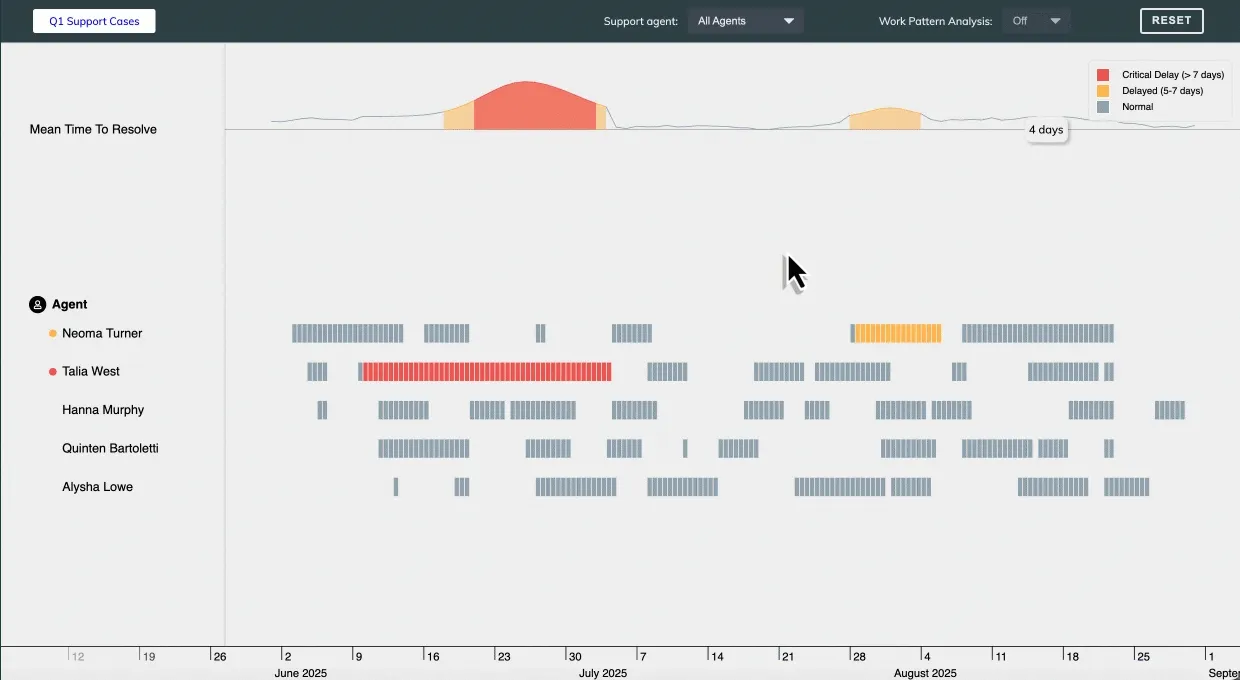
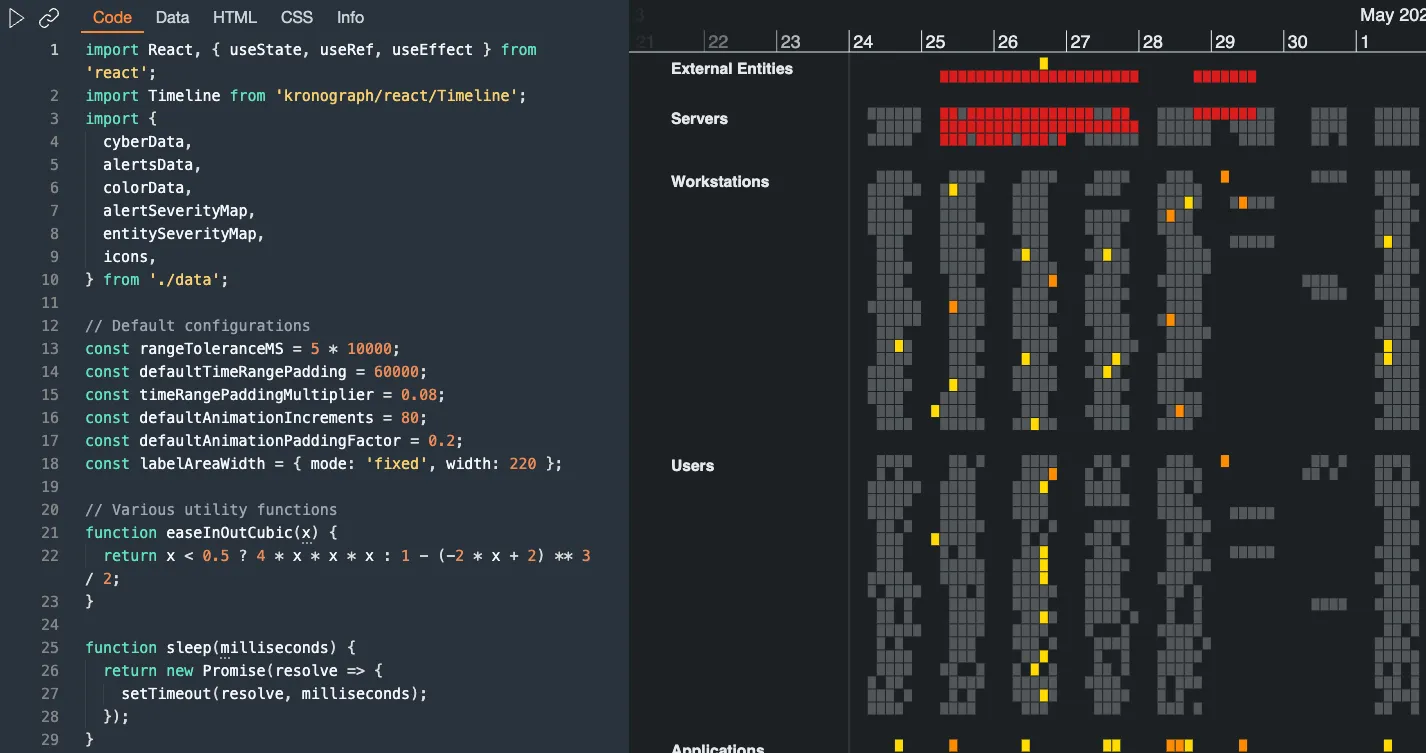
- KronoGraph can now performantly visualize and explore datasets containing hundreds of thousands of events such as MapWeave observational data. This means you can pan and zoom heatmaps at scale while still being able to seamlessly home in and view the finest details, as illustrated in our new Cloud Monitoring demo. If you're using large datasets, our new Performance Tips section also outlines design tips and tricks for optimizing the performance of your KronoGraph app so that you can scale up your data efficiently.
Enhancements
- Take a look at our new Testing Tips section for advice about automated integration testing. It outlines the APIs we provide for obtaining information about entities and events in the timeline, which you can then use within your test framework.
- If you're thinking about using font icons to style different types of items in the timeline, such as entities, events or markers, then we've updated our stories, examples and the Font Icons section to be clearer.
Bugs Fixed
3.9.0
Features
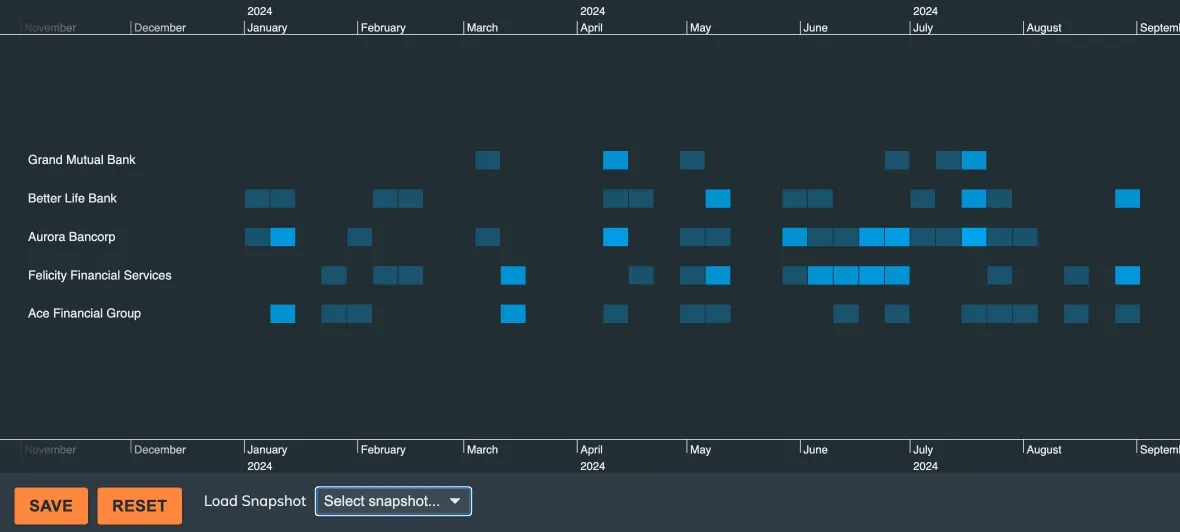
- We've made it easy to save a snapshot of your timeline that you can reload at any time. This provides a great starting point for stepping through your analysis to demonstrate how you reached a particular conclusion, and help share your discovery journey with others. The Save/Load Snapshot story illustrates how to implement and use this.
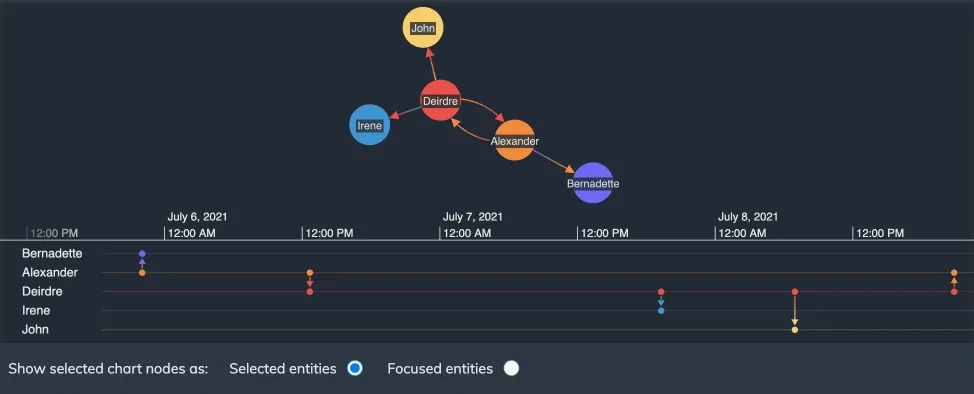
- By default, when only a few entities are shown, they're clustered around the horizontal midline. Now you can choose a justified layout, that spaces out the entities and other information, such as font icons or event labels, more widely. Take a look at the Entity Spacing story.
- We've launched new MCP servers across our products to help AI agents in your code editor interact with our APIs and documentation. Use the KronoGraph MCP server to get better assistance during KronoGraph development, or add our MCP servers together when integrating multiple products. See the MCP Servers documentation for details.
3.8.0
Features
- You can now set a base color for lens-related controls, using color, as demonstrated in the Lens story. This new feature provides a coherent palette for all lens-related controls, including the scroll bar, and allows you to create light and dark themes for your timeline, as illustrated in the Styling the Timeline story. It allows you to customize your lens control appearance more easily, replacing a previous workaround that used an entityType
labelColorto specify it indirectly. If you used this, you can preserve your lens color by setting color to the value of your default entityTypelabelColor. - Our popular Supply Chain Investigation demo can now also be opened in a playground so you can explore, modify and run the demo code, or use it as an inspiration to help get you started more quickly on your own projects.
Advance Notice: End of support for Windows 10
We are ending support for Windows 10 from 31 March 2026, following Microsoft ending support for Windows 10. See Supported platforms & operating systems for details.
Bugs Fixed
- When the properties of timeline options are set to
undefined, their default values are now applied. - If heatmapThreshold is set to a high value, KronoGraph now handles large numbers of events more performantly.
- Highlights and selection boxes are now aligned consistently regardless of whether entities have glyphs or not.
- Event positions are now correct for events within an event fold where the fold is not visible.
- Entity labels that include text and icons are now truncated correctly.
3.7.0
Features
- We continue to streamline the process of integrating KronoGraph with our other products by offering entity selection functionality, in addition to the existing focus and pin APIs. Entities can now be selected - either programmatically, or by enabling users to select them directly within the timeline. Explore this in the KronoGraph and KeyLines Basics story, KronoGraph and ReGraph Basics story, which also demonstrates how entity selection compares to focus. focus. This feature has been released in beta, which means it's fully functional, but could be subject to change. If you have any feedback or questions, please let us know via support.
- Continuing our push to make more showcase demo code available to you, our popular Geospatial Timelines showcase can now be opened in a playground so you can add your own data, or use the code to get you started more quickly on your own projects.
Enhancements
- Event folds now provide a more consistent user experience as, when opened, they now display associated font icons, as shown in the Font Icons story.
Deprecated APIs
- With the introduction of the new entitySelection API, entitySelection prop, we have deprecated the old selection API, selection prop, which applies to events only. We have renamed the
selectionAPI to eventSelection theselectionprop to eventSelection for clarity. It remains fully supported for now, but we recommend that you replace it.
3.6.0
Features
- We've recently released a new geospatial visualization product, MapWeave, and so now provide examples to show how easy it is, and how valuable it can be, to integrate it with KronoGraph:
- A new MapWeave integration story which helps you to get up and running, and use KronoGraph to filter and interact with a MapWeave network layer. These interactions between chart and timeline allow users to explore geospatial information as it evolves over time.
- We've updated the existing Geospatial Timelines showcase (shown above) to use MapWeave and its network and observations layers for Intelligence use cases.
- Continuing our push to make more of our showcase demo code available to you, our popular Phone Call Analysis demo can now be opened in a playground so you can add your own data, or use the code to get you started more quickly on your own projects.
- When the timeline is continuously updating with new data, the firing of the range change event is, changes to the range prop are, by default, throttled with a 500ms delay. You can now modify this using rangeEventDelay to suit your UX and app requirements.
Bugs Fixed
- The load performance when using expanded rows has been improved.
- When hidden timeline components receive new data, and are then made visible, they are now populated as expected, and are no longer sometimes blank.
3.5.0
Features
- The new Expanded Rows feature allows entity timelines to expand from a single row to multiple sub-rows, displaying close events, such as those indicated by event summaries, as separate events on different sub-rows. This helps users zoom in on busy areas and see individual events more clearly, especially when duration events overlap other events. See this working in the Expanded Rows story. This feature has been released in beta, which means it's fully functional, but could be subject to change. If you've got any feedback or questions, please let us know via support.
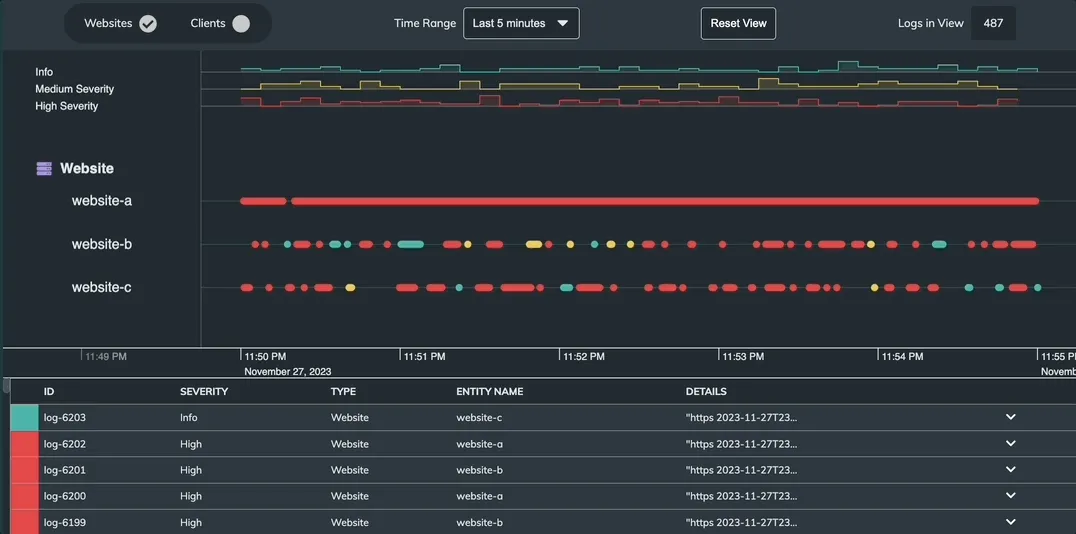
- You can now open and edit the Log Visualization & Analysis showcase in a playground, making it easier to experiment with modifications, or re-use snippets from it.
Bugs Fixed
-
ping animations now work with duration events when using nonlinear scale mode.
-
ping animations now work with duration events when using nonlinear scale mode.
-
If wrapping is set to 'undefined', it now defaults to being off.
-
Time series charts set with no data now display an empty chart with no error message.
3.4.2
- A React versioning issue associated with using
npmto install the download bundle has been fixed.
3.4.1
- We recently launched the Cambridge Intelligence Figma Design Kit, which helps accelerate the design and build of your graph and timeline visualizations. It is now available to download here.
3.4.0
Features
- We have introduced a new Log visualization showcase that illustrates how to use KronoGraph to incorporate a responsive timeline showing the resources involved with each logged event. You can use this to extend conventional observability platforms, so that you can quickly spot patterns or trouble spots, while still being able to drill down into individual logs.
Enhancements
- The technology behind the KronoGraph Playground has been updated and improved, loading more quickly to provide a better development experience.
Bugs Fixed
- When event folds that include events with labels are opened, they no longer overlap adjacent events.
3.3.0
Features
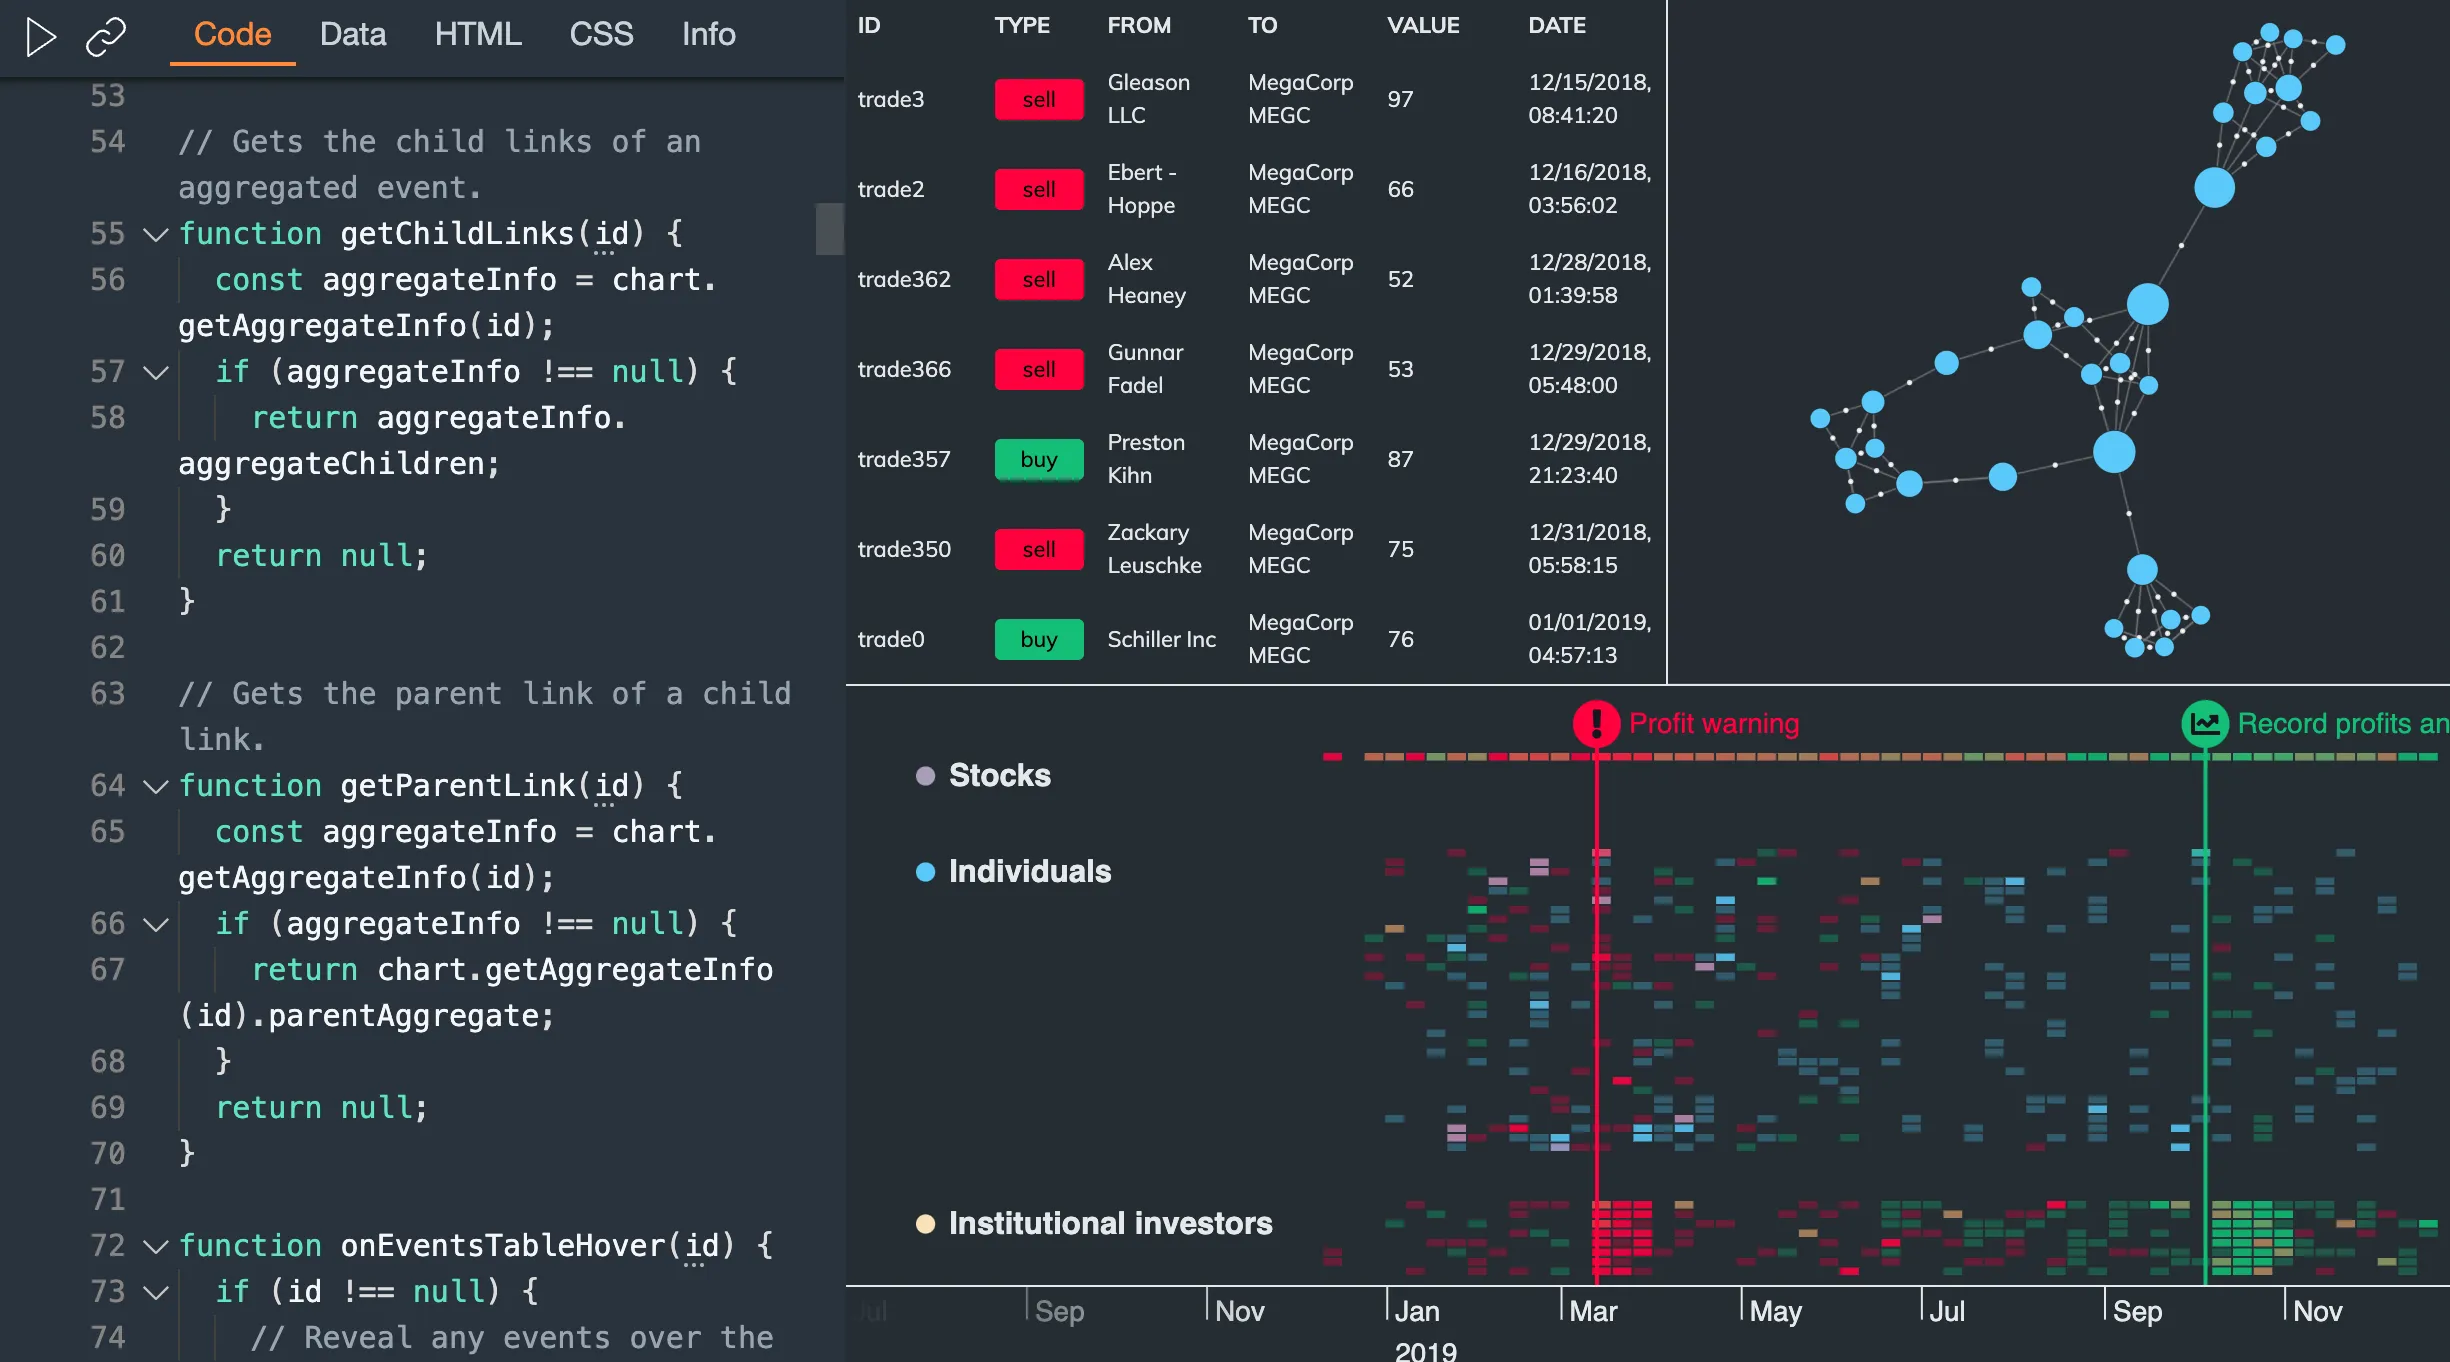
- We have introduced a new event labels feature. You can now add short text or font icon labels to event lines in your timeline, which scale with your data, appearing as hints when there isn't enough room. You can configure their shape, orientation and color, or simply let them automatically inherit the color from their respective event lines (including gradients), instantly producing elegant results.
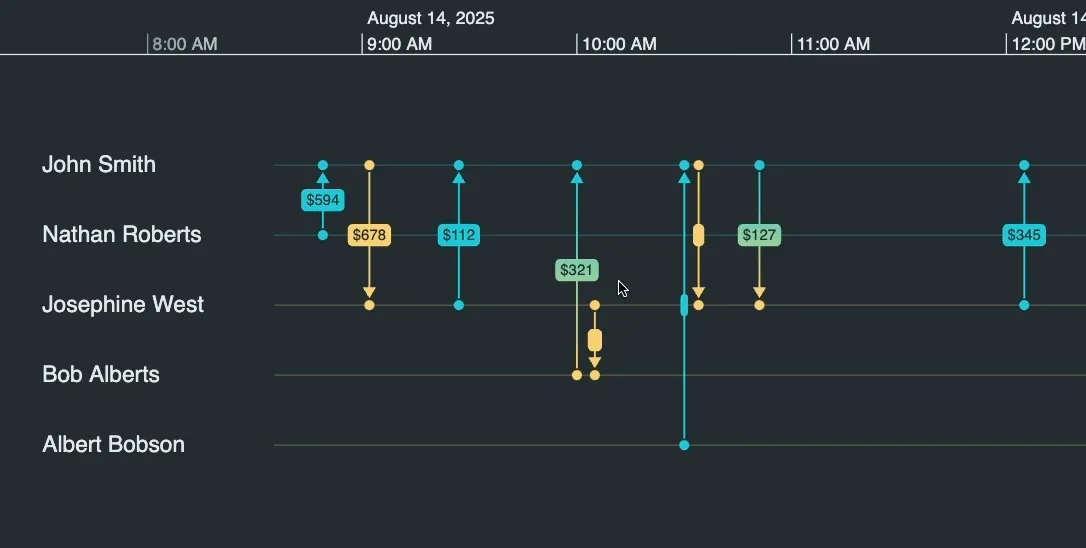
- We updated the Credit Card Fraud demo to showcase the new event labels feature.
Enhancements
- We improved our Getting Started docs by providing tabs to select your package manager. You can now select from
npm,yarnandpnpmwhich will automatically offer up the correct code snippets. - We updated the Obfuscation Requirements docs to include a statement about your obligations with regards to any applicable Open Source Software (OSS) licenses.
Bugs Fixed
- We updated the Detection and Response demo to comply with React 19.
- We've added React as an optional peer dependency to the product bundle to address potential warnings from package verification tools.
3.2.0
Features
- Our popular Detection and Response demo now features a new Open in Playground button so you can explore, modify and run the demo code, or use the demo as an inspiration in your own development.
Enhancements
- We've documented our new internal security process, and the new internal scanners that we use to further improve the security, consistency and quality of our codebase. Read more in the KronoGraph Development docs.
Bugs Fixed
-
The panLimit is correctly set to 'off' when events have nanosecond times specified.
-
The bounds for marquee drag in the scale area are now calculated more accurately.
-
There is no longer a gap between the label area and the timeline when the focus and pin controls are hidden and labelAreaWidth is set to 'auto'.
-
The getEventPosition API now reports correct
ycoordinates when called within the range event.
3.1.0
Features
Have you ever wondered how we make our showcase demos work with KeyLines? We've created an Integration Playground so you can take a look. It's fully commented, so you can learn how the interactions between the chart and the timeline work. You can even add your own data, just make sure that it's in the correct KronoGraph format.
Have you ever wondered how we make our showcase demos work with ReGraph? We've created an Integration Playground so you can take a look. It's fully commented, so you can learn how the interactions between the chart and the timeline work. You can even add your own data, just make sure that it's in the correct KronoGraph format.
Breaking Changes
Based on customer feedback, we have introduced a minor breaking change to the annotations in beta.
The value passed to the id property in the event handler of KronoGraph events no longer varies for different interacted annotation parts and it now always contains the id of the annotation.
Instead, to show which part of the annotation was interacted with, we've added new possible values for the the targetType property in the event handler which include 'annotationBody', 'annotationDeleteButton' and 'annotationEditButton'.
See Handling Events for more details.
See Handling Events for more details.
Bugs Fixed
- The annotation connector line for a single annotation no longer disappears when its dragged over an event line and the container style is set to 'none'.
- The annotation connector no longer overlaps the container when panning.
- dateTimeNames and dateTimeFormats are updated correctly when switching between locales.
- Passing invalid heatmapColor values no longer causes an issue and correctly reverts to default colors.
- Padding has been added between the entity label and the edge of the label area when the heatmap is shown.
- Event fontIcons are now displayed correctly when closed event folds are in the visible time range.
3.0.0
Annotate your data to reveal the hidden narrative
Our powerful new annotations feature reveals the story of your visualized data. Annotating key events adds context to the timeline, making the data more accessible and understandable.
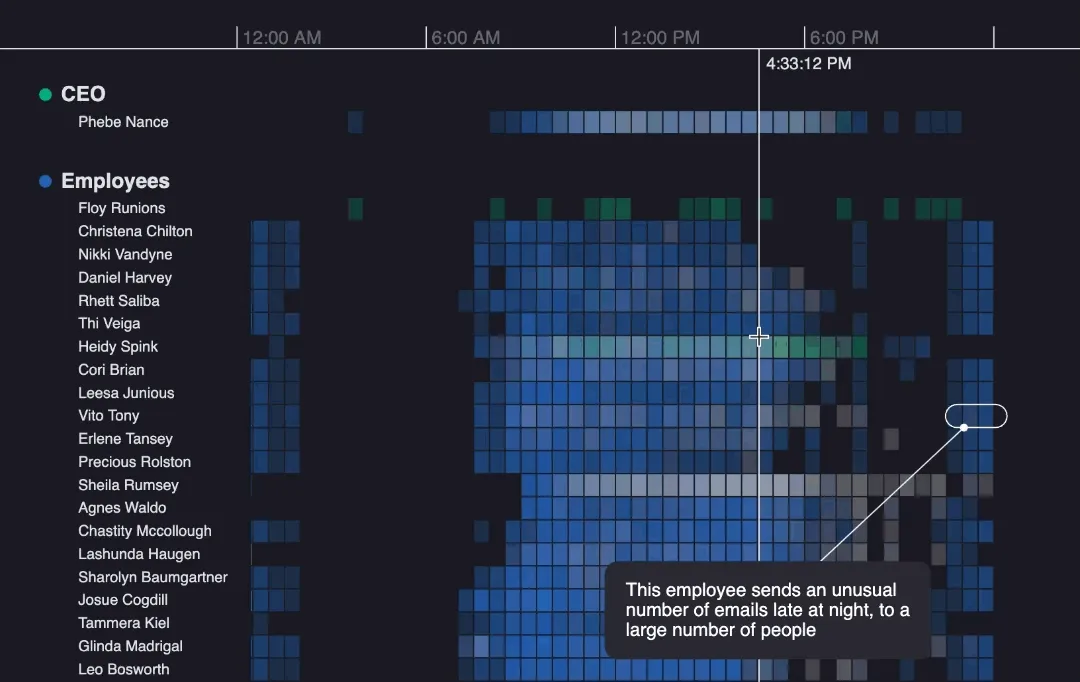
You can either bring annotations into the timeline automatically as your data loads, or add them to key data points to highlight what's important. We've added annotations to our existing showcases to inspire you, including the Worldwide Terrorism demo, the Email Analysis demo and the Credit Card Fraud demo.
The new annotations annotations API provides the flexibility to style and position annotations on your timeline and tie them in to your overall product design. Take a look at the Styling Annotations story to try out some of the options.
To get started, dive into the Annotations docs and create your annotated timeline.
Annotations has been released in beta. This means that it is fully functional, but could be subject to change. If you've got any feedback or questions, please let us know via support.
Introducing Event Selection
KronoGraph now offers event selection functionality with the new selection API. To use it, simply enable selectionMode.
KronoGraph now offers event selection functionality with the new selectionMode prop. To use it, simply enable selectionMode.
Combine annotations with event selection functionality to identify those interesting events and areas of the timeline. An example of how this might work is shown in the Creating Annotations story.
Nonlinear scale mode allows smarter event spacing
The new nonlinear scale mode compresses and expands time when there are dense clusters of events, large gaps between events, or you want to maximize timeline space for exported images. This can make it easier to see what's happening when the events in your timeline occur at irregular intervals.
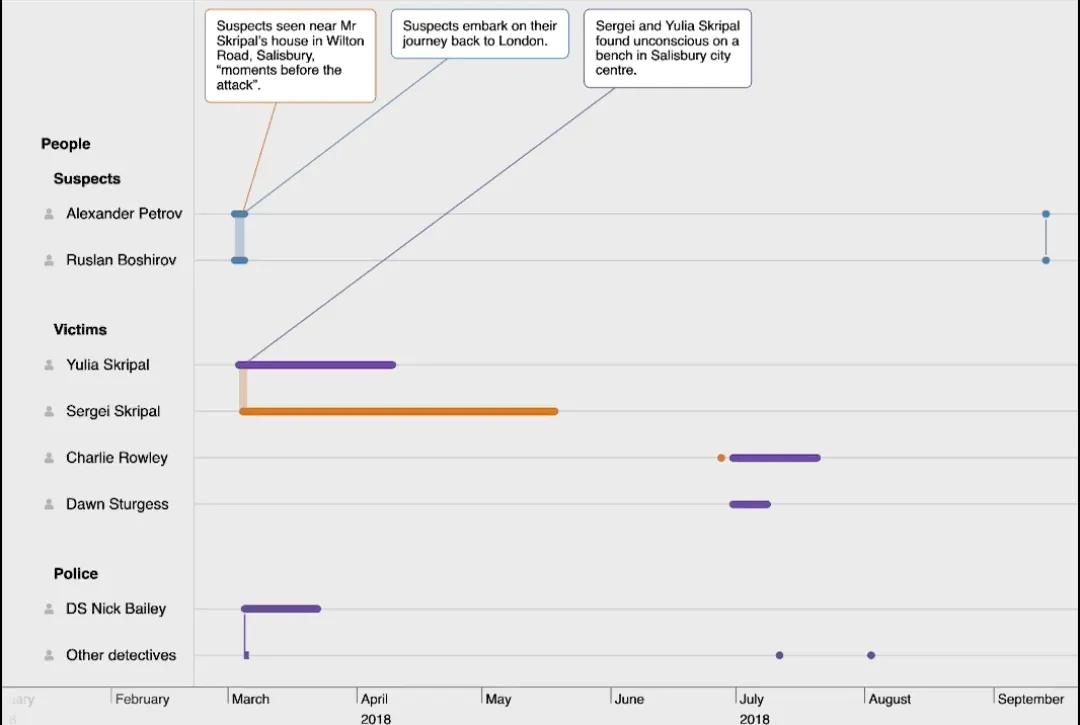
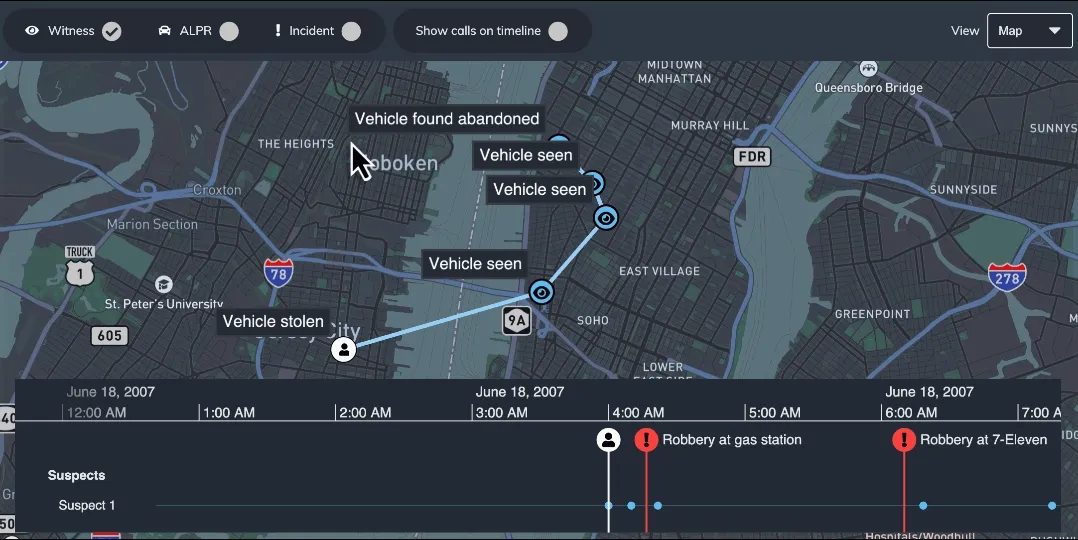
Try it out by setting the scaleMode to 'nonlinear' to see the effects on your timeline. Find out how it works in the the Scale Mode docs or explore the benefits in the Crime Investigation demo or the Nonlinear Scale Mode story.
Breaking Changes
-
Time series chart
Idsmust now be unique. If your time series charts share ids with an entity or event they must be renamed. -
The options prop now only applies the current set of options.
Removed API
These APIs were deprecated in the 2.4 release. Use Glyphs instead.
showCircleshas been removed from the entities option.fontIconhas been removed from the entity data format.fontIconhas been removed from the entityType data format.
This API was deprecated in the 2.0 release. It no longer had an effect, but now it will need to be removed from your code.
priorityhas been removed from the entityType data format.
Bugs Fixed
- The lens now closes when lens is set to null.